In the paper “The central action of the 5-HT2 receptor agonist 1-(2,5-dimethoxy-4-iodophenyl)-2-aminopropane (DOI) on cardiac inotropy and vascular resistance in the anaesthetized cat” by Andrew G. Ramage and M. de Burgh Daly, British Journal of Pharmacology (1998), 125, 1172–1179 the figures were not considered to have been sufficiently legible, they are therefore reproduced below.
Figure 1.
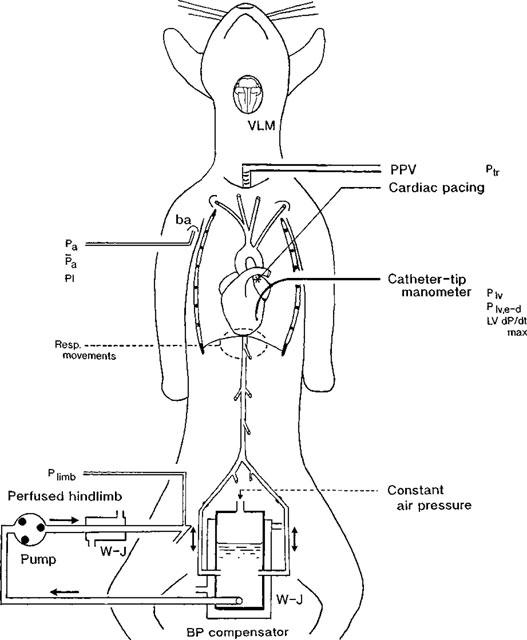
Diagrammatic representation of the preparation. Positive pressure ventilation (PPV) was applied, the chest being opened in the mid sternal line. A pneumatic method was used to measure qualitatively central respiratory movements. The heart was paced and a catheter-tip manometer was inserted into the left ventricle via the left atrial appendage. Arterial blood pressure was measured from the right brachial artery (ba). The right hindlimb was vascularly isolated and perfused at constant flow with blood from the blood pressure (BP) compensator, the pressure in which was controlled by an air-leak bypass system. The compensator was connected to cannulae inserted rostrally in the femoral arteries. It was surrounded by a water-jacket (W-J) maintained at 37°C. The ventrolateral medulla (VLM) was exposed after carrying out a laryngectomy. Measurements were made of Pa,  , phasic and mean arterial blood pressure; PI, pulse interval; Ptr, tracheal pressure; resp, respiratory movements; P lv, left ventricular pressure; P lv, e-d, left ventricular end-diastolic pressure; LV dP/dt max, maximum rate of rise of left ventricular pressure; and P limb, hindlimb mean perfusion pressure.
Figure 2.
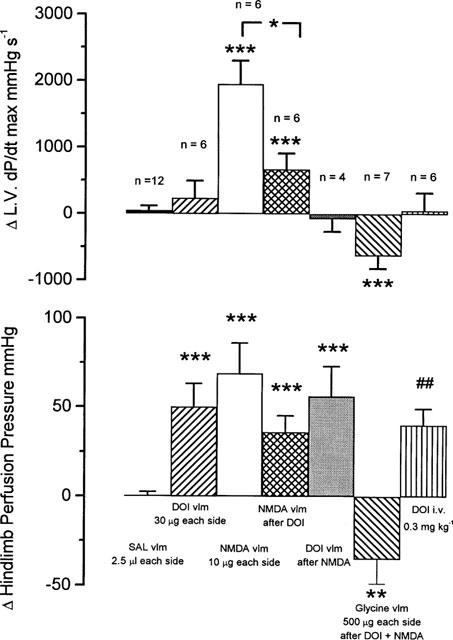
Anaesthetized cats: histograms showing the change (Δ) in left ventricular (L.V.) dP/dt max (mmHg s−1) and hindlimb perfusion pressure (mmHg) caused by bilateral application on disks of filter paper 3 mm in diameter of sodium chloride (NaCl 154 mM) 2.5 μl each side; DOI 30 μg each side; N-methyl-D-aspartic acid (NMDA) 10 μg each side (these data include data from two animals in which the adrenal glands had been bilaterally ligated); NMDA after DOI; DOI after NMDA; glycine 500 μg each side after the application of DOI and NMDA; and DOI 300 μg kg−1 i.v. Each histogram represents the mean change and the bars show the s.e.mean. Changes caused by the test substances are compared with those caused by sodium chloride solution or as indicated using a Student's unpaired t-test *P<0.05 **P<0.01, ***P<0.001. For i.v. DOI actual values before and after drug were compared using Student's paired t-test. ##P<0.01.
Figure 3.
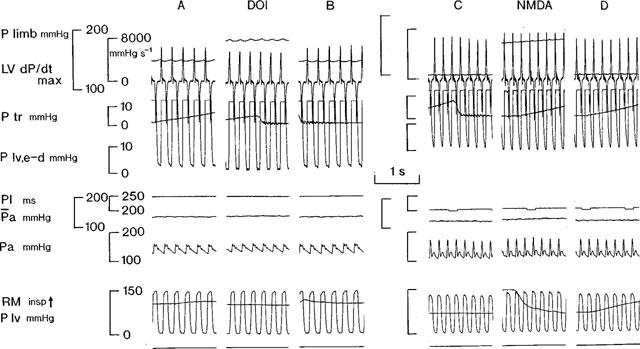
Artificially ventilated anaesthetized cats: traces showing the effects of topical application to the ‘glycine-sensitive area' of the ventrolateral medulla of DOI, 30 μg each side, from one experiment, and from another, NMDA, 10 μg each side. In each experiment the heart was electrically paced and the mean arterial blood pressure was maintained constant. Panels A and C, initial control states 1 min before the application of the drugs to the medulla; panels B and D, final control states after rinsing the medulla with sodium chloride solution, 154 mM. Panel DOI was taken 3 min after the application of the drug, panel B 5 min after rinsing the area with sodium chloride solution. Panel NMDA was taken 2 min after the application of the drug, panel D 8 min after rinsing the area with the sodium chloride solution (154 mM). Records from above downwards: P limb, hindlimb mean perfusion pressure; LV (left ventricular) dP/dt max; Ptr, tracheal pressure; P lv, e-d, left ventricular end-diastolic pressure; PI, pulse interval; Pa,  , phasic and mean arterial blood pressure; RM, respiratory movements (inspiration upwards); P lv, left ventricular pressure. Time calibration, 1 s.
Figure 4.
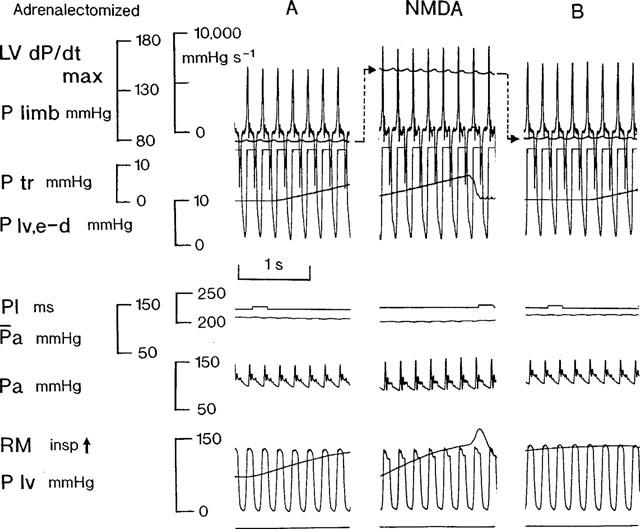
Artificially ventilated anaesthetized cat: traces showing the effects of topical application to the ‘glycine-sensitive area' of the ventrolateral medulla of NMDA, 10 μg each side, in which the adrenal glands had been ligated. The heart was electrically paced and the mean arterial blood pressure was maintained constant. Control state panel A was taken 1 min before the application of NMDA. Panel NMDA was taken 2 min into the test, panel B 5 min after rinsing the ventral medulla with sodium chloride solution (154 mM). Records from above downwards: LV (left ventricular) dP/dt max; P limb, hindlimb mean perfusion pressure; Ptr, tracheal pressure; P lv, e-d, left ventricular end-diastolic pressure; PI, pulse interval; Pa,  , phasic and mean arterial blood pressure; RM, respiratory movements (inspiration upwards); P lv, left ventricular pressure. Time calibration, 1 s. For clarity, the arrows show the changes in the positions of the P limb trace between panels.
Figure 5.
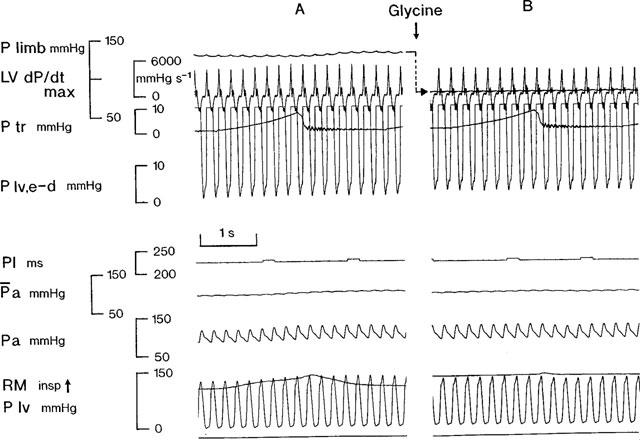
Artificially ventilated anaesthetized cat: traces showing the effects of topical application to the ‘glycine-sensitive area' of the ventrolateral medulla of glycine, 500 μg each side, after previous application of DOI and NMDA. The heart was electrically paced and the mean arterial blood pressure was maintained constant. Control panel A was taken 1 min before the application of glycine, panel B 3 min into the test. Records from above downwards: P limb, hindlimb mean perfusion pressure; LV (left ventricular) dP/dt max; Ptr, tracheal pressure; P lv, e-d, left ventricular end-diastolic pressure; PI, pulse interval; Pa,  , phasic and mean arterial blood pressure; RM, respiratory movements; P lv, left ventricular pressure. Time calibration, 1 s. For clarity, the change in position of the P limb trace between panels A and B is shown by the arrow.


