Abstract
Differentiated NG108-15 neuroblastoma×glioma hybrid cells were whole-cell voltage-clamped. Hyperpolarizing pulses, superimposed on a depolarized holding potential (−30 or −20 mV), elicited deactivation currents which consisted of two components, distinguishable by fitting with two exponential functions.
Linopirdine [DuP 996, 3,3-bis(4-pyridinylmethyl)-1-phenylindolin-2-one), a neurotransmitter-release enhancer known as potent and selective blocker of the M-current of rat sympathetic neurons, in concentrations of 5 or 10 μM selectively inhibited the fast component (IC50=14.7 μM). The slow component was less sensitive to linopirdine (IC50>20 μM).
The class III antiarrhythmics [(4-methylsulphonyl)amido]benzenesulphonamide (WAY-123.398) and 1-[2-(6-methyl-2-pyrydinil)ethyl]-4-(4-methylsulphonylaminobenzoyl) piperidine (E-4031), selective inhibitors of the inwardly rectifying ERG (ether-à-go-go-related gene) potassium channel, inhibited predominantly the slow component (IC50=38 nM for E-4031). The time constant of the WAY-123.398-sensitive current resembled the time constant of the slow component in size and voltage dependence.
Inwardly rectifying ERG currents, recorded in K+-rich bath at strongly negative pulse potentials, resembled the slow component of the deactivation current in their low sensitivity to linopirdine (28% inhibition at 50 μM).
The size of the slow component varied greatly between cells. Accordingly, varied the effect of WAY-123.398 on deactivation current and holding current.
RNA transcripts for the following members of the ether-à-go-go gene (EAG) K+ channel family were found in differentiated NG108-15 cells: ERG1, ERG2, EAG1, EAG-like (ELK)1, ELK2; ERG3 was only present in non-differentiated cells. In addition, RNA transcripts for KCNQ2 and KCNQ3 were found in differentiated and non-differentiated cells.
We conclude that the fast component of the deactivation current is M-like current and the slow component is deactivating ERG current. The molecular correlates are probably KCNQ2/KCNQ3 and ERG1/ERG2, respectively.
Keywords: E-4031; WAY-123,398; linopirdine; M-current; ERG current; KCNQ; NG108-15 cells
Introduction
Differentiated NG108-15 mouse neuroblastoma×rat glioma hybrid cells possess a non-inactivating K+ current similar to the M-current of sympathetic neurones and therefore named M-like current IK(M, ng) or IM, ng by Robbins et al. (1992). Its presence was detected by characteristic slow deactivation current relaxations when the cell was suddenly hyperpolarized from a level where IM, ng is partly activated to one where it is deactivated (Brown & Higashida, 1988a). When this type of experiment was done in bath solution with high [K+]o (e.g. 54 mM) additional current relaxations were seen which were larger and slower than these expected for deactivation of IM, ng and attributed to ‘some form of additional inward rectifier current' (Brown & Higashida, 1988b). Later, the inward rectifier of NG108-15 cells and similar cell lines was studied in detail by Arcangeli et al. (1995); Faravelli et al. (1996); Hu & Shi (1997). It was found to be very sensitive to class III antiarrhythmic agents such as E-4031 and WAY-123,398, selective blockers of ERG (ether-à-go-go-related gene) channels, and thereby identified as ERG current, IERG. ERG channels in bath with low [K+] (e.g. 5 mM) can carry sustained outward currents during depolarization and outward tail currents upon repolarization (Shibasaki, 1987; Shi et al., 1997; Bauer, 1998).
Our experiments began with the finding that in bath with low [K+] (2.4 mM) NG108-15 cells generate deactivation currents which are highly sensitive to the specific ERG channel blockers WAY-123.398 and E-4031. To understand the origin of these currents it became necessary to separate IM, ng and IERG by pharmacological means and by curve fitting.
Part of the results have been published in abstract form (Meves & Schwarz, 1999).
Methods
Cell culture
Mouse neuroblastoma×rat glioma hybrid cells, clone NG108-15, of passage numbers 14–50 were grown in Dulbecco's modified Eagle's medium (DMEM) supplemented with 10% foetal calf serum, 100 μM hypoxanthine, 0.4 μM aminopterin and 16 μM thymidine. For the experiments, the cells were induced to differentiate by DMEM containing 1% foetal calf serum, 100 μM hypoxanthine, 16 μM thymidine, 10 μM prostaglandin E1 and 50 μM isobutylmethylxanthine for 5–12 days before use.
Recording of currents
Differentiated cells (diameter 30–60 μm) were voltage-clamped in the whole-cell mode with an EPC 7 amplifier (List Electronics) using partial series resistance compensation and pipettes with 2–4 MΩ resistance. Currents were filtered at 1 kHz. The volume of the recording chamber was reduced to 0.8 ml by inserting a perspex ring (internal and external diameter 15 and 35 mm, respectively) into the culture dish. The experiments were done at 30–35°C. A temperature controller from Cell MicroControls (Virginia Beach, VA, U.S.A.) served to control the temperature.
One second pulses from a holding potential of −30 or −20 mV to potentials between −105 and −5 mV were used. The currents at the end of the 1 s pulses were measured and plotted against pulse potential V. Currents at V<−70 mV were taken as leakage currents, extrapolated to other potentials and subtracted from the total current.
ERG inward currents were measured with a pulse programme similar to that used by Bauer (1998) (see inset of Figure 8A). Two 0.5 s prepulses from the holding potential (−20 mV) to +20 and 0 mV, respectively, preceded 160 ms test pulses to potentials between −120 and 0 mV. The two prepulses served to achieve maximum activation of the ERG channels. The currents elicited by the test pulses were recorded. Pulse interval was 10 or 30 s. Most of the capacitative current was compensated with an analogue circuit; leakage current was not compensated.
Figure 8.
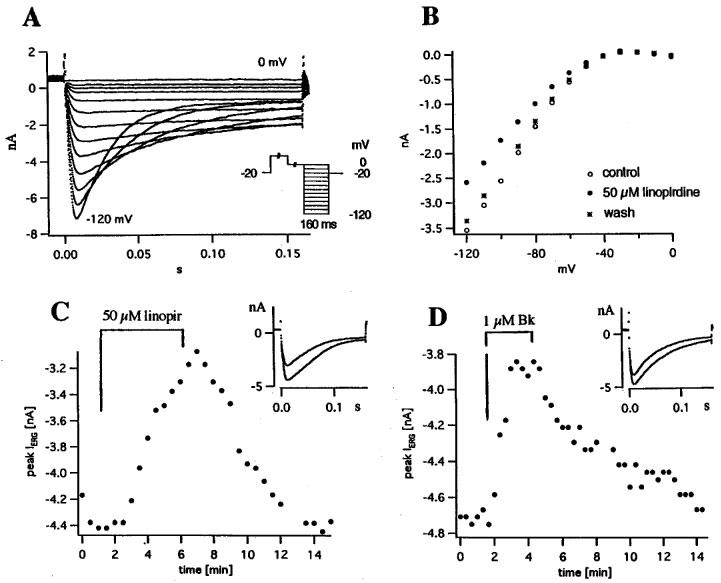
Linopirdine and bradykinin inhibit ERG inward currents recorded in bath with 40 mM K+ at 33.5–35°C. (A) Currents recorded with the pulse programme shown in the inset: Holding potential −20 mV, two 0.5 s prepulses (to +20 and 0 mV, respectively), 160 ms pulses, pulse potentials −120 to 0 mV in 10 mV steps. (B) Peak current vs pulse potential in control, 50 μM linopirdine and wash. (C) Effect of 50 μM linopirdine on peak current; same pulse (V=−120 mV) applied every 30 s; inset shows currents at 1.5 and 7 min. (D) Effect of 1 μM bradykinin on peak current; same pulse (V=−120 mV) applied every 20 s; inset shows currents at 100 and 200 s.
Solutions
Cells were continuously superfused with bath solution (flow rate 0.6 ml min−1). The standard bath for recording IM, ng contained (in mM): NaCl 136, CaCl2 2.6, KCl 2.4, MgCl2 1.2, glucose 10, tetraethylammonium (TEA) chloride 5 and HEPES 15 (pH 7.4, adjusted with NaOH). The 40 mM [K+]o bath for recording IERG contained (in mM): NaCl 93, CaCl2 2, KCl 40, MgCl2 2, HEPES 10 (c.f. Arcangeli et al., 1995). In the 20 mM [K+]o bath, NaCl was increased to 113 mM and KCl decreased to 20 mM. The 6.5 mM [K+]o bath contained (in mM): NaCl 126.5, CaCl2 2, KCl 6.5, MgCl2 2, HEPES 10. The pH of the bath solutions was adjusted to 7.4 with NaOH. Na+ currents were blocked by adding 0.2 μM tetrodotoxin. The composition of the pipette solution was (in mM): K aspartate 140, KCl 30, EGTA 3, CaCl2 0.8, MgCl2 0.15 and HEPES 10; pH 7.2, adjusted with KOH; estimated free [Ca2+] 70–80 nM.
E-4031 and WAY-123,398 were generous gifts from Eisai (Tokyo, Japan) and Wyeth-Ayerst, Princeton (NJ, U.S.A). The drugs were dissolved in distilled water to yield 10 mM stock solutions. Linopirdine was dissolved in 0.1 N HCl to give a 25 mM stock solution (c.f. Lamas et al., 1997). When diluting from this stock solution to the final concentration, pH changes were avoided by adding an appropriate amount of 0.1 N NaOH.
Analysis
For kinetic analysis, currents were fitted with one or two exponentials according to the equations:
with the IGOR programme. IGOR uses the Levenberg-Marquardt algorithm to search for the coefficient values that minimize chi-square. This is a form of non-linear, least-squares fitting.
For the dose-response curve we used the equation:
where c is concentration, IC50 is the concentration required for 50% inhibition and n is the Hill coefficient.
Wherever possible, averages±s.e.mean are given. We used the t-test to decide whether the difference between two average values was significant at the 5% level.
RNA transcripts of members of the EAG and KCNQ family
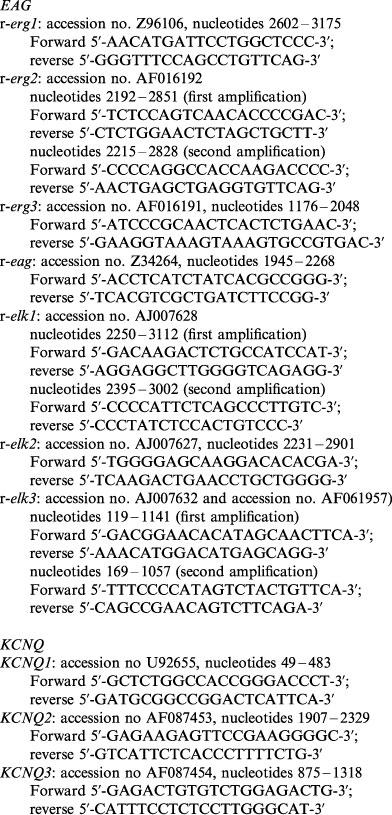
RNA's were extracted from cell cultures of NG108-15 cells using RNAzol™B (AGS; Chomczynski & Sacchi, 1987). DNase digestion was performed before preparing cDNA. One μg of total RNA was employed for oligo (dT) primed reverse transcription using M-MLV reverse transcriptase (Gibco/BRL). The cDNAs were amplified with 1.25 U of Taq DNA polymerase (Stratagene), 1.5 mM MgCl2, 0.2 mM each dNTP in 50 μl reaction assays using 5 pmol of forward and reverse oligonucleotide primers specific for the different channel cDNAs. For amplification we used a predenaturation step at 94°C for 1 min followed by 40 cycles consisting of three temperature steps (94°C for 1 min, annealing temperature for 1 min and 72°C for 1 min) terminated by an elongation step at 72°C for 5 min. The annealing temperature is specific for every primer pair and was calculated from the G/C and A/T content of the oligonucleotide primers used in the reaction. In some cases it was necessary to make nested PCR-reactions using 1/50 of the amplification product of the first reaction as template in the second PCR-reaction. Amplified DNA fragments were analysed by agarose gel electrophoresis. The following oligonucleotide primers were used in the PCR-reactions:
 |
Results
WAY-123.398 and E-4031 inhibit predominantly the slow component of the deactivation currents
Figure 1A shows a record of currents usually called M-like currents IM, ng. The cell is held at −20 mV and the holding current is 1.6 nA. Hyperpolarizing pulses totally or partly deactivate the current, depolarizing pulses augment it. In Figure 1B, currents at the end of the 1 s pulses (corrected for the small leakage current) are plotted against pulse potential. As shown in Figure 1C, the deactivation current at −45 mV can be fitted by a double exponential. Slow and fast component, respectively, have rate constants K2=2.29 and K4=30.68 s−1 and initial amplitudes K1=0.149 and K3=0.587 nA. WAY-123.398 at a concentration of 10 μM has a weak effect. It inhibits the current at −35 and −25 mV by 19 and 16% (Figure 1B) and decreases the holding current (Figure 1D). As indicated by the fit parameters in the figure legend, WAY-123.398 increases the rate constants K2 and K4 and decreases the slow component K1. The difference between the two records in Figure 1D is the WAY-123.398-sensitive current. The small difference current could be fitted by a single exponential with rate constant 2.39 s−1 at −45 mV, similar to the rate constant of the slow component in the control record. The rate constant of the difference current increased at more negative potentials as did the rate constants K2 and K4 (see below and Figure 7).
Figure 1.
 |
Figure 7.
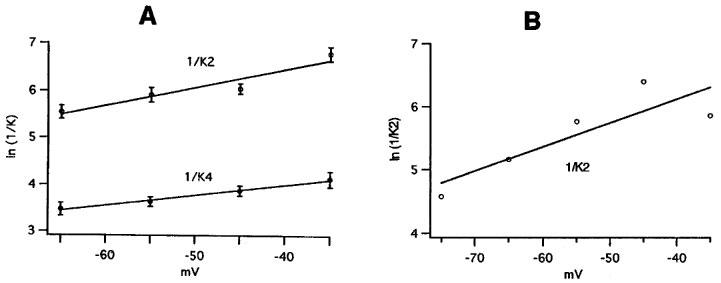
Voltage dependence of the time constants 1/K2 and 1/K4 of the slow and fast component (A) and of the time constant of the WAY-123.398-sensitive current (B). (A) Average values from six cells at 29.0–33.3°C (average 31.4°C). (B) Time constant 1/K2 of the WAY-123.398-sensitive current in the experiment of Figure 1, determined by fitting the difference between control record and record in WAY-123.398 with a single exponential. Temperature 34°C. The slopes of the lines correspond to an e-fold change of the time constant per 45.1 mV (1/K4 in A), 25.8 mV (1/K2 in A) and 26.3 mV (1/K2 in B).
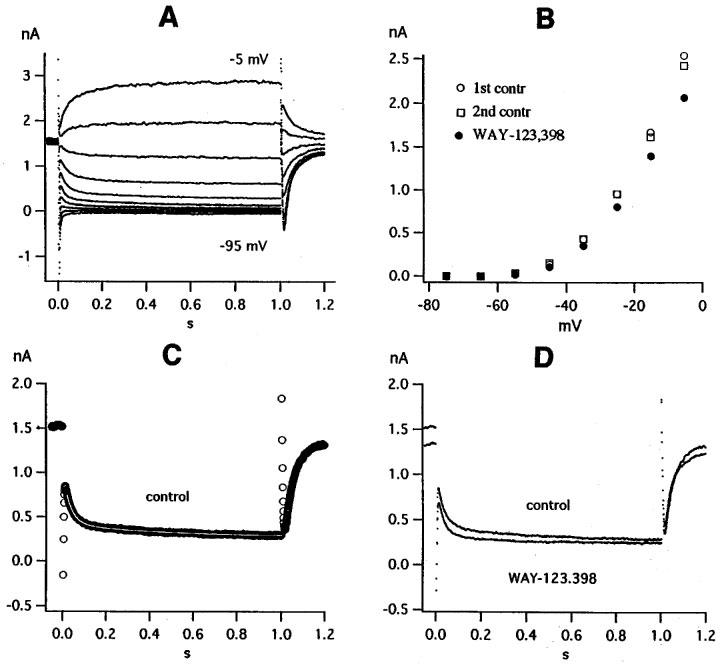
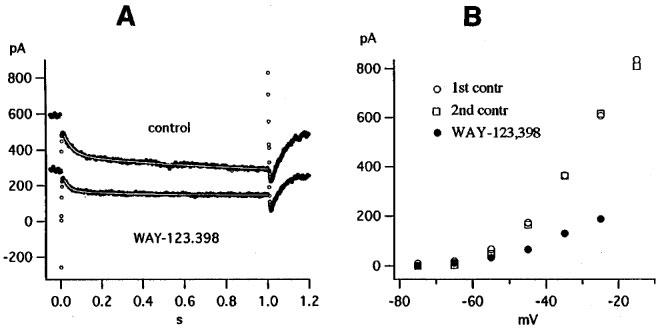
An example for a stronger effect of WAY-123.398 is shown in Figure 2. WAY-123.398 at a concentration of 3 μM markedly reduces the holding current (Figure 2A) and inhibits the currents measured at the end of the 1 s pulses by 64% at −35 mV and by 70% at −25 mV (Figure 2B). As in Figure 1, WAY-123.398 increases the rate constants K2 and K4 and decreases the slow component K1 more than the fast component K3, thereby decreasing the ratio K1/K3 (see fit parameters in figure legend). The difference between control record and record in WAY-123.398 was larger in Figure 2A than in Figure 1D and required two exponentials (rate constants 0.61 and 17.11 s−1) for a proper fit. The effect of WAY-123.398 was slowly and partly reversible upon washing for 10 min.
Figure 2.
 |
If WAY-123.398 affects predominantly the slow component, we would expect a strong effect for cells with a large slow component and a weak effect for cells with a small slow component. We took the ratio K1/K3 in control as a measure of the relative size of the slow component and plotted inhibition by different WAY-123.398 concentrations (measured at −35 mV in 12 different experiments) against control K1/K3 at −45 mV. As shown in Figure 3, inhibition increased with increasing K1/K3. In the concentration range employed (1–10 μM) inhibition depended on K1/K3 rather than on concentration.
Figure 3.
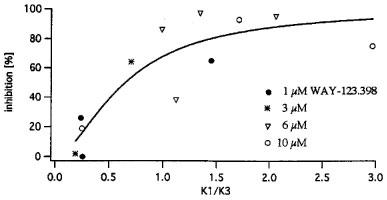
Inhibition of deactivation current (measured at −35 mV) by different WAY-123.398 concentrations versus amplitude ratio slow/fast (=K1/K3) (measured in control at −45 mV).
Experiments with E-4031 were done on cells with K1/K3>0.6, i.e. on cells with a well developed slow component. Figure 4 shows as an example the reversible inhibition of holding current and deactivation currents by 0.1 μM E-4031. Subtraction of the small leakage current gave current voltage relations as in Figure 1B and 2B. The inhibition at −35 and −25 mV was 65 and 67%, similar to the inhibition of the holding current.
Figure 4.
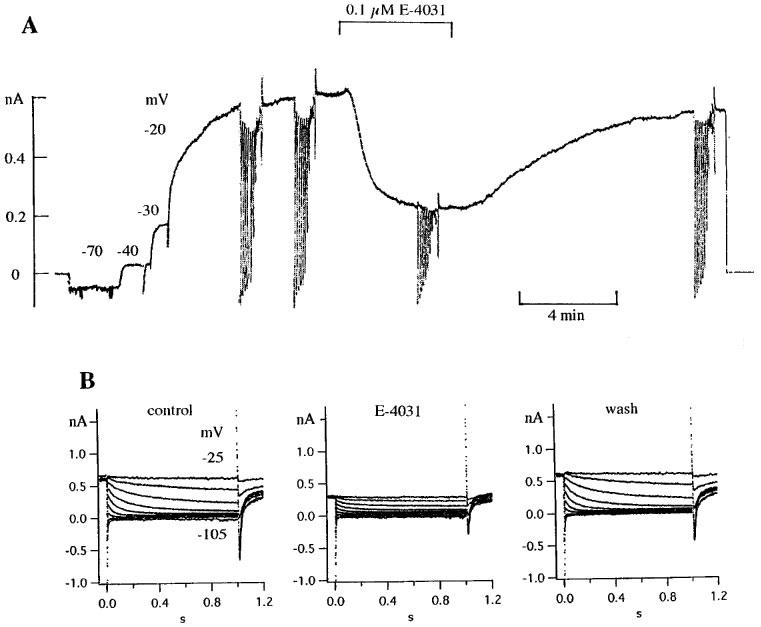
Effect of 0.1 μM E-4031 on holding current and deactivation currents. (A) Pen record showing slow increase of outward current upon changing the holding potential to −20 mV (c.f. Schmitt & Meves, 1993), reversible reduction of holding current by 0.1 μM E-4031 and pulse families recorded before, during and after application of E-4031. (B) Currents elicited by pulse families in control, in E-4031 and after wash; pulse potentials −105 to −25 mV in steps of 10 mV, pulse duration 1 s. Cell diameter 53 μm. Temperature 34.5°C.
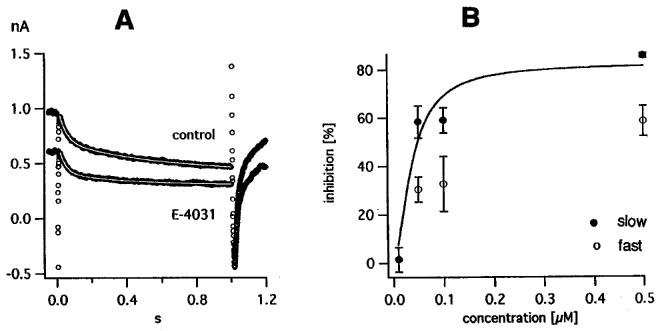
A control record and a record in 0.1 μM E-4031, both at a pulse potential of −45 mV and with double exponential fit superimposed, are shown in Figure 5A. Like WAY-123.398, E-4031 decreases the holding current, increases the rate constants K2 and K4 and decreases the slow component K1 more than the fast component K3 (see fit parameters in figure legend). The difference between the two records in Figure 5A, i.e. the E-4031-sensitive current, could be fitted by a single exponential with rate constant 2.07 s−1, somewhat larger than the rate constant of the slow component in the control record.
Figure 5.
 |
In Figure 5B, we collected average values for the inhibition of the slow and fast component from 16 experiments with different E-4031 concentrations. A successful fit with two exponentials was only feasible when the cells produced large currents; even then the parameters of the fast component showed large scatter. This explains the smaller number of points for the fast component and their large s.e.means. Nevertheless the difference in E-4031 sensitivity can be seen. For the slow component IC50 is 38 nM, for the fast component it is >100 nM.
Linopirdine inhibits predominantly the fast component of the deactivation currents
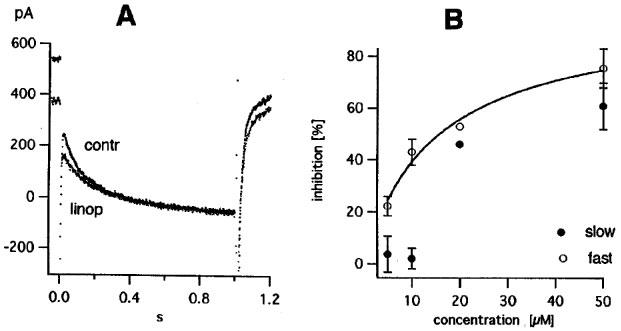
The neurotransmitter-release enhancer linopirdine which inhibits IM of rat sympathetic neurones with an IC50 as low as 3.4 μM (Lamas et al., 1997) had a weaker blocking effect in our experiments. In a total of 13 experiments, we measured current-voltage curves as in Figures 1B and 2B and determined the inhibition at −35 mV by four different linopirdine concentrations: 5, 10, 20 and 50 μM. The parameters of the dose-response curve were: Maximum inhibition fixed at 100%, IC50=23.2 μM, Hill coefficient=1.30, similar to the values recently reported for IM, ng by Noda et al. (1998) (IC50=24.7 μM, Hill coefficient=1.1).
Comparing records in control and in 10 μM linopirdine suggests that the drug in this concentration preferably inhibits the fast initial part of the deactivation currents (Figure 6A; see also the records of Noda et al., 1998). Fitting with two exponentials confirmed this impression (see legend of Figure 6). Average values for the inhibition of the slow and the fast component by various linopirdine concentrations are shown in Figure 6B. The two smallest concentrations (5 and 10 μM) selectively block the fast component. Estimates of IC50 are 14.7 μM and >20 μM for the fast and slow component, respectively.
Figure 6.
 |
The effects of E-4031 and linopirdine were additive, in keeping with the idea that the two substances exert their main effect on different components. In two cells, where 1 μM E-4031 inhibited the deactivation current at −35 mV by 72 and 76%, 1 μM E-4031+50 μM linopirdine caused 100 and 95% inhibition. In two other cells, where 1 μM E-4031 produced 92 and 98% inhibition, no additional effect of 1 μM E-4031+50 μM linopirdine could be seen.
Voltage dependence of the time constants of the fast and slow component
To compare our values with the literature (e.g. Figure 1C of Owen et al., 1990) we converted rate constants K4 and K2 into time constants 1/K4 and 1/K2 and plotted ln(1/K) against pulse potential. Figure 7A shows average values for the time constants of the fast and slow component (1/K4 and 1/K2) versus pulse potential. Both time constants decrease as the potential becomes more negative, but with different slope. In Figure 7B the time constant 1/K2 of the WAY-123.398-sensitive current in the experiment of Figure 1 is plotted against pulse potential. It is similar to the time constant of the slow component and has the same voltage dependence, supporting the idea that slow component and WAY-123.398-sensitive current are identical.
Linopirdine and bradykinin inhibit ERG current
Figure 6 shows that the slow component of the deactivation currents (which is WAY-123.398- and E-4031-sensitive, i.e. ERG current) is inhibited by linopirdine with IC50>20 μM. To confirm this observation, we recorded ERG inward currents in the customary manner (bath with 6.5–40 mM K+, pulse potential <−100 mV, c.f. Arcangeli et al., 1995; Faravelli et al., 1996; Hu & Shi, 1997) and studied their sensitivity to linopirdine. ERG currents in bath with 40 mM K+ are shown in Figure 8A. The transient inward currents at V<−80 mV resemble those described by the previous authors and, following Faravelli et al. (1996), reflect fast removal of inactivation and subsequent slow deactivation. Peak current is plotted against pulse potential in Figure 8B for another cell. Linopirdine in a concentration of 50 μM reversibly inhibited peak IERG by 27%. In Figure 8C the same pulse (V=−120 mV) was given every 30 s and 50 μM linopirdine inhibited peak IERG by 30%. On average, 50 and 20 μM linopirdine inhibited peak IERG (measured at −120 mV in [K+]o=40 mM) by 28.3±3.7% (n=8) and 16.2±2.4% (n=5), respectively. Thus, IERG is clearly less linopirdine-sensitive than the fast component of the deactivation currents described above (IC50=14.7 nM at −65 mV in [K+]o=2.4 mM, see Figure 6B). Lowering [K+]o did not increase the linopirdine sensitivity of IERG. In two experiments with [K+]o=6.5 mM, 50 and 20 μM linopirdine inhibited IERG (measured at −120 mV) by 37 and 17%, respectively.
Bradykinin, a well known inhibitor of IM, ng (Brown & Higashida, 1988b; Schäfer et al., 1991), also inhibited IERG. In the experiment of Figure 8D, 1 μM bradykinin reduced peak IERG (recorded at −120 mV in [K+]o=40 mM) reversibly by 18%. The average inhibition in bath with 40 mM K+ was 17.8±2.1% (n=12). In bath with 6.5 mM K+, the inhibition was significantly stronger (33.2±5.8%, n=6).
We also confirmed the high sensitivity of the ERG currents to E-4031. According to Faravelli et al. (1996), ERG currents of non-differentiated rat dorsal root ganglion×mouse neuroblastoma hybrid cells (clone F-11) are blocked by E-4031 with IC50<25 nM. In our experiments on differentiated NG108-15 cells, we measured the difference [peak inward current – current at end of the 160 ms test pulse] in control and in four different E-4031 concentrations (0.01, 0.05, 0.1 and 1 μM). The dose-response curve for inhibition of IERG (measured at −120 mV in [K+]o=40 or 20 mM) gave IC50=9.5 nM and Hill coefficient=0.95.
RNA transcipts of members of the EAG and KCNQ families in NG108-15 cells
The EAG K channel family consists of three subfamilies: ether-à-go-go gene (eag), eag-like gene (elk) and eag-related gene (erg) K channels (Warmke & Ganetzky, 1994). In neuroblastoma cells, both an erg-like current (see above) and an eag-like current (Meyer & Heinemann, 1998) have been described. Currents measured after heterologous expression of elk1 resemble eag-mediated currents and those after expression of elk2 resemble erg1-mediated currents (Engeland et al., 1998). As a first step in identifying the molecular correlates of EAG-mediated currents in NG108-15 cells we determined the RNA transcripts for the cloned members of the rat EAG family using RT–PCR. Figure 9A shows that transcripts for the K+ channels of all three EAG subfamilies exist in NG108-15 cells. Interestingly, after differentiation the RNA transcript for erg3 disappears (Figure 9B).
Figure 9.
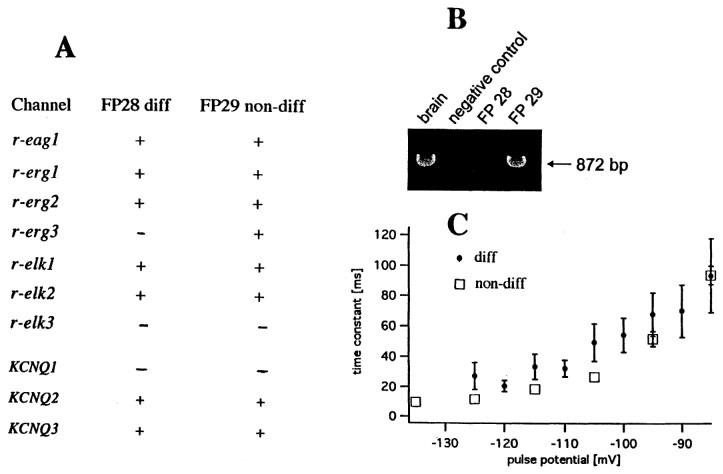
RNA transcripts for EAG and KCNQ channels and deactivation kinetics in differentiated and non-differentiated NG108-15 cells. (A) Presence or absence of RNA transcripts. (B) Gel electrophoresis of PCR reaction using primers for erg3. The following cDNAs were used as template: brain (positive control, lane 1), H2O (negative control, lane 2), NG108-15 cells differentiated for 5 days (FP 28, lane 3), undifferentiated NG108-15 cells (FP 29, lane 4). (C) Time constant of deactivation of ERG inward current versus pulse potential for six differentiated cells (diff) (diameter 38–53 μm) and three non-differentiated cells (non-diff) (diameter 38–64 μm) at 33–36°C. Currents during 160 ms pulses were fitted with one exponential function, starting 4–30 ms after beginning of pulse. Points are averages from 2–5 measurements; bars indicate s.e.mean unless smaller than symbol size. Bath contained 6.5, 20 or 40 mM KCl. Differentiation was for 4–10 days.
In addition, KCNQ2 and KCNQ3 are expressed in NG108-15 cells (Figure 9A). However, the amplification of KCNQ3 was so weak that we could not obtain enough material for sequencing; therefore its presence is not verified. The weak expression could indicate that the density of KCNQ3 channels is low. Another reason for the weak amplification could be that NG108-15 cells are hybrid cells from rat and mouse and the primers were designed according to the rat KCNQ3 cDNA. Interestingly, after sequencing of the amplified PCR product of the KCNQ2 cDNA we detected that its sequence was almost identical to that of the mouse cDNA (Nakamura et al., 1998), indicating that in NG108-15 cells the mouse gene for KCNQ2 is expressed. Whether this is also true for KCNQ3 is not known. There were also sequence deviations of the amplified PCR products of the members of the EAG family from the corresponding rat genes, suggesting that the EAG K channel proteins may also be expressed by the corresponding mouse genes.
According to Shi et al. (1997), erg3 channels activate and deactivate at significantly faster rates than erg1 or erg2 channels. To detect differences in the kinetics of IERG, we compared deactivation time constants of differentiated and non-differentiated cells (Figure 9C). Deactivation at −125 to −105 mV was indeed faster for non-differentiated cells than for differentiated cells, but the difference was much smaller than in Shi et al.'s (1997) data; heteromultimer formation would explain the discrepancy.
Discussion
We find RNA transcripts of KCNQ2/KCNQ3 and ERG1/ERG2 in our differentiated NG108-15 cells. They are probably the molecular correlates of the M-like current IM, ng and the ERG current IERG. Wang et al. (1998) have recently shown that the current measured after coexpression of KCNQ2 and KCNQ3 channel subunits in Xenopus oocytes resembles the M current of supercervical ganglion cells. We observe pure ERG currents as inward currents in high K+ bath at V<−80 mV. At more positive potentials a mixture of ERG current and M-like current is recorded, either as holding current or as deactivation current exhibiting a fast and a slow component. The relative contribution of the two components varies from cell to cell. We can attribute the fast component to IM, ng and the slow component to IERG because linopirdine blocks preferably the former and the antiarrhythmics block predominantly the latter.
Linopirdine blocks the fast component with IC50=14.7 μM, smaller than IC50=24.7 μM reported by Noda et al. (1998), but still higher than the IC50 values for IM of rat sympathetic neurons (3.4 μM, Lamas et al., 1997) and rat hippocampal neurons (8.5 μM, Aiken et al., 1995). As shown by Lamas et al. (1997) and Schnee & Brown (1998), other types of K+ channels are also inhibited by linopirdine, but require higher concentrations. In keeping with this, we find relatively low linopirdine sensitivity for the slow component (IC50>20 μM) and the ERG inward current (28% inhibition by 50 μM). The low linopirdine sensitivity of IERG is consistent with the low linopirdine sensitivity of cloned erg1 and erg3 channels reported by Wang et al. (1998). It cannot be explained by voltage dependence of the linopirdine effect, because, according to Lamas et al. (1997), ‘the action of linopirdine does not appear to be very voltage-dependent, in accordance with its uncharged nature at neutral pH.'
E-4031 blocks the slow component with IC50=38 nM. This value is only somewhat higher than the IC50 for the inhibition of ERG inward currents (<25 nM according to Faravelli et al., (1996), 9.5 nM in our experiments). The fast component is also inhibited by E-4031 although to a lesser extent (Figure 5B). Consistent with this, WAY-123.398- and E-4031-sensitive currents, when they are large, require two exponentials for a proper fit. It seems possible that our double exponential fits do not completely separate the two components. On the other hand, the fast phase of the WAY-123.398- and E-4031-sensitive currents may be genuine. Deactivation currents of HERG channels expressed in Xenopus oocytes are best described by a biexponential function (Sanguinetti et al., 1995; Sanguinetti & Xu, 1999).
With regard to the two components distinguishable by curve fitting, NG108-15 cells differ principally from rat and bullfrog sympathetic neurons. In the latter cells, the two components are equally sensitive to linopirdine (Lamas et al., 1997) and muscarine (Marrion et al., 1992). In NG108-15 cells, the apparent slow component of IM, ng is in reality IERG and therefore pharmacologically different from the fast component.
A word of caution is necessary. Separation of the fast and slow component relies on the use of linopirdine and class III antiarrhythmics (E-4031, WAY-123.398). As discussed above, linopirdine is by no means a selective blocker of M current but in higher concentrations also inhibits other types of K+ channels. Likewise, E-4031 is not completely selective for ERG channels. At relatively high concentrations, it also blocks the human inward rectifier K+ channel hIRK (Kd=4.3 μM; Kiehn et al., 1995), the ATP-regulated K+ current in rabbit ventricular myocytes (Kd=31 μM; West et al., 1996) and outward and inward rectifying K+ current in rat taste receptor cells (effective concentration 0.01–1 mM; Sun & Herness, 1996). Another point of concern are the slower and more sigmoidal activation kinetics of KCNQ2+3 channels compared with native M channels in Wang et al.'s (1998) records; perhaps other K+ channel subunits apart from KCNQ2+3 also contribute to M current.
We did not find transcripts for KCNQ1 in NG108-15 cells. This is not astonishing because KCNQ1 is mainly expressed in the heart where KCNQ1 proteins associate with minK β-subunits to form a channel complex mediating the slowly activating delayed rectifier K+ current IKs (Sanguinetti et al., 1996). NG108-15 cells are hybrid cells of rat glioma and mouse sympathetic neuroblastoma. Therefore, a particular K+ channel protein can be expressed either by the corresponding rat or mouse gene. In this study the primers were constructed according to the rat cDNAs. A negative amplification could indicate either that this channel protein is not expressed at all or that only the mouse K+ channel gene is expressed. We have, however, shown (see Results) that the primers designed to detect the rat KCNQ2 were able to amplify the KCNQ2 cDNA of the mouse, presumably due to the relatively high homology between the corresponding rat and mouse genes. We assume that the members of the EAG K+ channel family are also expressed by the corresponding mouse genes. On the other hand, ERG-like K+ currents have recently been described in rat microglia cells (Zhou et al., 1998), suggesting that K+ channel proteins mediating the ERG current may also be expressed by the corresponding rat genes.
We can compare our time constants of the fast and slow component and their voltage dependence with values in the literature. Robbins et al. (1992) found that the slow inward current relaxations of NG108-15 cells are usually better fitted with two than with one exponential. In their Figure 2, the fast and slow time constants at −60 mV are 49 and 485 ms, respectively, similar in order of magnitude to our average values 1/K4=38±4 ms and 1/K2=367±62 ms at −55 mV (see Figure 7A). Their fast time constant did not change in any consistent way with voltage. Values for the slow time constant in their Figure 2 indicate an e-fold change per 20.5 mV, similar to the voltage dependence of our 1/K2 (25.8 mV for e-fold change, see Figure 7A). Consistent with our interpretation of the slow component as ERG current, our values for the slow time constant 1/K2 are in the same order of magnitude as the deactivation time constant of IERG in cardiac cells. For the latter, values between 58 and 153 ms at −65 mV can be estimated from the literature (Shibasaki, 1987; Sanguinetti & Jurkiewicz, 1990; Clay et al., 1995), compared with our average value 1/K2=253±38 ms at −65 mV.
In non-differentiated neuroblastoma cells, ERG outward currents, although decisive in the setting of the resting potential, are negligible in size (Faravelli et al., 1996). By contrast, we find sizeable steady-state ERG outward currents in differentiated NG108-15 cells. The outward holding current at −30 or −20 mV is not simply IM, ng+Ileak but contains a small (Figure 1) or large (Figures 2 and 4) contribution of IERG.
Acknowledgments
The authors gratefully acknowledge financial support by the Deutsche Forschungsgemeinschaft to H.Meves (Me 131/22) and J.R. Schwarz (SFB 444, A3). They also thank Dr M. Nirenberg (Bethesda, MD, U.S.A.) and the European Collection of Cell Cultures (Salisbury, Wiltshire, U.K.) for providing the NG108-15 cells. They are grateful to Drs J. Eilers, D. Hof and T.D. Plant for help with the computer and to D. Schiemann for help with the PCR.
Abbreviations
- E-4031
1-[2-(6-methyl-2-pyrydinil)ethyl]-4-(4-methylsulphonylaminobenzoyl) piperidine
- EAG
ether-à-go-go gene
- ELK
EAG-like
- ERG
EAG-related gene
- IERG
ERG current
- IM
M-current
- IM ng
M-like current of NG108-15 cells
- KCNQ
KQT-like K+ channel
- TEA
tetraethylammonium
- WAY-123.398
[(4-methylsulphonyl)amido]benzenesulphonamide
References
- AIKEN S.P., LAMPE B.J., MURPHY P.A., BROWN B.S. Reduction of spike frequency adaptation and blockade of M-current in rat CA1 pyramidal neurones by linopirdine (DuP 996), a neurotransmitter release enhancer. Br. J. Pharmacol. 1995;115:1163–1168. doi: 10.1111/j.1476-5381.1995.tb15019.x. [DOI] [PMC free article] [PubMed] [Google Scholar]
- ARCANGELI A., BIANCHI L., BECCHETTI A., FARAVELLI L., CORONELLO M., MINI E., OLIVOTTO M., WANKE E. A novel inward-rectifying K+ current with a cell-cycle dependence governs the resting potential of mammalian neuroblastoma cells. J. Physiol. 1995;489:455–471. doi: 10.1113/jphysiol.1995.sp021065. [DOI] [PMC free article] [PubMed] [Google Scholar]
- BAUER C.K. The erg inwardly rectifying K+ current and its modulation by thyrotrophin-releasing hormone in giant clonal rat anterior pituitary cells. J. Physiol. 1998;510:63–70. doi: 10.1111/j.1469-7793.1998.063bz.x. [DOI] [PMC free article] [PubMed] [Google Scholar]
- BROWN D.A., HIGASHIDA H. Voltage- and calcium-activated potassium currents in mouse neuroblastoma x rat glioma hybrid cells. J. Physiol. 1988a;397:149–165. doi: 10.1113/jphysiol.1988.sp016993. [DOI] [PMC free article] [PubMed] [Google Scholar]
- BROWN D.A., HIGASHIDA H. Membrane current responses of NG 108-15 mouse neuroblastoma x rat glioma hybrid cells to bradykinin. J. Physiol. 1988b;397:167–184. doi: 10.1113/jphysiol.1988.sp016994. [DOI] [PMC free article] [PubMed] [Google Scholar]
- CHOMCZYNSKI P., SACCHI N. Single-step method of RNA isolation by acid guanidinium thiocyanate-phenol-chloroform extraction. Analytical Biochemistry. 1987;162:156–159. doi: 10.1006/abio.1987.9999. [DOI] [PubMed] [Google Scholar]
- CLAY J.R., OGBAGHEBRIEL A., PAQUETTE T., SASYNIUK B.I., SHRIER A. A quantitative description of the E-4031-sensitive repolarization current in rabbit ventricular myocytes. Biophys. J. 1995;69:1830–1837. doi: 10.1016/S0006-3495(95)80053-6. [DOI] [PMC free article] [PubMed] [Google Scholar]
- ENGELAND B., NEU A., LUDWIG J., ROEPER J., PONGS O. Cloning and functional expression of rat ether-à-go-go-like channels. J. Physiol. 1998;513:647–654. doi: 10.1111/j.1469-7793.1998.647ba.x. [DOI] [PMC free article] [PubMed] [Google Scholar]
- FARAVELLI L., ARCANGELI A., OLIVOTTO M., WANKE E. A HERG-like K+ channel in rat F-11 DRG cell line: pharmacological identification and biophysical characterization. J. Physiol. 1996;496:13–23. doi: 10.1113/jphysiol.1996.sp021661. [DOI] [PMC free article] [PubMed] [Google Scholar]
- HU Q., SHI Y.L. Characterization of an inward-rectifying potassium current in NG108-15 neuroblastoma x glioma cells. Pflügers Arch. 1997;433:617–625. doi: 10.1007/s004240050322. [DOI] [PubMed] [Google Scholar]
- KIEHN J., WIBLE B., FICKER E., TAGLIATELA M., BROWN A.M. Cloned human inward rectifier potassium channel as a target for class III cardiac methanesulfonanilides. Circ. Res. 1995;77:1151–1155. doi: 10.1161/01.res.77.6.1151. [DOI] [PubMed] [Google Scholar]
- LAMAS J.A., SELYANKO A.A., BROWN D.A. Effects of a cognition-enhancer, linopiridine (DuP 996), on M-type potassium currents (IK(M)) and some other voltage- and ligand-gated membrane currents in rat sympathetic neurons. Eur. J. Neurosci. 1997;9:605–616. doi: 10.1111/j.1460-9568.1997.tb01637.x. [DOI] [PubMed] [Google Scholar]
- MARRION N.V., ADAMS P.R., GRUNER W. Multiple kinetic states underlying macroscopic M-currents in bullfrog sympathetic neurons. Proc. R. Soc. 1992;248:207–214. doi: 10.1098/rspb.1992.0063. [DOI] [PubMed] [Google Scholar]
- MEVES H., SCHWARZ J.R. The “M-like current” IK(M, ng) of NG108-15 mouse neuroblastoma x rat glioma cells is blocked by E-4031 and also less sensitive to linopirdine. J. Physiol. 1999;515P:41P. [Google Scholar]
- MEYER R., HEINEMANN S.H. Characterization of an eag-like potassium channel in human neuroblastoma cells. J. Physiol. 1998;508:49–56. doi: 10.1111/j.1469-7793.1998.049br.x. [DOI] [PMC free article] [PubMed] [Google Scholar]
- NAKAMURA M., WATANABE H., KUBO Y., YOKOYAMA M., MATSUMOTO T., SASAI H., NISHI Y. KQT2, a new putative potassium channel family produced by alternative splicing. Isolation, genomic structure, and alternative splicing of the putative potassium channels. Recep. Channels. 1998;5:255–271. [PubMed] [Google Scholar]
- NODA M., OBANA M., AKAIKE N. Inhibition of M-type K+ current by linopirdine, a neurotransmitter-release enhancer, in NG108-15 neuronal cells and rat cerebral neurons in culture. Brain Res. 1998;794:274–280. doi: 10.1016/s0006-8993(98)00235-2. [DOI] [PubMed] [Google Scholar]
- OWEN D.G., MARSH S.J., BROWN D.A. M-current noise and putative M-channels in cultured rat sympathetic ganglion cells. J. Physiol. 1990;431:269–290. doi: 10.1113/jphysiol.1990.sp018330. [DOI] [PMC free article] [PubMed] [Google Scholar]
- ROBBINS J., TROUSLARD J., MARSH S.J., BROWN D.A. Kinetic and pharmacological properties of the M-current in rodent neuroblastoma x glioma hybrid cells. J. Physiol. 1992;451:159–185. doi: 10.1113/jphysiol.1992.sp019159. [DOI] [PMC free article] [PubMed] [Google Scholar]
- SANGUINETTI M.C., JURKIEWICZ N.K. Two components of cardiac delayed rectifier K+ current. Differential sensitivity to block by class III antiarrhythmic agents. J. Gen. Physiol. 1990;96:195–215. doi: 10.1085/jgp.96.1.195. [DOI] [PMC free article] [PubMed] [Google Scholar]
- SANGUINETTI M.C., XU Q.P. Mutations of the S4-S5 linker alter activation properties of HERG potassium channels expressed in Xenopus oocytes. J. Physiol. 1999;514:667–675. doi: 10.1111/j.1469-7793.1999.667ad.x. [DOI] [PMC free article] [PubMed] [Google Scholar]
- SANGUINETTI M.C., JIANG C., CURRAN M.E., KEATING M.T. A mechanistic link between an inherited and an acquired cardiac arrhythmia: HERG encodes the IKr potassium channel. Cell. 1995;81:299–307. doi: 10.1016/0092-8674(95)90340-2. [DOI] [PubMed] [Google Scholar]
- SANGUINETTI M.C., CURRAN M.E., ZOU A., SHEN J., SPECTOR P.S., ATKINSON D.L., KEATING M.T. Coassembly of KVLQT1 and mink (IsK) proteins to form cardiac IKs potassium channel. Nature. 1996;384:80–83. doi: 10.1038/384080a0. [DOI] [PubMed] [Google Scholar]
- SCHÄFER S., BÉHÉ P., MEVES H. Inhibition of the M current in NG108-15 neuroblastoma x glioma hybrid cells. Pflügers Arch. 1991;418:581–591. doi: 10.1007/BF00370575. [DOI] [PubMed] [Google Scholar]
- SCHMITT H., MEVES H. Protein kinase C as mediator of arachidonic acid-induced decrease of neuronal M current. Pflügers Arch. 1993;425:134–139. doi: 10.1007/BF00374513. [DOI] [PubMed] [Google Scholar]
- SCHNEE M.E., BROWN B.S. Selectivity of linopiridine (DuP 996), a neurotransmitter release enhancer, in blocking voltage-dependent and calcium-activated potassium currents in hippocampal neurons. J. Pharmacol. Exp. Therap. 1998;286:709–717. [PubMed] [Google Scholar]
- SHI W., WYMORE R.S., WANG H.-S., PAN Z., COHEN I.S., MCKINNON D., DIXON J.E. Identification of two nervous system-specific members of the erg potassium channel gene family. J. Neurosci. 1997;17:9423–9432. doi: 10.1523/JNEUROSCI.17-24-09423.1997. [DOI] [PMC free article] [PubMed] [Google Scholar]
- SHIBASAKI T. Conductance and kinetics of delayed rectifier potassium channels in nodal cells of the rabbit heart. J. Physiol. 1987;387:227–250. doi: 10.1113/jphysiol.1987.sp016571. [DOI] [PMC free article] [PubMed] [Google Scholar]
- SUN X.-D., HERNESS M.S. Inhibition of potassium currents by the antiarrhythmic drug E4031 in rat taste receptor cells. Neurosc. Lett. 1996;204:149–152. doi: 10.1016/0304-3940(96)12343-0. [DOI] [PubMed] [Google Scholar]
- WANG H.-S., PAN Z., SHI W., BROWN B.S., WYMORE R.S., COHEN I.S., DIXON J.E., MCKINNON D. KCNQ2 and KCQN3 potassium channel subunits: Molecular correlates of the M-channel. Science. 1998;282:1890–1893. doi: 10.1126/science.282.5395.1890. [DOI] [PubMed] [Google Scholar]
- WARMKE J.W., GANETZKY B. A family of potassium channel genes related to eag in Drosophila and mammals. Proc. Natl. Acad. Sci. U.S.A. 1994;91:3438–3442. doi: 10.1073/pnas.91.8.3438. [DOI] [PMC free article] [PubMed] [Google Scholar]
- WEST P.D., BURSILL J.A., WYSE K.R., MARTIN D.K., CAMPBELL T.J. Effect of the class III antiarrhythmic agent E-4031 on the ATP-sensitive potassium channel in rabbit ventricular myocytes. Pharmacol. Toxicol. 1996;78:89–93. doi: 10.1111/j.1600-0773.1996.tb00186.x. [DOI] [PubMed] [Google Scholar]
- ZHOU W., CAYABYAB F.S., PENNEFATHER P.S., SCHLICHTER L.C., DECOURSEY T.E. HERG-like K+ channels in microglia. J. Gen. Physiol. 1998;111:781–794. doi: 10.1085/jgp.111.6.781. [DOI] [PMC free article] [PubMed] [Google Scholar]


