Abstract
Background
DNA microarrays are used to produce large sets of expression measurements from which specific biological information is sought. Their analysis requires efficient and reliable algorithms for dimensional reduction, classification and annotation.
Results
We study networks of co-expressed genes obtained from DNA microarray experiments. The mathematical concept of curvature on graphs is used to group genes or samples into clusters to which relevant gene or sample annotations are automatically assigned. Application to publicly available yeast and human lymphoma data demonstrates the reliability of the method in spite of its simplicity, especially with respect to the small number of parameters involved.
Conclusions
We provide a method for automatically determining relevant gene clusters among the many genes monitored with microarrays. The automatic annotations and the graphical interface improve the readability of the data. A C++ implementation, called Trixy, is available from http://tagc.univ-mrs.fr/bioinformatics/trixy.html.
Background
Measurements of gene expression levels by microarray experiments create a high-throughput of data, the interpretation of which increasingly requires novel and efficient dimensionality reduction strategies. Many clustering methods have been proposed (see for example [1-5] and the more comprehensive reviews [6,7]) and are widely used. These algorithms group genes and/or samples into clusters of similar expression profiles, in order to suggest possible functional relationships between them. The importance of graphical representations and of automatic cluster annotations stands out from many recent publications [1,8-12] devoted to gene functions prediction, prognosis or diagnosis of cancer subtypes for instance.
Similar problems arise in the analysis of large interaction networks [13-18] where one tries to extract sub-networks satisfying some significance criteria. The problem of finding web pages dedicated to the same topic is an example that will appeal to the experience of every reader (in this case the network's nodes are the URLs, with HTML links).
We propose a new method which combines one of these network analysis techniques with the classical correlation-based clustering for studying DNA microarray data. It provides a novel graphical representation, a cluster forming rationale and cluster annotations through correlation with gene or sample keywords. The algorithm relies on only two user-controlled parameters, therefore sensitivity of the results to a particular choice of parameters can be checked effectively.
The algorithm is based on the notion of curvature introduced in [13] (this is the same as the clustering coefficient of [19]), which we apply to the network of co-expressed genes where nodes are genes (or samples) and links symbolize co-expression. We define clusters as connected regions of the graph with high curvature, which is the local density of triangular relations. The gene or sample clusters are the densest regions of the corresponding correlation graph, which we will show has biological relevance as intuitively expected. We must emphasize that curvature is typically extremely low in random graphs that have small average degree compared to the number of nodes (which is usually the case in biological networks [14,20]). Clusters of high curvature are thus highly non-random structures.
We have implemented these concepts in the freely available program Trixy. It is a graphical interface for visualising the graph, the clusters and the automatic annotations providing a straightforward tool for exploring microarray data. The C++ source code and sample Perl parsers are freely available from http://tagc.univ-mrs.fr/bioinformatics/trixy.html. We also provide the data files adapted from the original yeast [1] and lymphoma [21] sets as examples. We have compiled and used the program on both Linux and Windows platforms. Compiling on other platforms has not been attempted but is theoretically possible.
On the performance side, clustering and display with Trixy requires CPU time and memory size comparable to hierarchical clustering as performed in [1].
Algorithm
Curvature on Graphs
The discussion below focuses on the problem of clustering genes. The symmetric question of clustering samples can be treated similarly.
A DNA microarray data set consists of expression levels of N genes in M different experimental conditions (M different RNA samples). This is organised in an N × M matrix Xi,j, i = 1,...,N; j = 1,...,M each row of which contains the expression profile of a given gene across all samples. We are interested in patterns of co-expression, namely groups of genes with parallel or anti-parallel profiles. We measure co-expression of genes gk and gℓ by the (Pearson) correlation cor(k, ℓ) between their profiles:
![]()
where μi and σi denote the mean and the standard deviation of row i. This creates a correlation matrix which is an N × N symmetric matrix (because cor(k, ℓ) = cor(ℓ, k)).
We construct a correlation graph as follows. We first make a node n for each gene. We then choose a threshold Tcor ∈ [0,1] and draw a link between genes gk and gℓ if cor(k, ℓ) ≥ Tcor. This can be understood as follows: a graph with N nodes is defined by its adjacency matrix A (the N × N matrix such that Ai,j = 1 if i and j are joined, 0 otherwise [22]). We obtain A from the correlation matrix by binarisation: we replace cor(k, ℓ) by 0 if it lies between -Tcor and Tcor and by 1 otherwise.
We next introduce the concept of curvature (or clustering coefficient) on a graph [13,19]. Each node n has a curvature which is a function of the number v of neighbours (nodes to which it is linked) and the number t of triangles (pairs of adjacent neighbours, see Figure 1), given by the formula
Figure 1.
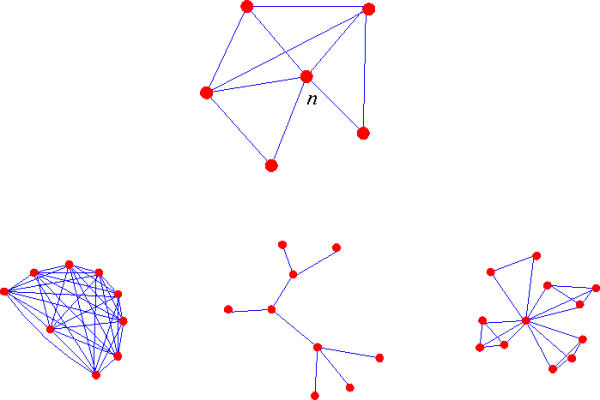
Top: the node n has v = 5 neighbours and t = 5 triangles, thus curvature curv(n) = 1/2, see Eq. (2). Bottom left: a complete graph, each node has curvature 1. Center: a tree, each node has curvature 0 or undefined. Right: the central node is a hub with curvature ≈ 1/v
![]()
Remark that v(v - 1)/2 is the maximum number of triangles that can be drawn on v neighbours hence curv(n) lies between 0 and 1 if v > 1 and is undefined otherwise (see Figure 1 for examples of graphs and curvature).
There is a natural notion of distance between nodes in a graph [22]: it is the number of links in the shortest path connecting them (distance is infinite if there is no such path). Let dn(i, j) be the distance between the ith and jth neighbours of n: either dn(i, j) = 1 (these two neighbours are linked) or dn(i, j) = 2 (they are not, the shortest path goes through n). A simple computation shows that

where <dn> is the average distance between pairs of neighbours of n. Hence one can picture high curvature as high local density (low average distances).
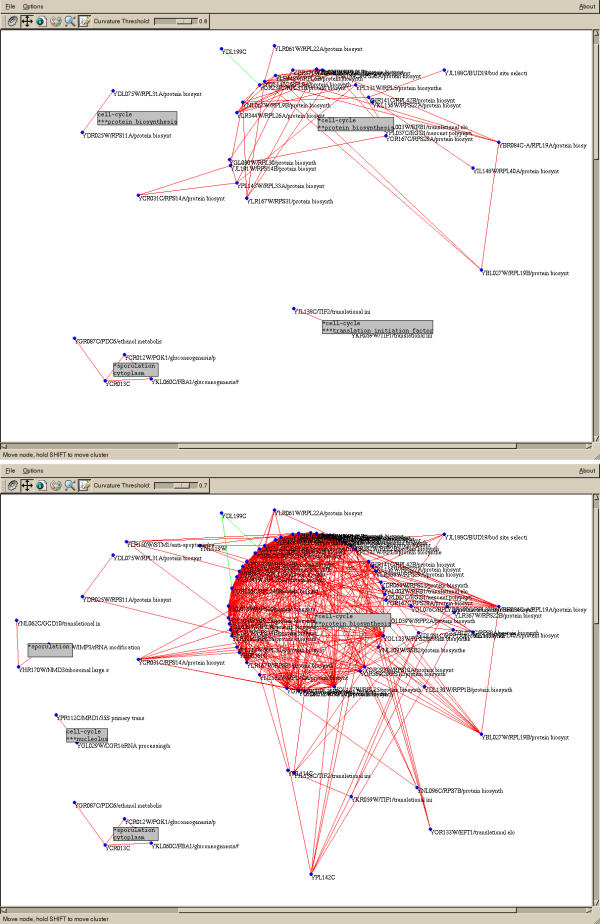
Given a curvature threshold Tcurv ∈ [0; 1] we select a subgraph by deleting all nodes with a curvature below Tcurv as well as their links. This splits the graph into several connected components. Each such connected component will be interpreted as a coherent cluster of co-expressed genes (see Figure 2). Varying Tcurv adds or removes nodes and links and thus modifies the clusters displayed (possibly merging or splitting some of the clusters). The reader can think of the graph as a sea bed, curvature being height. The curvature threshold Tcurv is the sea level and the clusters are the emerging islands. Changing the correlation threshold Tcor changes the landscape while changing the curvature threshold Tcurv only moves the sea level up and down.
Figure 2.
Screenshots of the main window of Trixy displaying a part of the yeast gene expression graph with Tcor = 0.85. Top: Tcurv = 0.80, bottom: Tcurv = 0.70. Grey boxes display automatic annotations with sample keyword on the first line and gene keyword on the second
Consider the Internet analogy of a University web site: the index page has many links to all department's web pages. It is unlikely that, for instance, the biology department's page provides a link to the literature department's page. Therefore, the index page will surely have a small curvature (few of its neighbours have links between them). However, the home page of the biology department has external links to biology departments in other universities with which it has common interests. These other pages will certainly also have external links to many of the same pages, again because they share similar interests. Therefore, a cluster of high curvature will emerge, comprising all the biology departments web pages. This reasoning applies to virtually any communication network and we demonstrate below that it can also be usefully applied to correlation graphs of gene expression profiles.
The program Trixy implements the algorithm described above in a user-friendly graphical interface. It is written in C++ using the free Qt graphical library. It uses embedded Perl for parsing data inputs, which has the advantage that loading data saved under a new format only requires rewriting a Perl script which can be picked at run time. We have mostly used Trixy for clustering genes, but sample clustering can also be performed simply by using a modified parser which rotates the matrix. Similarly, an appropriate Perl script could simply fetch gene annotations from web servers such as http://www.geneontology.org/ rather than read them from a local file.
Normalisation and Parameters
A few simple data processing tools are provided in Trixy: log transform, samples centering (by subtracting the mean or the median) and samples reduction (division by the standard deviation). After these operations have been performed, the correlation matrix is computed and the curvature of each node is deduced from it. At this point, the user can view (using the "Eisengram" standard colour representation of the matrix, such as Figure 4) or save the resulting data set as a flat file. The graph is then built and displayed (as in Figure 2). Although the correlation threshold Tcor is set before loading the data, the curvature threshold Tcurv can be varied as the graph is displayed. Starting from an initially high value of Tcurv and lowering it progressively unveils new nodes and new clusters. It increases the size of existing clusters, sometimes merging several of them (Figure 2). This gives a feeling for the robustness of the clustering and for the closeness of clusters.
Figure 4.
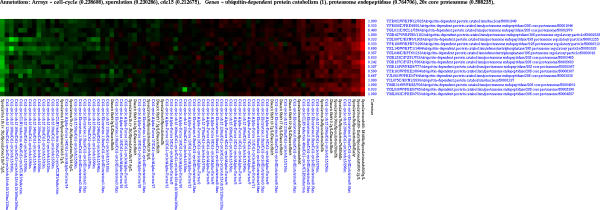
The ubiquitin dependent protein catabolism cluster of yeast gene expression at Tcor = 0.80 and Tcurv = 0.18
Our advice for the choice of Tcor is to set it to a value which retains only links significantly stronger than expected by pure chance (this depends on the particular data set and can be determined by bootstrapping, see e.g. [5]). The parameter Tcurv is different. We have observed that the best value is often cluster-dependent. We have a more dynamic view on this parameter: the way clusters change as Tcurv moves is informative. A good way of picking the best threshold is by maximising the annotation scores (see below).
Automatic Annotation
Trixy allows the user to provide annotation files for sample and genes. They consist of a list of keywords associated with each of the gene and/or sample names.
On the one hand, a cluster of genes can be associated with an over-represented gene keyword by giving a score to each annotation equal to its frequency in the cluster.
On the other hand, for sample annotations, a correlation score is computed. Suppose a cluster consists of genes g1,..., gK. For each sample keyword W, we create a discriminating vector g0 which takes the value 1 on each sample associated with W and -1 otherwise. The annotation score is the average absolute correlation with keyword  .
.
Both scores yield numbers between 0 and 1, the closer to 1 the more significant the annotation. We discard annotations that were not present for at least 10% of the samples and 2 of the genes in each cluster.
Visualisation
The graph is displayed with a different colour code for links representing positive or negative correlations (in Figure 2, negative correlations are shown in green, see also Figure 7).
Figure 7.
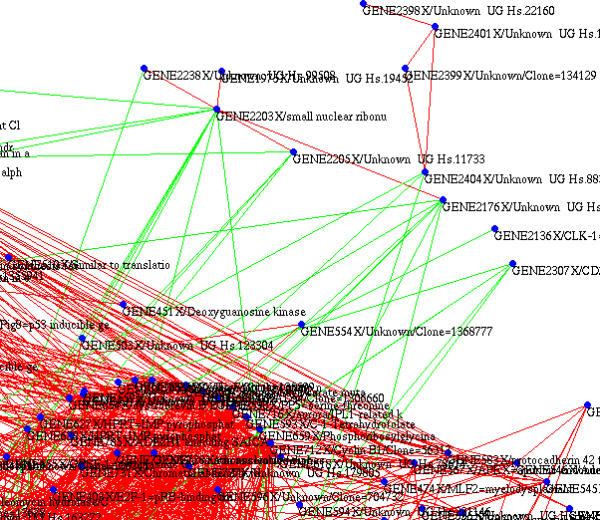
A small part of the lymphoma graph showing putative repressor genes (green links are negative correlations). Threshold values are Tcor = 0.70 and Tcurv = 0.45
Each cluster can be selected and the corresponding data subset viewed (as a colour-coded table such as Figure 4). If annotations were provided, those with the highest scores are listed and the cluster can be saved as a data file, gene list or colour picture.
Results
Yeast Gene Expression Data
We have applied our algorithm to the data set of gene expression of the budding yeast Saccharomyces cerevisiae available from the website http://rana.lbl.gov/EisenData.htm and described in [1]. We have used Gene Ontology gene annotations from the Saccharomyces Genome Database (SGD) [23]. The sample keywords were extracted from the original expression data file and in this case do not yield interpretable annotations (see the lymphoma section below for a more convincing example of the usefulness of sample annotations).
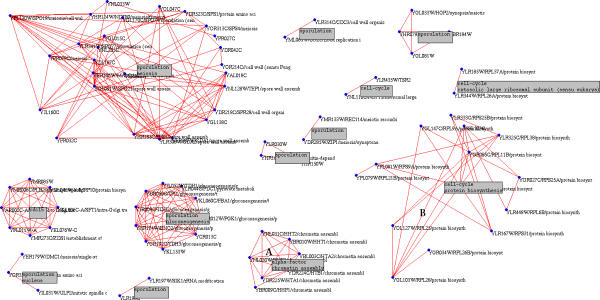
Even with threshold values as high as Tcor = 0.90 and Tcurv = 0.70, we get clearly delineated clusters (see Figure 3). Note that only 263 out of a total of 6221 genes have positive curvature at this value of the correlation threshold, yielding 2075 links.
Figure 3.
The full graph based on Saccharomyces cerevisiae 6221 gene expression profiles across 80 experiments with thresholds Tcurv = 0.70 at Tcor = 0.90
Most of the clusters obtained appear biologically coherent. For example the chromatin assembly cluster contains all the 9 histone genes for Tcor = 0.80 and Tcurv = 0.64 (Figure 3, cluster A: it only shows 7 of the genes at this level of correlation). It is disconnected from the rest of the graph and extremely robust with respect to changes in the parameters. The ubiquitin dependent protein catabolism (Figure 4) cluster appears at a much lower curvature but is extremely coherent with 17 out of 17 proteolysis genes. For the sake of comparison, a proteasome cluster of similar size obtained using hierarchical clustering contains 3 genes unrelated to proteolysis.
Much larger clusters are also visible, such as the protein biosynthesis cluster (Figure 3, cluster B and Figure 2). However, it is very sensitive to variations of the thresholds and can include over 900 genes.
B-cell Lymphoma
We have also used the data set of the lymphoma study available from the website http://llmpp.nih.gov/lymphoma/ and published in [21]. Sample and gene annotations were extracted from the names included in the data file. We were in particular interested in the classification of the tumor subtypes called chronic lymphocytic leukaemia (CLL) and diffuse large B-cell lymphoma (DLCL).
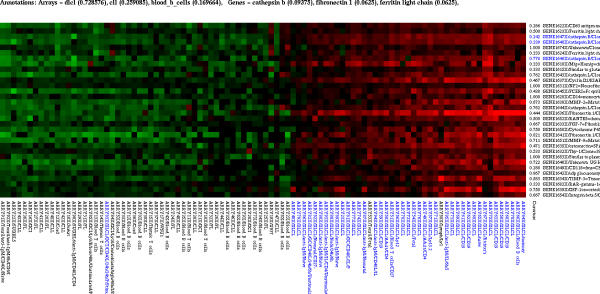
Using a threshold Tcor = 0.80 we obtain nicely discriminating clusters, for example Figure 5 which separates the CLL tumors and Figure 6 which sorts the DLCL tumors. The latter cluster eventually merges with a cluster of Interferon-induced genes (data not shown) as the curvature threshold decreases: they are like two hills on the same island.
Figure 5.
A cluster of genes under-expressed in the CLL tumors obtained from the lymphoma data with Tcor = 0.80 and Tcurv = 0.40
Figure 6.
A cluster of genes over-expressed in the DLCL tumors obtained from the lymphoma data with Tcor = 0.80 and Tcurv = 0.24
We also have a good example of a property that is often observed with our graphical representation: negative correlations are much rarer than positive ones and are carried by just a few nodes, which are almost certainly represser genes. Figure 7 shows a small part of the graph where 7 nodes are mostly anti-correlated with the rest of a cluster of 307 genes. However, let us emphasize that the graphs shown here do not represent gene interaction networks per se, they are merely a means of clustering genes co-expressed within the selected samples.
This data set provides a good test bed for sample clustering. In this case, the graph's nodes are the samples and links denote a correlation between samples (columns of the expression level matrix X). As shown in Figure 8, the result is clear cut: all clusters are associated with a single sample subtype, be it B-cells, T-cells, FL (follicular lymphoma) or CLL.
Figure 8.
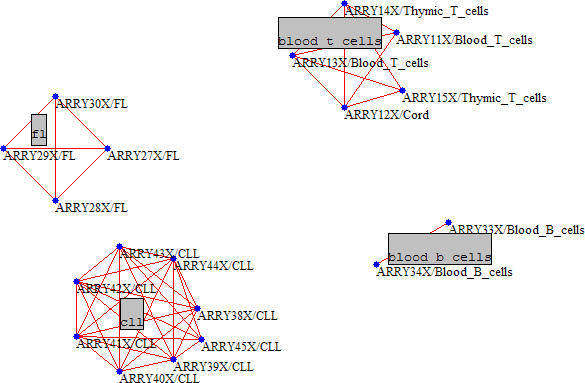
Clustering of the lymphoma samples with Tcor = 0.60 and Tcurv = 0.30. Each cluster is associated with a cell type indicated in the grey boxes
Statistical Validation
As stated earlier, mathematical theory shows that random graphs have a very low number of triangles [14,20]. We can check this statement numerically by using random permutations of a real data set. We have randomly reordered the yeast data, gene by gene (a random permutation in each line), computed the curvature of each node, and repeated this operation 1000 times. At Tcor = 0.6 we deduced a probability of positive curvature of 5 × 10⁻⁵, the probability of having a degree larger than 1 was 2 × 10⁻⁴ (maximum degree observed: 6). At Tcor = 0.7 the probability of positive curvature was 10-6. The comparison with the curvature distribution of the real biological data is displayed in Figure 9.
Figure 9.
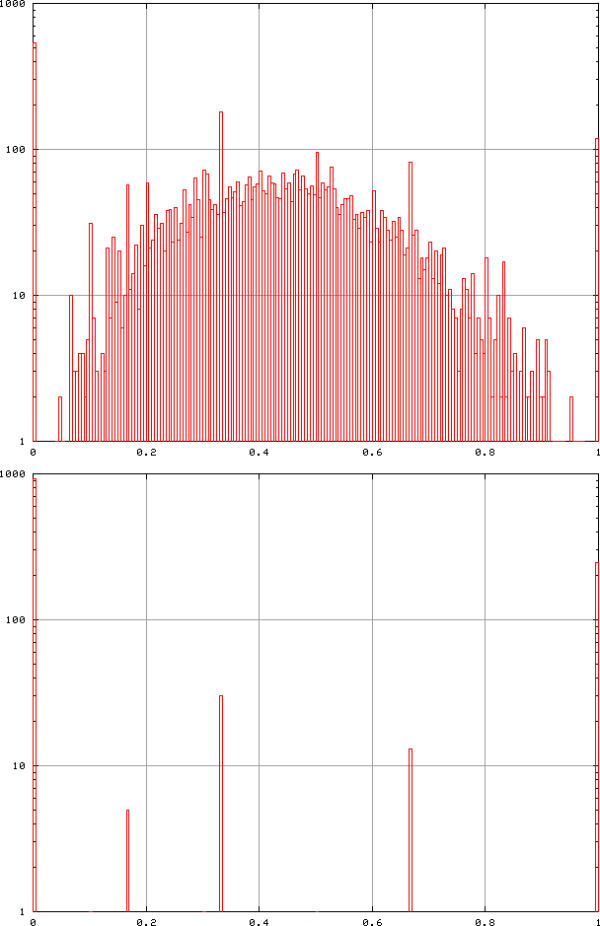
Distribution of curvatures in the yeast (top) and randomised yeast (bottom) data with Tcor = 0.6. Top: the mean curvature is 0.387 and 85% of nodes have positive curvature, bottom: cumulative distribution of curvatures after 1000 permutations in each of the 6221 genes. The proportion of nodes with non-zero curvature is 5 × 10⁻⁵
Statistical validation of an annotation by a particular keyword can be performed with similar methods. For example in the case of the clusters shown in Figure 5,6, we have performed 10,000 random permutations of the sample keywords. We have obtained a maximum annotation score of 0.315 for the CLL cluster and the mean score plus two standard deviations was equal to 0.177, whilst the annotation score of the original cluster was 0.510. Similarly for the DLCL cluster, the maximum score after 10, 000 permutations was 0.367, the mean score plus two standard deviations 0.172, whilst the original score was 0.729.
Permutations of gene keywords can be computed explicitely. For example 66 of the 6221 yeast genes have the GO annotation ubiquitin dependent protein catabolism. The probability of having 17 of them in the same cluster of size 17 (see Figure 4) is of the order of 10-35.
Discussion and Conclusions
We have described an algorithm for visualising and analysing large microarray data sets. It combines traditional correlation distances and new graph-theoretical ideas. We have implemented this algorithm in a convenient graphical interface and evaluated its performance on well established data sets.
Curvature thresholds split the graph into clusters which appear to be biologically meaningful. An automatic annotation procedure associates keywords with clusters, which are consistent with previous publications [1,21].
Our approach uses a local analysis of the correlation graph as opposed to global properties such as small-world [19] or scale-free properties [24]. Hubs [25] are not seen as relevant in our approach since they usually make little contribution to the information carried by the graph (like index pages in the worldwide web). The closest approach to ours is that of [14,15] in the sense that triangles are network motifs, but again, we only draw conclusions from their local density not their frequency at the level of the whole graph. This also emphasizes the difference between our method and the more commonly used hierarchical clustering [1]: because we focus on triangular relations (rare motif in graphs) rather than simple links (very common motif), we obtain a drastic dimensional reduction (see Figure 3) whereas hierarchical clustering retains all the data and does not in itself delineate clusters. Furthermore the stronger constraint offered by triangular links as opposed to single link methods ensure more coherent clusters.
Further Developments
Future development should include finer statistical analysis tools to validate the automatic annotations. In particular a bootstrap validation of a discriminant score [9] would be more accurate that the correlation score explained in the methods, which detects consistency with the annotation rather than actual discrimination. Also, more sophisticated methods for determining optimal annotations exist in the literature and could be applied to our clusters (see e.g. [11]).
A method for determining a natural correlation threshold Tcor would be most welcome (such methods have been discussed in [26,27]). It would leave only one free parameter, the curvature threshold Tcurv Again a bootstrap calculation could provide an estimate of a significant deviation from average random correlation. It was also suggested to use a hierarchical construction of the graph: first use the strongest links (largest correlations) to build small clusters, then link clusters with weaker links and continue until all nodes belong to the same cluster. Varying Tcurv would subsequently split this unique cluster into significant parts. Memory and speed limitations may hamper these developments.
Authors' Contributions
JR conceived of the study and carried out all programming as a postdoc in the group of PH. PH supervised the study and provided valuable input for the analyses and biological interpretations. Both authors read and approved the final manuscript.
Acknowledgments
Acknowledgments
We thank D. Gautheret for critically reading a first version of the manuscript. J.R. is grateful to J.-P. Eckmann and E. Moses for useful comments on earlier versions of the program and for detailed explanations of their results. Part of this research was supported by the Temblor project EU grant QLRT-2001-00015.
Contributor Information
Jacques Rougemont, Email: rougemont@tagc.univ-mrs.fr.
Pascal Hingamp, Email: hingamp@tagc.univ-mrs.fr.
References
- Eisen MB, Spellman PT, Brown PO, Botstein D. Cluster analysis and display of genome-wide expression patterns. Proc NatL Acad Sci USA. 1998;95:14863–14828. doi: 10.1073/pnas.95.25.14863. [DOI] [PMC free article] [PubMed] [Google Scholar]
- Tamayo P, Slonim D, Mesirov J, Zhu Q, Kitareewan S, Dmitrovsky E, Lander ES, Golub TR. Interpreting patterns of gene expression with self-organizing maps: Methods and application to hematopoietic differentiation. Proc Natl Acad Sci USA. 1999;96:2907–2912. doi: 10.1073/pnas.96.6.2907. [DOI] [PMC free article] [PubMed] [Google Scholar]
- Tavazoie S, Hughes JD, Campbell MJ, Cho RJ, Church GM. Systematic determination of genetic network architecture. Nature Genetics. 1999;22:281–285. doi: 10.1038/10343. [DOI] [PubMed] [Google Scholar]
- Gasch AP, Eisen MB. Exploring the conditional coregulation of yeast gene expression through fuzzy k-means clustering. Genome Biology. 2002;3:Research0059. doi: 10.1186/gb-2002-3-11-research0059. [DOI] [PMC free article] [PubMed] [Google Scholar]
- Herrero J, Valencia A, Dopazo J. A hierarchical unsupervised growing neural network for clustering gene expression patterns. Bioinformatics. 2001;17:126–136. doi: 10.1093/bioinformatics/17.2.126. [DOI] [PubMed] [Google Scholar]
- Shamir R, Sharan R. Algorithmic approaches to clustering gene expression data. In: Jiang T, Xu Y, Smith T, editor. In Current Topics In Computational Molecular Biology. 2002. pp. 269–300. [Google Scholar]
- Tamames J, Clark D, Herrero J, Dopazo J, Blaschke C, Fernandez JM, Oliveros JC, Valencia A. Bioinformatics methods for the analysis of expression arrays: data clustering and information extraction. J Biotechnol. 2002;98:269–283. doi: 10.1016/S0168-1656(02)00137-2. [DOI] [PubMed] [Google Scholar]
- Furey TS, Cristianini N, Duffy N, Bednarski DW, Schummer M, Haussler D. Support vector machine classification and validation of cancer tissue samples using microarray data. Bioinformatics. 2000;16:906–914. doi: 10.1093/bioinformatics/16.10.906. [DOI] [PubMed] [Google Scholar]
- Golub TR, Slonim DK, Tamayo P, Huard C, Gaasenbeek M, Mesirov JP, Coller H, Loh ML, Downing JR, Caligiuri MA, et al. Molecular classification of cancer: Class discovery and class prediction by gene expression monitoring. Science. 1999;286:531–537. doi: 10.1126/science.286.5439.531. [DOI] [PubMed] [Google Scholar]
- Wu LF, Hughes TR, Davierwala AP, Robinson MD, Stoughton R, Altschuler SJ. Large-scale prediction of Saccharomyces cerevisiae gene function using overlapping transcriptional clusters. Nature Genetics. 2002;31:255–265. doi: 10.1038/ng906. [DOI] [PubMed] [Google Scholar]
- Pe'er D, Regev A, Tanay A. Minreg: inferring an active regulator set. Bioinformatics. 2002;18:s258–s267. doi: 10.1093/bioinformatics/18.suppl_1.s258. [DOI] [PubMed] [Google Scholar]
- Zhou X, Kao MC, Wong WH. Transitive functional annotation by shortest-path analysis of gene expression data. Proc Natl Acad Sci USA. 2002;99:12783–12788. doi: 10.1073/pnas.192159399. [DOI] [PMC free article] [PubMed] [Google Scholar]
- Eckmann JP, Moses E. Curvature of co-links uncovers hidden thematic layers in the world wide web. Proc Natl Acad Sci USA. 2002;99:5825–5829. doi: 10.1073/pnas.032093399. [DOI] [PMC free article] [PubMed] [Google Scholar]
- Shen-Orr SS, Milo R, Mangan S, Alon U. Network motifs in the transcriptional regulation network of Escherichia coli. Nature Genetics. 2002;31:64–68. doi: 10.1038/ng881. [DOI] [PubMed] [Google Scholar]
- Milo R, Shen-Orr S, Itzkovitz S, Kashtan N, Chklovskii D, Alon U. Network motifs: Simple building blocks of complex networks. Science. 2002;298:824–827. doi: 10.1126/science.298.5594.824. [DOI] [PubMed] [Google Scholar]
- Jenssen TK, Laegreid A, Komorowski J, Hovig E. A literature network of human genes for high-throughput analysis of gene expression. Nat Gene. 2001;38:A21–28. doi: 10.1038/88213. [DOI] [PubMed] [Google Scholar]
- Butte AJ, Tamayo P, Slonim D, Golub TR, Kohane IS. Discovering functional relationships between RNA expression and chemotherapeutic susceptibility using relevance networks. Proc Natl Acad Sci USA. 2000;97:12182–12186. doi: 10.1073/pnas.220392197. [DOI] [PMC free article] [PubMed] [Google Scholar]
- Yanai I, DeLisi C. The society of genes: networks of functional links between genes from comparative genomics. Genome Biology. 2002;3:Research0064. doi: 10.1186/gb-2002-3-11-research0064. [DOI] [PMC free article] [PubMed] [Google Scholar]
- Watts DJ, Strogatz SH. Collective dynamics of 'small-world' networks. Nature. 1998;393:440–442. doi: 10.1038/30918. [DOI] [PubMed] [Google Scholar]
- Collet P, Eckmann JP. The number of large graphs with a positive density of triangles. J Stat Phys. 2002;109:923–943. doi: 10.1023/A:1020489507547. [DOI] [Google Scholar]
- Alizadeh AA, Eisen MB, Davis RE, Lossos IS, Rosenwald A, Boldrick JC, Sabet H, Tran T, Yu X, Powell JI, et al. Distinct types of diffuse large B-cell lymphoma identified by gene expression profiling. Nature. 2000;403:503–522. doi: 10.1038/35000501. [DOI] [PubMed] [Google Scholar]
- Van Lint JH, Wilson RM. A course in combinatorics. Cambridge, Cambridge University Press. 2001.
- Dwight SS, Harris MA, Dolinski K, Ball CA, Binkley G, Christie KR, Fisk DG, Issel-Tarver L, Schroeder M, Sherlock G, et al. Saccharomyces genome database (SGD) provides secondary gene annotation using the gene ontology (GO) Nucleic Acids Res. 2002;30:69–72. doi: 10.1093/nar/30.1.69. [DOI] [PMC free article] [PubMed] [Google Scholar]
- Jeong H, Tombor B, Albert R, Oltval ZN, Barabasi AL. The large-scale organization of metabolic networks. Nature. 2000;407:651–654. doi: 10.1038/35036627. [DOI] [PubMed] [Google Scholar]
- Featherstone DE, Broadie K. Wrestling with pleiotropy: Genomic and topological analysis of the yeast gene expression network. Bio Essays. 2002;24:267–274. doi: 10.1002/bies.10054. [DOI] [PubMed] [Google Scholar]
- Domany E. Cluster analysis of gene expression data. J Stat Phys. 2003;110:1117–1139. doi: 10.1023/A:1022148927580. [DOI] [Google Scholar]
- Cheng Y, Church GM. Biclustering of expression data. Proc Int Conf lntell Syst Mol Biol. 2000;8:93–103. [PubMed] [Google Scholar]


