Abstract
Background
Socioeconomic and ethnic inequalities in health are of great concern, and life expectancy provides a readily understood means of monitoring such inequalities. The objectives of this study are to (1) measure life expectancy by socioeconomic deprivation and ethnicity, and (2) describe trends in the deprivation gradient in life expectancy since the mid-1990s.
Methods
Three years of national mortality data have been combined with mid-point population denominators to produce life tables within nationally determined levels of small area deprivation (NZDep96) for three ethnic group: European, Mäori and Pacific peoples. This process has been repeated for the periods 1995–97, 1996–98, 1997–99 and 1998–2000.
Results
There was a strong relationship between increasing small area deprivation and decreasing life expectancy. Through the mid- to late 1990s, males living in the most deprived small areas in New Zealand experienced life expectancies at birth approximately nine years less than their counterparts living in the least deprived areas; for females the corresponding difference was under seven years.
Mäori and Pacific life expectancies at birth were lower than those of Europeans at each level of deprivation.
Over the study period (1995–2000) the gradient in life expectancy across deprivation deciles remained stable.
Conclusion
Small area deprivation analyses of life expectancy could be repeated routinely at regular intervals, which would provide a useful approach to monitoring trends in socioeconomic, geographic, ethnic and gender inequalities in mortality.
Introduction
In New Zealand, as in other countries, socioeconomic inequalities in health are of great concern [1]. Yet we have only limited information about socioeconomic mortality gradients in New Zealand, and whether the distribution of survival chances across the population is becoming more or less equal over time. Previous analyses have been restricted to occupation-based social classes, as occupation is the only socio-economic variable recorded on New Zealand death certificates. These studies show that mortality varies linearly across the six social classes, the ratio between extreme classes being about two-fold [2,3]. Similar gradients were found for both Mäori (the indigenous population of New Zealand) and non-Mäori, but within social classes Mäori have higher mortality. The gradient is seen for all major causes of death. Between the mid-1970s and 1980s the social class inequality in mortality apparently widened, and this trend has continued into the 1990s [4]. However, unlinked cross sectional mortality studies – in which the denominator data is drawn from a census while the numerator data is derived from unlinked death certificates – are notoriously susceptible to numerator/denominator bias, so this apparent period trend may be spurious.
Moreover, while the occupational class analyses have drawn attention to the social patterning of life chances in New Zealand, these studies are restricted to employed working-age males only – currently less than 30 percent of the total New Zealand population. A more inclusive approach is to use small neighbourhood of residence, classified according to degree of deprivation, as a marker of social circumstances [5-8]. This has the advantage of including the whole population, all age groups and both genders. It also reduces the risk of numerator/denominator bias, since usual residential address – unlike occupation – will generally be recorded accurately on both the death certificate and in the census.
Many analyses of social inequalities in mortality have used directly standardised mortality rates or indirectly standardised mortality ratios as the outcome variable. As life expectancy is a commonly used metric in comparing the mortality experience of populations, this analysis examines life tables, constructed separately for each gender and three major ethnic groups, for small areas classified according to socioeconomic deprivation, for three-year periods centred around the years 1996 to 1999. Life expectancy has the advantage over other measures of mortality of being readily understood, and largely independent of differences in population age structure. As a method of survival analysis, the life table also enables a range of statistics to be estimated, including population survival curves and probabilities of surviving to, or dying between, different ages, as well as the more familiar statistic of life expectancy (at birth or other ages).
The ethnic groups included in this study are the majority European/Other ethnic group, the Maori ethnic group (the indigenous population, comprising approximately 15 percent of the total population), and the Pacific ethnic group (immigrants from the Pacific Islands and their descendents, comprising approximately 6 percent of the total population). Both the latter ethnic groups are more socioeconomically deprived and have younger age structures than the majority ethnic group, which comprises mainly New Zealanders of European origin.
Methods
The NZDep96 index of deprivation
NZDep96 combines nine variables from the 1996 Census, reflecting eight domains of deprivation (Table 1) [8,9]. Each variable was calculated as the proportion of people with the specified deprivation characteristic in each small area, comprising one (or occasionally more) meshblocks. Meshblocks are the smallest geographical units defined by Statistics New Zealand, containing a median of 90 people. Each proportion is age standardised and, where necessary, adjusted for household composition.
Table 1.
Variables included in NZDep96
| Variable | Description | |
| 1 | Communication | People with no access to a telephone |
| 2 | Income | People aged 18–59 receiving a means-tested benefit |
| 3 | Employment | People aged 18–59 unemployed |
| 4 | Income | People living in households with equivalised1 income below an income threshold |
| 5 | Transport | People with no access to a car |
| 6 | Support | People aged < 60 living in a single-parent family2 |
| 7 | Qualifications | People aged 18–59 without any qualifications3 |
| 8 | Owned home | People not living in own home |
| 9 | Living space | People living in households below equivalised1 bedroom occupancy threshold |
(1) Equivalisation = methods used to control for household composition; (2) People less than 60 in a single parent family with dependent children as a proportion of all people under 60; (3) School or post school educational or training qualifications.
NZDep96 is the score on the first component in a principal component analysis of these nine adjusted proportions. The score is a weighted sum of these proportions for each small area in New Zealand. The NZDep96 index of deprivation scale ranges from decile 1 to decile 10, where a value of 10 indicates that the small area is in the most deprived 10 percent of areas in New Zealand.
Life table construction
Life tables were produced for the three-year periods 1995–97,1996–98, 1997–99 and 1998–2000 for the whole New Zealand population and separately for three ethnic groups (European, Mäori and Pacific) defined by the total ethnic group concept, by gender, using standard demographic methods [10].
Abridged life tables were produced for all 10 NZDep96 deciles for the total New Zealand population and the European/Other ethnic group (here referred to simply as the European ethnic group). For the Mäori and Pacific ethnic groups, deprivation deciles were combined in order to obtain sufficient numbers of deaths for reliable analysis. The decile groupings for the Mäori ethnic group were 1–7, 8–9 and 10, and for the Pacific ethnic group the groupings were deciles 1–8 and 9–10. These groupings were selected to ensure sufficient numbers of deaths in each category for analysis, and reflect the concentration of Maori and Pacific ethnic groups in the more deprived deciles. Deciles for the European ethnic group were similarly combined for comparative analyses.
The population used in the construction of the 1995–97 life tables was the estimated resident population at 30 June 1996 (the mid-point for the period 1995–97). Birth and death data used in the construction of the life tables were the averages for the three years 1995–1997. For the Mäori, Pacific and European ethnic group analyses, the data used are for 1996 and 1997, and numbers for 1995 were estimated from these, because of changes in the definitions of ethnicity that occurred in 1995 [11].
Similar methods were used to construct the 1996–98, 1997–99 and 1998–2000 life tables, thereby generating four series of life tables based on three-year moving averages spanning the period between the 1996 and 2001 censuses.
Trend description
Examination of trends was carried out firstly by examining changes in life expectancy for each decile from 1995–97 to 1998–2000, and secondly, by analysing changes in life expectancy differentials between decile 1 and the other deciles over the study period. It was assumed that the relative deprivation of each meshblock (ie its decile category) remained unchanged over the intercensal period.
More advanced statistical tests for trend were not done because of limitations in the data and method, including the stationary meshblock assumption and variation in the proportion of deaths with meshblock unspecified – which fell from 7.2 percent of all deaths in 1996 to 2.2 percent in 2000. It is not known if this trend was differential by deprivation decile.
Results
1995–97 baseline
Life expectancy at birth declined markedly as the deprivation of the area of residence increased (Figure 1). A similar pattern was found at ages 15, 45 and 65 years. For males, there was a nine-year difference in life expectancy at birth between the least deprived and the most deprived tenths of New Zealand society (since approximately 10 percent of the population live in each of the area deprivation deciles). For women this difference was smaller, at 6.7 years. The gender difference in life expectancy at birth increases between deciles 1 and 10, from approximately 4.0 years to 6.5 years.
Figure 1.
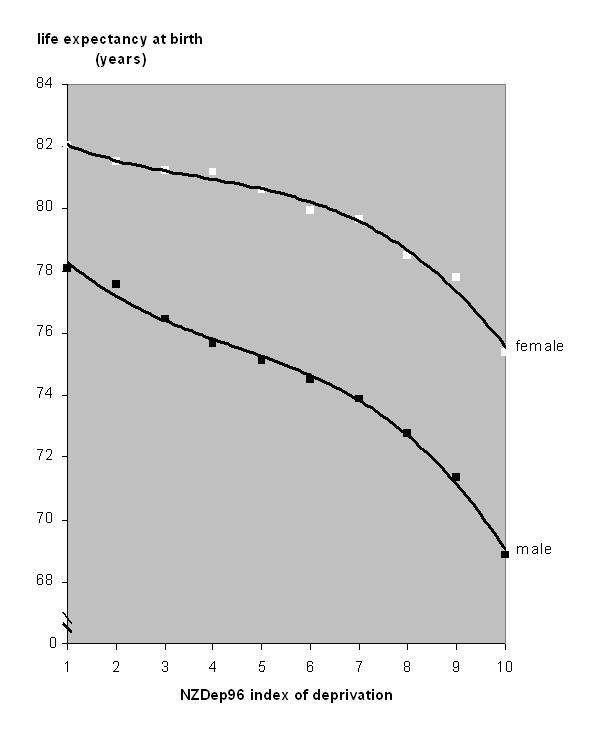
Life expectancy at birth, by NZDep96, for the total New Zealand population.
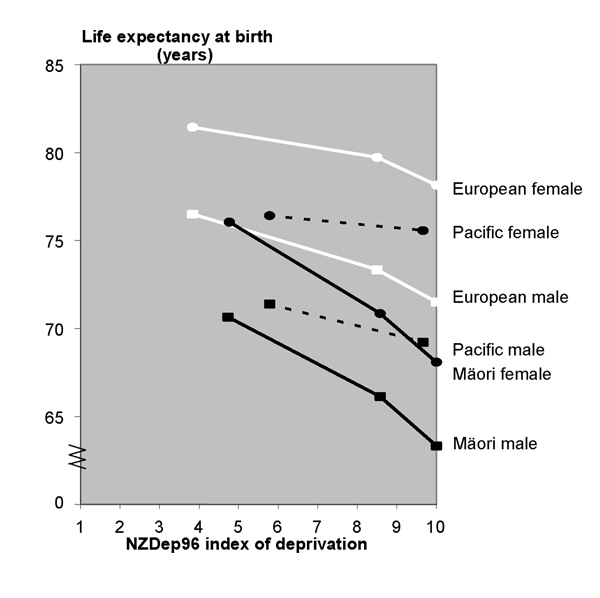
Mäori life expectancy at birth was shorter than European life expectancy. Using population-weighted average life expectancy over the first seven deciles for both ethnic groups, the difference between European and Mäori life expectancies within this deprivation stratum was 5.8 years for males and 5.3 years for females (Figure 2). At the 10th decile – the most deprived – the differential increased to 8.2 years for males and 10.1 years for females.
Figure 2.
Life expectancy at birth, by aggregated NZDep96 deprivation decile, for the Mäori, Pacific and European ethnic groups*. * Population-weighted midpoints of aggregated NZDep96 deciles differ for each ethnic group.
The situation was less severe for the Pacific ethnic group, perhaps partly due to a 'healthy migrant' effect and return migration of older Pacific people. In the first eight deciles combined, Pacific people had shorter life expectancies at birth than Europeans by 4.7 years for males and 4.8 years for females. In the two most deprived deciles combined, the differential was 3.1 years for males and 3.4 years for females. For both genders the survival disadvantage of decile 10 compared to decile 1 residents is least evident in children and younger adults but increases thereafter, becoming marked in middle age and beyond – reflecting higher chronic disease risk at older ages (Table 2).
Table 2.
Probability of surviving life cycle stages for least and most deprived NZDep96 deciles, by gender
| Male | Female | |||
| Decile* 1 | Decile 10 | Decile 1 | Decile 10 | |
| 0–14 | 0.994 | 0.982 | 0.995 | 0.986 |
| 15–24 | 0.991 | 0.979 | 0.997 | 0.991 |
| 25–44 | 0.981 | 0.946 | 0.989 | 0.969 |
| 45–64 | 0.912 | 0.753 | 0.937 | 0.821 |
| 65–84 | 0.373 | 0.226 | 0.533 | 0.420 |
* NZDep96 decile 1 is least deprived, decile 10 is most deprived.
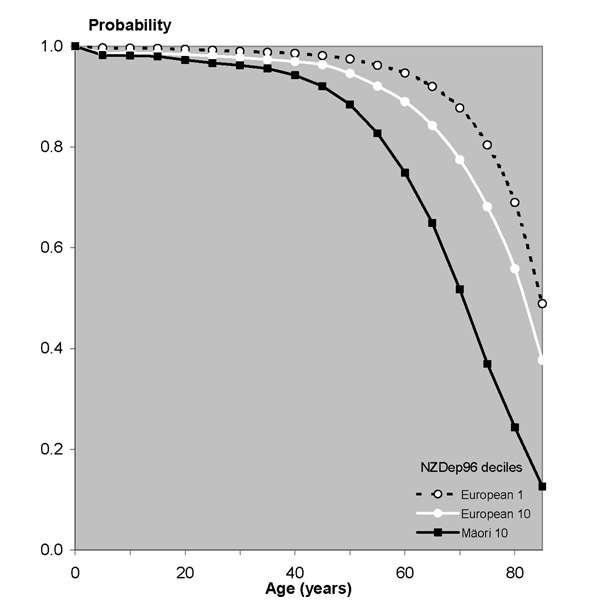
National cumulative survival curves for males and females are shown in Figures 3 and 4 for Europeans in the least and most deprived deciles, and for Mäori in the most deprived decile (there are insufficient Mäori in the least deprived decile to provide reliable data). The survival curves graphically demonstrate the lower survival chances of decile 10 compared to decile 1 residents at all ages, and of Mäori compared to Europeans within decile 10. The especially poor survival chances of Mäori decile 10 females compared with other females are very apparent.
Figure 3.
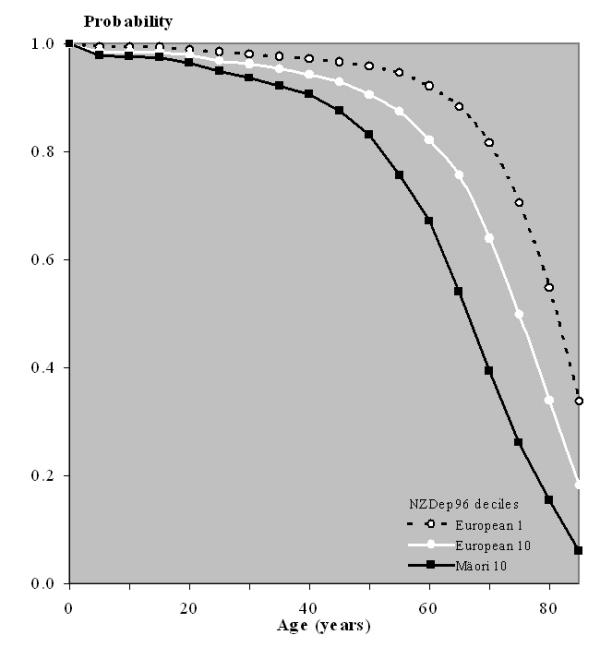
Selected cumulative survival curves, by deprivation and ethnicity*, male. * There are insufficient Mäori in deprivation decile 1 to give a reliable curve.
Figure 4.
Selected cumulative survival curves, by deprivation and ethnicity*, female. * There are insufficient Mäori in deprivation decile 1 to give a reliable curve.
Trends from 1995–97 to 1998–2000
We report here trends in life expectancy at birth for the whole New Zealand population. Similar patterns were exhibited in life expectancies at other ages. Trends could not be examined separately for ethnic groups other than Europeans (data not shown), because of data limitations.
Trends in life expectancy at birth for the whole population by deprivation decile are shown in Table 3. Inter-decile patterns in 1995–97 and 1998–2000 (the beginning and end of the study period) were fitted with a gradient curve and are plotted in Figure 5. Changes in life expectancy at birth were almost uniform across all deciles. A parallel upward shift in the deprivation curve in life expectancy at birth is observed over the period. Visually, there is no evidence for the gradient becoming steeper or shallower, for either gender.
Table 3.
Life expectancy at birth, by deprivation decile, New Zealand, 1995–97 to 1998–2000
| Decile | Male | Female | ||||||||
| 1995–97 | 1996–98 | 1997–99 | 1998–2000 | overall increase | 1995–97 | 1996–98 | 1997–99 | 1998–2000 | overall increase | |
| 1 | 78.1 | 78.5 | 79.1 | 79.3 | 1.3 | 82.0 | 82.3 | 82.6 | 82.8 | 0.8 |
| 2 | 77.6 | 77.8 | 78.1 | 78.5 | 0.9 | 81.5 | 82.0 | 82.5 | 82.9 | 1.4 |
| 3 | 76.5 | 76.9 | 77.3 | 77.8 | 1.4 | 81.2 | 81.7 | 81.9 | 82.1 | 0.8 |
| 4 | 75.7 | 76.3 | 76.6 | 77.5 | 1.8 | 81.2 | 81.7 | 81.9 | 82.3 | 1.1 |
| 5 | 75.1 | 76.1 | 76.1 | 76.3 | 1.2 | 80.6 | 81.2 | 81.3 | 81.6 | 1.0 |
| 6 | 74.5 | 75.1 | 75.4 | 75.8 | 1.3 | 79.9 | 80.4 | 80.6 | 81.0 | 1.1 |
| 7 | 73.9 | 74.4 | 74.8 | 75.1 | 1.3 | 79.6 | 80.2 | 80.5 | 80.7 | 1.1 |
| 8 | 72.8 | 72.8 | 73.5 | 74.1 | 1.4 | 78.5 | 79.0 | 79.4 | 80.2 | 1.7 |
| 9 | 71.3 | 71.8 | 72.0 | 72.7 | 1.3 | 77.8 | 78.2 | 78.5 | 78.8 | 1.0 |
| 10 | 68.9 | 69.4 | 69.6 | 69.8 | 0.9 | 75.4 | 75.8 | 76.4 | 77.2 | 1.8 |
Figure 5.
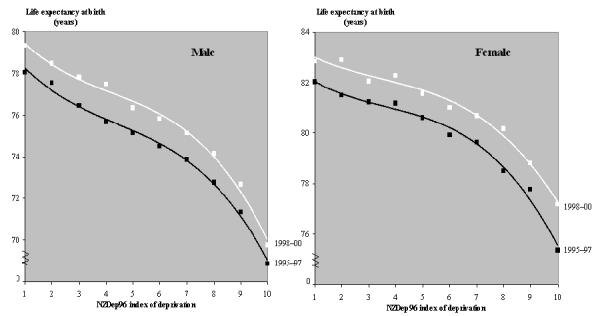
Life expectancy at birth, by deprivation decile, New Zealand, 1995–97 and 1998–2000.
The magnitude of change in life expectancy at birth for each decile between 1995–97 and 1998–2000 is summarised in Table 3. The increases fall into a relatively narrow range for all deprivation deciles (for both genders), averaging about 1.25 years of life (or an annualised average of 0.3 years of life per calendar year).
Another way of assessing change in the slope of the deprivation gradient over time is to measure changes in the average disparity between decile 1 and all other deciles (table 4). For males, the average disparity in life expectancy at birth has stayed largely unchanged over the period. For females, the average disparity between decile 1 and all other deciles seems to have reduced marginally, though this apparent trend is largely caused by greater-than-average increases in life expectancy at birth for females in deciles 8 and 10 over the study period.
Table 4.
Average disparity in life expectancy at birth between the least deprived and other deciles, whole population, 1995–97 to 1998–2000
| Male | Female | |||||||
| 1995–97 | 1996–98 | 1997–99 | 1998–2000 | 1995–97 | 1996–98 | 1997–99 | 1998–2000 | |
| Average of deciles 2–10 | 4.0 | 4.0 | 4.2 | 4.0 | 2.5 | 2.3 | 2.3 | 2.1 |
Discussion
The relationship between small area deprivation and life expectancy is strong. The analyses presented here are based on six years of national mortality data (five for ethnic-specific analyses), although caution should be exercised on account of the small numbers of deaths recorded in some of the younger age groups. In some cases minor adjustments were made to the data, or rates were smoothed. It should also be noted that deprivation of area of residence was measured for death records only, not for birth records. While it may be reasonable to expect life expectancy to be influenced by the deprivation of area of residence of the parents at the time of birth, such conclusions cannot be drawn from the life table analyses presented here.
The difference in life expectancy at birth between extreme deprivation deciles – approximately nine years for males and seven years for females – is similar to that found in the United Kingdom [12]. If everyone enjoyed the survival chances of those in the least deprived 10 percent of small areas, New Zealand life expectancy at birth in the late 1990s would have been approximately 82 years for females and 78 years for males. Furthermore, the narrowing of the gender gap in life expectancy at birth from 6.5 years in the most deprived areas to only 4.0 years in the least deprived areas highlights the scope that still exists for survival gains by males – especially males living in more deprived areas – in New Zealand.
The association between life expectancy and deprivation is seen for all three major ethnic groups. Mäori life expectancy at birth was consistently less than European life expectancy at birth, regardless of the level of deprivation. The analyses are less robust for Pacific peoples, partly because of small numbers of deaths, and partly because of distortions from migration effects.
To date, research and interventions related to Mäori health status have focused on behaviours, postulated genetic differences and culture. However, other authors have noted that these approaches locate the problem within the disadvantaged group and fail to acknowledge the role of the structural features of society that systematically disadvantage some groups [13,14]. For example, Jones [13] argues that institutional racism – differential access to the goods, services and opportunities of society by ethnicity – has a pervasively negative effect on the health of both minority and majority ethnic groups. The results reported here provide supportive evidence for the joint effect of deprivation and discrimination on the survival chances of Mäori.
Examination of trends in the deprivation gradient in life expectancy at birth (or other ages) failed to show convincing evidence of change in slope over the study period. However, the analysis had to be restricted to the whole population or European ethnic group only, and covered only the relatively short period from 1995–97 to 1998–2000. If this method is to be useful for monitoring trends in social inequalities in health, it will be necessary to overcome data limitations inhibiting full ethnic analysis, and to develop 'crosswalks' between deprivation indices based on different censuses.
More generally, monitoring socioeconomic inequalities in summary measures of population health is an important stewardship function of any Ministry of Health [1,15]. In New Zealand, the recently established New Zealand Census Mortality Study [16], which is a record linkage study involving probabilistic matching of death certificates to census questionnaires, and the unlinked occupational class mortality studies of Pearce et al [2,17-20] and Sporle et al [4], are the only tools currently available for monitoring socioeconomic mortality gradients. However, these analyses are restricted to a 5- or 10-year periodicity and fail to include the whole population (because of failures in record matching and non-participation of individuals in the labour force, respectively). Moreover, the unlinked occupation based studies are highly susceptible to numerator-denominator bias.
The small area deprivation analysis of life expectancy reported here could be repeated regularly (the trend data suggest that three- to five-yearly monitoring would be appropriate), and would provide a useful complement to the New Zealand Census Mortality Study. Taken together, these two methods would provide a comprehensive, robust and timely information system for monitoring trends in socioeconomic, geographic, ethnic and gender inequalities in survival chances, both all-cause and by cause (the life table analyses could examine the contribution of different causes of death to the deprivation gradient using cause-deleted life table methods) [21].
Extension from analyses of (age-standardised) mortality rates and life table indicators (life expectancy at different ages, probabilities of surviving different life cycle stages, and population survival curves) to analysis of person-years of life lost should also be considered, as this would provide a better indicator of social variation in the prematurity of mortality [15]. Causal analysis could also be extended from the level of diseases to risk factors (for example, smoking) [21] by using population-attributable risk methods in conjunction with cause-deleted life tables.
Conclusions
Collectively, this set of simple methods provides a sensitive tool for national and regional monitoring of social mortality gradients, based solely on data readily available from death certificates (usual residential address, age, gender, ethnicity and cause of death) and a population census (population denominators and classification of small areas by relative deprivation). More specifically, lifetables differentiated by deprivation or some other indicator of socio-economic stratification could be routinely produced by national statistical offices alongside conventional gender and ethnic-specific lifetables, and would usefully complement these other lifetables in the description and analysis of subgroup inequality in survival chances.
Competing interests
None declared. This article is published with permission of the Director-General, New Zealand Ministry of Health. The opinions expressed are those of the authors and do not necessarily reflect the views of the Ministry of Health.
Authors' contributions
MT conceived of the study, and participated in its design and coordination. JC participated in the design of the study and performed the statistical analysis. Both authors read and approved the final manuscript.
Acknowledgments
Acknowledgements
The authors gratefully acknowledge the technical advice and assistance of Clare Salmond (Wellington Medical School), Peter Crampton (Wellington Medical School), Mike Chan (Statistics New Zealand), Michael Marmot (University College London) and Papaarangi Reid (Eru Pomare Maori Health Research Centre).
Contributor Information
Martin I Tobias, Email: Martin_Tobias@moh.govt.nz.
Jit Cheung, Email: Jit_Cheung@moh.govt.nz.
References
- Howden-Chapman P, Tobias M (Eds) Social Inequalities in Health: New Zealand 1999. Wellington: Ministry of Health. 2000.
- Pearce NE, Davis PB, Smith AH, Foster FH. Mortality and Social Class in New Zealand. I:Overall male mortality. New Zealand Medical Journal. 1983;96:281–285. [PubMed] [Google Scholar]
- Pearce N, Pomare E, Marshall S, Borman B. Mortality and Social Class in Maori and non-Maori New Zealand Men: Changes between 1975–7 and 1985–7. New Zealand Medical Journal. 1993;106:193–196. [PubMed] [Google Scholar]
- Sporle A, Pearce N, Davis P. Social class mortality differences in Maori and non-Maori men aged 15–64 during the last two decades. New Zealand Meicald Journal. 2002;115:127–131. [PubMed] [Google Scholar]
- Lynch J, Kaplan G. Socioeconomic position. In: Berkman L, Kawachi I, editor. Social Epidemiology. Oxford: Oxford University Press; 2000. [Google Scholar]
- Carstairs V. Deprivation Indices: Their interpretation and use in relation to health. Journal of Epidemiology and Community Health. 1995;49:S3–8. doi: 10.1136/jech.49.suppl_2.s3. [DOI] [PMC free article] [PubMed] [Google Scholar]
- Eames M, Ben-Shlomo Y, Marmot M. Social Deprivation and Premature Mortality: Regional comparisons across England. British Medical Journal. 1993;307:1097–1102. doi: 10.1136/bmj.307.6912.1097. [DOI] [PMC free article] [PubMed] [Google Scholar]
- Salmond C, Crampton P, Sutton F. NZDep91: a new index of deprivation. Australian and New Zealand Journal of Public Health. 1998;22:95–97. doi: 10.1111/j.1467-842x.1998.tb01505.x. [DOI] [PubMed] [Google Scholar]
- Salmond C, Crampton P, Sutton F. NZDep96 Index of Deprivation. Research Report No 8 Wellington: Health Services Research Centre. 1998.
- Statistics New Zealand Demography Division (SNZ) Abridged Life Tables By Deprivation Group 1995–1997. Unpublished report for the Ministry of Health Christchurch: Statistics New Zealand. 1999.
- MI Tobias MI. Monitoring Ethnic Inequalities in Health. Occasional Bulletin Number 4 Wellington: Ministry of Health. 2001.
- D Acheson D. Independent Inquiry into Inequalities in Health. London: The Stationery Office. 1998.
- Jones C. Levels of Racism: A theoretical framework and a gardener's tale. American Journal of Public Health. 2000;90:1212–1215. doi: 10.2105/ajph.90.8.1212. [DOI] [PMC free article] [PubMed] [Google Scholar]
- Pomare E, Keefe-Ormsby Y, Ormsby C, et al. Hauora Maori Standards of Health III. Wellington: TeRopu Rangahau Hauora a Eru Pomare, Wellington School of Medicine. 1995.
- Ministry of Health Our Health, Our Future: Hauora Pakari, Koiroa Roa: The Health of New Zealanders 1999. Wellington: Ministry of Health. 1999.
- Blakely T, Woodward A, Salmond C. Anonymous Linkage of New Zealand Mortality and Census Data. Australian and New Zealand Journal of Public Health. 2000;24:92–95. doi: 10.1111/j.1467-842x.2000.tb00732.x. [DOI] [PubMed] [Google Scholar]
- Pearce NE, Davis PB, Smith AH, Foster FH. Mortality and Social Class in New Zealand. III: Male mortality by ethnic group. New Zealand Medical Journal. 1984;97:31–35. [PubMed] [Google Scholar]
- Pearce N, Howard J. Occupational, Social Class and Male Cancer Mortality in New Zealand 1974–1978. International Journal of Epidemiology. 1986;15:456–462. doi: 10.1093/ije/15.4.456. [DOI] [PubMed] [Google Scholar]
- Pearce N, Marshall S, Borman B. Undiminished Social Class Mortality Differences in New Zealand men. New Zealand Medical Journal. 1991;104:153–156. [PubMed] [Google Scholar]
- Pearce NE, Davis PB, Smith AH, Foster FH. Mortality and Social Class in New Zealand. II: Male mortality by major disease groupings. New Zealand Medical Journal. 1983;96:711–716. [PubMed] [Google Scholar]
- Ministry of Health Inhaling Inequality. Wellington: Ministry of Health. 2001.


