Abstract
This work describes a method for predicting DNA binding function from structure using 3-dimensional templates. Proteins that bind DNA using small contiguous helix–turn–helix (HTH) motifs comprise a significant number of all DNA-binding proteins. A structural template library of seven HTH motifs has been created from non-homologous DNA-binding proteins in the Protein Data Bank. The templates were used to scan complete protein structures using an algorithm that calculated the root mean squared deviation (rmsd) for the optimal superposition of each template on each structure, based on Cα backbone coordinates. Distributions of rmsd values for known HTH-containing proteins (true hits) and non-HTH proteins (false hits) were calculated. A threshold value of 1.6 Å rmsd was selected that gave a true hit rate of 88.4% and a false positive rate of 0.7%. The false positive rate was further reduced to 0.5% by introducing an accessible surface area threshold value of 990 Å2 per HTH motif. The template library and the validated thresholds were used to make predictions for target proteins from a structural genomics project.
INTRODUCTION
The ability to assign function from protein structure is very important for structural genomics projects, in which protein structures are solved that have very low sequence identity to any currently in the Protein Data Bank (PDB) (1). Tools that allow for the prediction of protein function from structure will become of increasing importance as these projects gather momentum. The identification of proteins with a DNA binding function will be an integral part of a larger system that will be required to make inferences on function, from the presence of binding clefts, and the identification of enzyme active sites and small molecule binding sites.
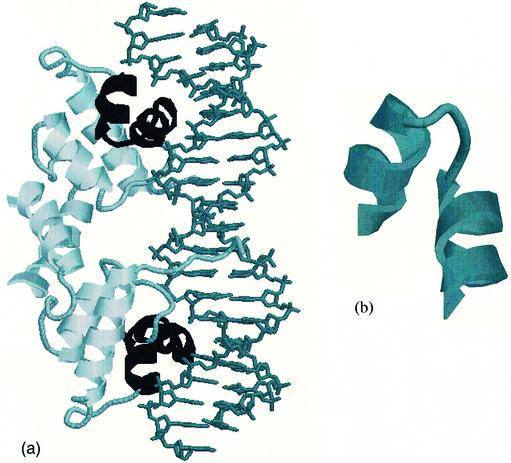
This work describes a method for using 3-dimensional (3D) structural templates to identify proteins that have a specific DNA binding function. The helix–turn–helix (HTH) motif is one of the most common motifs used by proteins to bind DNA. It is a relatively small contiguous motif (∼20 residues in length), comprising in its simplest form two perpendicular helices (H1 and H2) joined by a short linker (a turn) (2). The C-terminal helix (H2) is the one that includes the DNA recognition residues responsible for sequence-specific DNA binding, usually through contacts in the major groove of the DNA double helix (2). A classic example of this motif is observed in the structure of the γ repressor (3) (Fig. 1). The HTH motif is found in approximately one-third of DNA-binding protein structure families [16/54 families identified by Luscombe et al. (4)], and hence represents a significant proportion of proteins that bind DNA.
Figure 1.
(a) Rasmol image of the dimeric λ repressor/operator complex [PDB code 1lmb (3)] with the HTH motif in each protein subunit highlighted in black. The protein is depicted with the secondary structures as cartoons and the double-stranded DNA molecule is shown in stick representation. (b) Detail of Rasmol image of the HTH motif extracted from chain 3 of the λ repressor/operator complex which spans residues 33–51.
In this work a library of seven 3D structural templates of HTH motifs were derived from structurally non-homologous proteins in the PDB. Templates were scanned against protein structures and a root mean squared deviation (rmsd) of the optimal superposition of a template on a structure calculated. The method has been validated by scanning templates against PDB structures in the CATH database (5). Significance thresholds in terms of a minimum rmsd of an optimal superposition and a minimum motif accessible surface area (ASA) have been calculated. In this way it is possible to scan the template library against proteins of unknown function to make predictions about DNA binding functionality. This method has been used to make predictions for protein targets from the Midwest Centre for Structural Genomics (MCSG).
MATERIALS AND METHODS
Data set of HTH structures derived from the PDB
For any method aimed at the automatic identification of a specific motif within a 3D protein structure, the starting point must be a comprehensive list of protein structures containing the specified motif. Hence the start point for the current work was a list of 120 proteins from the PDB known to contain at least one HTH motif, which had been identified from the literature. To update this list, a combination of protein family databases was used to extract sequence alignments for the 120 known HTH proteins. The Protein Families Database (Pfam) (6) was used in the first instance to search the sequences of the HTH proteins to identify which sequence families they included. In the case of multiple sequence families being identified (multiple families can be identified if the protein structure in the PDB has more than one domain), only the sequence family that included the segment of amino acid sequence designating the HTH motif was taken. When a sequence family was identified, the Pfam seed sequence alignment was used to create a Hidden Markov Model (HMM) using SAM-T99 (7). This HMM was then used to search the proteins from the PDB that had been classified in the protein hierarchical database CATH (5) to identify additional structures with HTH motifs not in the original list.
When additional structures were identified, confirmation of the DNA binding function and the location of the HTH motif was sought from the literature. Four of the structures from the original list did not belong to any Pfam family. In one case the structure was found to be a member of a family in the SMART database (8), and the sequence alignment was taken from that database and used to create an HMM. In three other cases no matches were found in either Pfam or SMART. For each of these proteins, sequence homologues were found using BLAST (9), sequence family alignments were created using ClustalX (10), and then new HMM models created using SAM-T99.
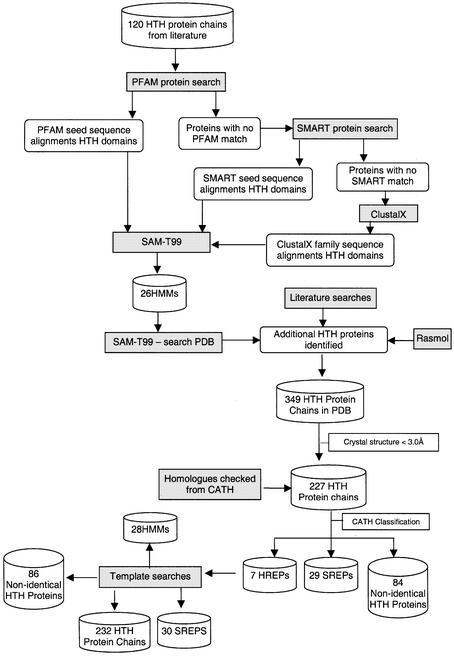
To ensure that no HTH proteins were missed due to discrepancies between sequence and structure databases, the CATH number for each of the proteins in the list identified from sequence family searches was recorded. Checks were made to ensure that every protein that had the same CATH number as a protein in the HTH protein list was present in the list of known HTH proteins. For example, if an HTH protein identified from sequence family searches had a CATH number of 1.10.10.60, all proteins in this homologous family were checked to ensure that they were also in the list of HTH proteins. This was found to be the case for all proteins. The complete process of HTH protein identification is summarised in Figure 2.
Figure 2.
Flow diagram summarising the process of creating a comprehensive reference data set of 3D protein structures containing HTH motifs. The starting point was a list of 120 proteins known to contain HTH motifs as collated from the literature. The end point was 86 non-identical HTH structural motifs associated with HMMs of 28 sequence families. SREPs are representative proteins from sequence families clustered at the 35% identity level. HREPs are representative proteins from homologous fold families (clustered at the H-level in CATH).
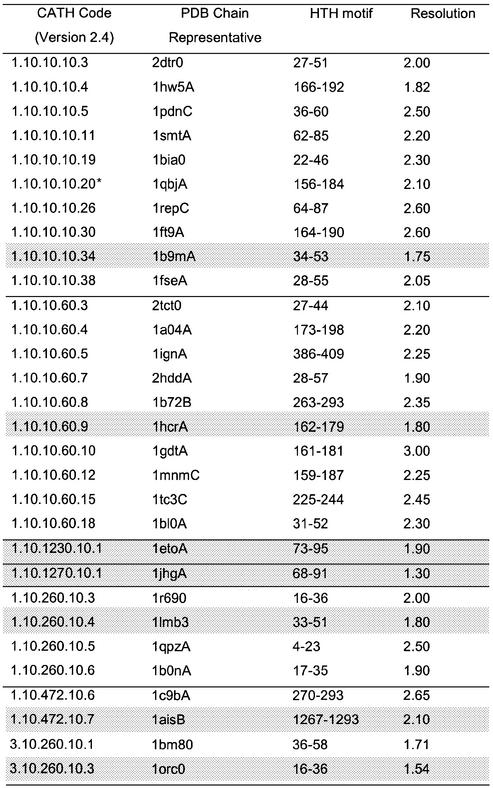
In this way a set of 349 HTH protein chains was identified. This data set was then reduced by removing those proteins that had crystal structures with a resolution >3.0 Å and those solved by nuclear magnetic resonance (NMR). These criteria resulted in a final list of 227 PDB protein chains that included DNA-binding HTH motifs. Using the CATH database (5) this data set was reduced to 84 non-identical protein chains, 29 sequence families (35% sequence identity level) and seven structurally non-homologous families (H-level in CATH). The protein with the best resolution was taken as the representative for each of the sequence families (denoted SREPs) and for each of the non-homologous structure families (denoted HREPs) (Fig. 2 and Table 2).
Table 2. The 84 HTH proteins were clustered in 29 sequence families using CATH numbers.
For each family a representative with the best resolution was selected (denoted a SREP). The location of the HTH motif in each SREP (in terms of PDB residue number range) is shown in column 3. An additional sequence family was identified in a second pass of the data and this is indicated by *. The proteins are ordered by CATH number, and each fold family is separated by a line. The seven non-homologous HTH proteins (HREPs) (one from each fold family) are indicated in grey.
Creation of templates and calculating optimal superpositions
For each of the SREP (and HREP) proteins, an HTH motif template was created. A template is a set of Cα backbones of protein structure fragments (taken from the coordinates of a PDB file). The templates are sequentially continuous in terms of residue number and comprise all the residues from the first residue in H1 to the last residue in H2. The start and end points of each HTH motif in each protein were identified by using the literature and visualising the proteins using Rasmol (11). The templates were scanned against whole protein structures using an algorithm (scan-rmsd), based on the Kabsch method (12), that computed a gapless optimal superposition. For a template (T) of length n scanned against a protein (P) of length m, the rmsd was calculated after each optimal superposition at each of the m – n + 1 possible positions in P. Hence, for one protein scanned with one template m – n + 1, overlapping comparisons were calculated. The rmsd for protein P was taken as the minimum rmsd obtained from all the superpositions.
Extended templates were created in a similar manner to that described above, except that the templates were extended by including one or more residues preceding H1 and one or more residues succeeding H2. To evaluate the optimum number of residues by which to extend the template, a series of extended templates was created for each of the templates from the 29 representative proteins in Table 2 (excluding 1qbjA, which was added after scanning the PDB with the structural templates). For a single template, a series of extended templates were created with 1–10 residues added at the start of H1 and at the end of H2. Hence the HTH template for the structure in PDB code 1smt chain B covers residues 64–83 (denoted 1smtB64-83). Making an extension of +1 residues means the template is now 1smtB63-84, and with an extension of +2 the template is now 1smtB62-85, etc.
In this way 10 extended templates were created for each structure. Where an extended template could not be made due to the fact that there were too few residues in the structure to add on the required number of residues, the template was not created and removed from the trial, e.g. if an HTH motif started at residue 5 and the complete structure comprised residues 1–100, then an extended template of +6 could not be created, as it would be extended beyond the start of the structure.
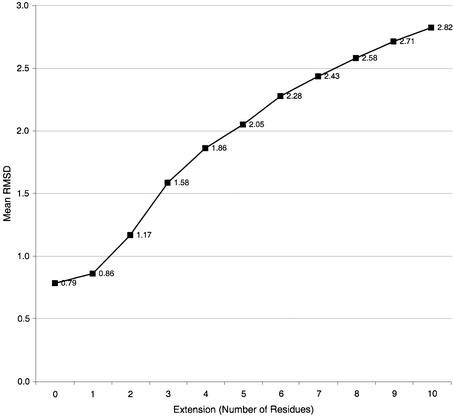
These extended templates were then scanned over the complete structure of the 29 representative proteins and the minimum rmsd recorded. This minimum excluded the match for the template scanned against the structure from which it was derived, i.e. no self-matches were recorded. For each extended template a mean rmsd was calculated, i.e. a single value for all +1 templates was calculated as the mean minimum rmsd value for all +1 templates. These values are shown in Figure 3.
Figure 3.
Mean minimum rmsd values obtained from the scanning of extended templates from the 29 sequence representatives (Table 2) against the same 29 structures (rmsd values for self-matches were not included). The values on the x-axis are the numbers of residues added to the start and end of the HTH motifs.
Scanning templates against the PDB
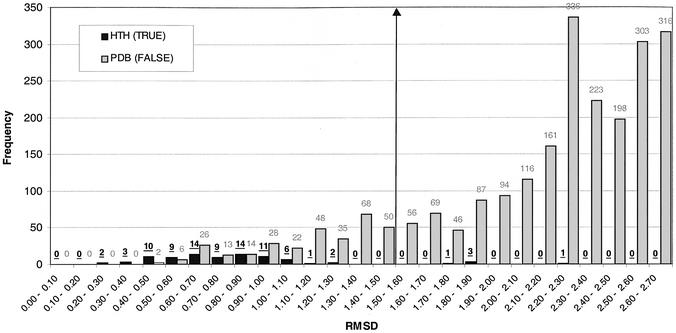
The seven HREP original templates and the seven HREP extended (+2 residues) templates were scanned against (i) the 84 non-identical HTH-containing PDB structures (termed HTH X TRUE) and (ii) the 8266 non-identical PDB chains in the CATH database (version 2.4) (excluding structures solved by NMR and all with a resolution of ≤3.0 Å as this is the criteria for inclusion in CATH), excluding the known HTH (termed HTH X FALSE). In each case the rmsd recorded for each structure was the minimum value calculated from any of the templates (again excluding self-matches). A frequency histogram was calculated for the rmsd values calculated using the original templates (Fig. 4). A cumulative frequency histogram was also calculated for both distributions of rmsd values (Fig. 5).
Figure 4.
Frequency histogram showing the distribution of rmsd values resulting from a scan of seven HTH templates against 84 HTH proteins (HTH X HTH) and 8266 PDB proteins (excluding known HTH proteins) (HTH X FALSE). The HTH X HTH distribution is shown in black and the HTH X FALSE distribution is shown in grey. The maximum rmsd shown is 2.7 Å. A threshold value is indicated at 1.6 Å, below which a protein is predicted to contain a DNA-binding HTH motif.
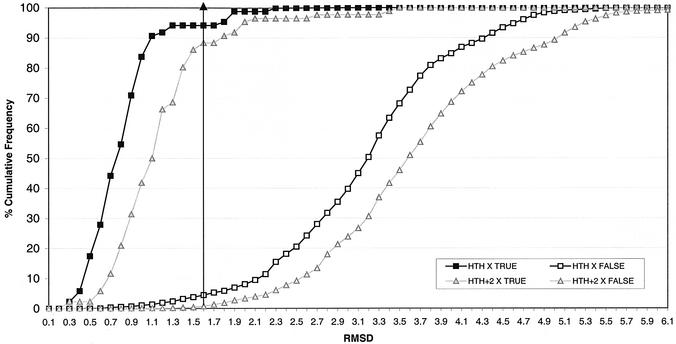
Figure 5.
Cumulative frequency histogram showing the distribution of rmsd values resulting from a scan of seven HTH templates against 84 non-identical HTH proteins (HTH X TRUE) and 8266 PDB proteins (excluding known HTH proteins) (HTH X FALSE), using the original templates (not extended) and using +2 residue extended templates. The points of the distributions for the original templates are shown with squares and for the extended templates as triangles. The maximum rmsd shown is 6.1 Å.
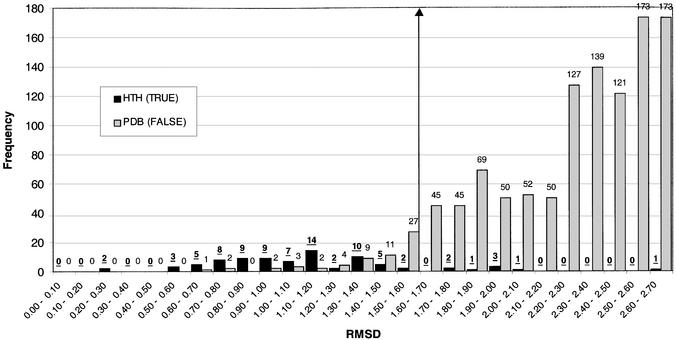
At this point all structures in the FALSE data set that scored an rmsd of <1.6 Å were analysed to ensure that none were proteins with DNA-binding HTH motifs. The structures were visualised using Rasmol and reference was made to the literature. It is possible that the original list of 120 HTH proteins did not cover all possible sequence families with HTH motifs. Hence the Pfam (or SMART) families to which such proteins belong would not have been used to create HMMs, and not included in the search for new HTH-containing proteins. This proved to be the case for five protein chains from two families (see Results). In an iterative process, the Pfam data for these families was used to search the PDB as described previously, and any structures identified that met the criteria for inclusion in the data set were added to the list of HTH templates. This enhanced list of templates (now totaling 86 non-identical protein chains) was then used to re-scan both the TRUE and the FALSE data sets (the latter now with 8264 non-identical protein chains). The absolute frequency distributions for this are shown in Figure 6.
Figure 6.
Frequency histogram showing the distribution of rmsd values resulting from a scan of seven HTH templates against 86 HTH proteins (HTH X HTH) and 8264 PDB proteins (excluding known HTH proteins) (HTH X FALSE). The HTH X HTH distribution is shown in black and the HTH X FALSE distribution is shown in grey. The maximum rmsd shown is 2.7 Å. A threshold value is indicated at 1.6 Å, below which a protein is predicted to contain a DNA-binding HTH motif.
Calculating accessible surface area of HTH motifs
To aid in the discrimination between HTH motifs that bind DNA and those that do not (i.e. to reduce the number of false positive matches from a scan of templates against complete PDB structures in CATH), the ASA of all 86 non-identical HTH motif templates was calculated using NACCESS (13). The ASA of each motif was taken as the total absolute ASA of all the residues included within the +2 extended template. The same ASA value was calculated for the false positive HTH motifs. In these proteins the residue range was taken as that identified by the template superposition that gave the minimum rmsd value.
Scanning templates against targets from a structural genomics project
The aim of the current work was to develop a predictive method for the identification of DNA-binding HTH motifs in protein structures, with the intention of using the method for structures from structural genomics projects for which function is unknown. To put this method into practice, each of the seven non-homologous HTH +2 extended templates was scanned against 30 protein targets whose complete coordinates were released and published by the MCSG (www.mcsg. anl.gov). The minimum rmsd obtained from any template was recorded for each target. The ASA of the matched HTH motif in the target was calculated using NACCESS (13). Those targets with rmsd values below the 1.6 Å rmsd threshold and with an ASA of >990 Å2 were predicted to have HTH motifs involved in DNA binding.
RESULTS
Data set of DNA-binding HTH proteins
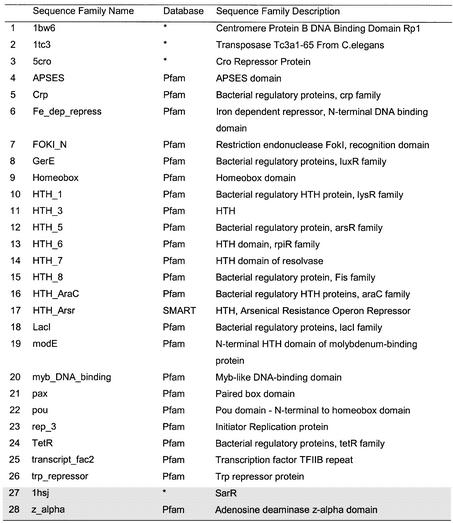
The starting point of this work was the creation of a complete list of proteins in the PDB that contained DNA-binding HTH motifs (Fig. 1). Starting with a list of 120 such proteins (identified from the literature), a combination of protein sequence family databases [Pfam (6) and SMART (8)] was used to collate and create HMMs. These HMMs where then used to search the PDB for further members of these sequence families. A total of 26 HMMs were used for this process and they are listed in Table 1. This process led to the identification of 84 non-identical proteins with DNA-binding HTH motifs (Fig. 2). These were clustered into 29 sequence families (35% sequence identity) (SREPs) and seven fold families (HREPs) using CATH (5) (Table 2).
Table 1. The HMMs used to collate an updated data set of 3D proteins containing HTH motifs.
Models 1–26 were collated by using an initial set of protein structures known to contain HTH motifs from the literature, and the subsequent searching of Pfam and SMART for sequence family matches. Models 27–28 (shaded rows) were added when scanning of the PDB with a set of seven HTH structural templates revealed additional protein families that were missing from the initial protein data set. The sequence family names and descriptions are taken from Pfam (version 7.8) or SMART (software version 3.4 and database update Dec 02 2002). For those families unmatched in either database (indicated by an asterisk), the sequence family names are the four letter PDB codes of the structures and the description is taken from the HEADER lines of the PDB file.
First scan of the PDB with 84 non-identical templates
3D templates were created from seven non-homologous HTH proteins that comprised the Cα backbone coordinates of the residues that formed the HTH motifs. These seven templates were then used to scan the 84 non-identical HTH structures (termed HTH X TRUE) (i) and all 8266 non-identical PDB chains in CATH (version 2.4) (excluding the known HTH protein chains) (termed HTH X FALSE) (ii). In all scans no self-matches were permitted. The distribution of minimum rmsd values from each of all possible superpositions of the templates on the structures (see Materials and Methods) is shown in Figure 4. This shows a large overlap between the rmsd values calculated from the HTH X TRUE scan and the HTH X FALSE scan. In the former, the rmsd values range from 0.2 to 2.2 Å and in the latter, from 0.5 to 6.6 Å. From this figure it is impossible to impose a threshold value for the identification of DNA-binding HTH motifs without incurring a large number of false positives or false negatives. If a theoretical threshold were chosen at 1.6 Å, there would be 368 false positives and 5 false negatives. The large number of non-DNA-binding HTH motifs identified in the PDB results from the fact that a contiguous segment of HTH secondary structure is common in many proteins.
From these initial results it was obvious that the 3D templates needed to discriminate more effectively between HTH motifs that have a DNA binding function and those that do not. It was proposed that the position of the HTH motif within the protein could be as important as the presence of the motif itself, and hence the templates were extended to include residues before H1 and after H2 of the motif.
Validating size of extended templates
In order to find the optimum number of residues by which to extend the templates, a number of trial scans were conducted. A series of extended templates for each original template were created for 29 representative proteins (see Materials and Methods). Each extended template was scanned over the 29 representative proteins and the minimum rmsd value recorded. The mean minimum rmsd value for these 29 × 29 trials with extensions of 1–10 residues before and after the HTH motifs is shown in Figure 3. The largest increase in rmsd is observed between +2 and +3 extensions (1.17 and 1.58 Å, respectively) and hence an extension of +2 was taken as the optimum size for the extended templates. An extension of +1 residue offered little improvement over the original template (0.86 compared to 0.79 Å) and an extension of more than +2 saw the mean rmsd rise to >1.5 Å, making the distribution of rmsd values for known HTH proteins much larger.
Second scan of the PDB with seven extended templates
The seven +2 extended templates were used to scan the 84 non-identical HTH proteins (termed HTH+2 X TRUE) (i) and 8266 non-identical PDB chains in CATH (version 2.4) (excluding the known HTH protein chains) (termed HTH+2 X FALSE) (ii). The cumulative frequency distributions for the scan of the extended templates on the two data sets is shown in Figure 5. This figure also includes the data for the original templates (with no extension) and clearly shows how the extension of the templates shifts the distribution of rmsd values to the right. This shift means that at any chosen threshold the number of false positives is reduced. At a threshold of 1.6 Å, the number of false positives is reduced from 368 to 61 by using the extended templates. This large reduction is mirrored by an acceptable increase in false negatives from 5 to 10. Hence, using the extended templates the choice of a useful threshold value, below which proteins are predicted to have an HTH motif with DNA binding function, is now possible with relatively low false negative and false positive values.
Identification of additional HTH proteins
To be confident that no HTH proteins had been missed and still remained categorised in the FALSE data set, all structures in HTH+2 X FALSE that scored an rmsd of <1.6 Å were analysed to ensure that none were proteins with DNA-binding HTH motifs. It was likely that the original list of 120 HTH proteins did not cover all possible sequence families with HTH motifs. This proved to be the case for a total of five protein chains that were members of one Pfam family [z-alpha (1qbjA)] and one family unclassified in both Pfam and SMART [sarR (1hsj)]. The addition of these proteins brought the total number of non-identical proteins with HTH motifs to 86 and the number of sequence families to 30 (Fig. 2). The fact that the initial use of the structural templates identified two families of DNA-binding proteins that had not previously been included exemplified the fact that a single structural template can identify HTH motifs from more than one sequence family and more than one fold family. For example protein 1qbjA belongs to the Pfam family z-alpha and the CATH fold 1.10.10.10. This protein is matched by template 1HCR160-181 that belongs to Pfam family HTH_5 and CATH fold 1.10.10.60 (i.e. same topology but different homologous family). This cross-fold matching will be exemplified further. The seven HTH motifs were then used to re-scan the enhanced list of 86 non-identical HTH proteins, and the updated FALSE dataset of non-identical PDB structures from CATH, now reduced to 8264 (as the two newly identified HTH proteins had been removed).
Third scan of the PDB with seven extended templates
Figure 6 shows the updated rmsd distributions, recorded for re-scanning of the seven HTH motifs against the two updated TRUE and FALSE data sets. In this figure the frequencies are shown as absolute values and the distribution is only shown to a maximum rmsd of 2 Å. Using this data a threshold value (below which a protein was predicted to contain a DNA-binding HTH motif) was selected at 1.6 Å. At this threshold there are 0.7% (61/8264) false positives, i.e. proteins predicted to include a DNA-binding HTH motif but not known to do so. This threshold also gave 11.6% (10/86) false negatives, i.e. proteins known to include a DNA-binding HTH motif but predicted as not containing one, and 88.4% (76/86) true hits.
Calculating the ASA threshold
The number of false positives was reduced by analysing the ASA of the residues comprising the HTH extended motifs. The absolute ASA for the residues in the 86 non-identical HTH templates ranged from 992 to 2740 Å2 (mean 1732 Å2). The range for the 61 false positive HTH motifs was 598– 1720 Å2 (mean 1074 Å2). A minimum ASA value for a DNA-binding HTH motif was set at 990 Å2. Using this value the number of false positive proteins that fell below the threshold was 23, hence the number of false positives was reduced from 61 to 38.
Analysis of false positive hits
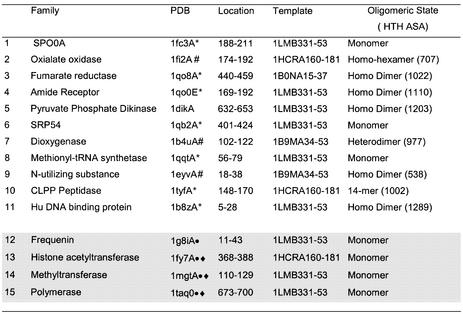
The 38 false positives were clustered into 15 structural families based on the CATH classification, and the member with the lowest resolution was selected as a family representative (Table 3). Eight of the family representatives were structures that functioned as oligomeric proteins, and for each of these structures the ASA of the HTH motif was re-calculated for the structure in its complete oligomeric state (Table 3). For three of these structures (1fi2A, 1b4uA and 1eyvA), the HTH ASA decreased below the 990 Å2 threshold and hence it can be assumed that these structures do not bind DNA with an HTH motif. In proglycin (1fi2A), the HTH motif is an integral part of the oligomerisation domain of the protein.
Table 3. There were 38 false positive proteins remaining when seven HTH templates were scanned against the PDB structures in CATH and a threshold rmsd value of <1.6 Å and ASA threshold of >990 Å2 applied.
This table gives details of the 15 structural families into which they were clustered using CATH. A hash symbol denotes structures in which the ASA of the HTH in the complete oligomer falls below the threshold of 990 Å2. * denotes structures in which one helix of the HTH identified is 3 or more residues longer than that in the HTH template. Circles denote those structures discussed in detail in Results and diamonds those structures proposed to have DNA-binding HTH motifs.
A further eight representative structures had helices in the matched HTH motif that were much longer than those in the HTH template that gave the minimum rmsd on superposition (Table 3). In all but one case (1tyfA) it was the H2 helix that extended beyond the template H2 helix, hence giving only a partial match. A matched motif in which one helix was significantly longer than that observed in DNA-binding HTH motifs was considered unlikely to have such a function. The four most interesting false matches were frequenin (1g8iA), polymerase (1taq0), histone acetyltransferase (1fy7A) and methyltransferase (1mgtA), all of which functioned as monomers and had full matches to both H1 and H2 of the HTH templates. These are discussed in detail below.
Human frequenin has a HTH motif matched by a template at residues 3–39. Frequenin is a calcium-binding protein comprised of two EF hand motifs. The HTH motif still has an ASA value above the 990 Å2 threshold when the three bound calcium ions are included in the calculation. The HTH motif is at the N-terminus of the protein and includes the helices denoted A and B (14). Helices B, C, E and F line a large hydrophobic crevice on the surface of the protein which is proposed to accommodate an, as yet, unknown protein ligand (14). There is no evidence that frequenin binds DNA and it might be that the HTH motif identified is involved in binding the proposed protein ligand.
Polymerases have a C-terminal domain with a characteristic architecture compared to that of a right hand, with ‘thumb’, ‘palm’ and ‘fingers’ sub-domains (15). They are known to bind DNA, with the nucleotide contacts made by residues in the fingers and palm sub-domains. No DNA-binding HTH motif has previously been identified in the polymerase structures. In the family representative PDB code 1taq [Taq DNA polymerase I (16)] the template scan matched the HTH template 1SMTA60-87 to residues 673–700 with an rmsd and an ASA that met the required thresholds. This region is in the ‘fingers’ sub-domain. An interesting finding was that Taq DNA polymerase I is also in the PDB (FALSE) data set with DNA bound at the polymerase active site [PDB code 1tau (17)], but there was no match with the HTH template library which met the required threshold values. The maximal superposition with the minimum rmsd was achieved at residues 673–700 with template 1SMTA60-87, but the rmsd was 1.39 Å. The DNA complexed polymerase I structure shows that DNA packs against the O α-helix (residues 656–671) in the fingers domain, with additional interactions with residues in the palm domain (17). The HTH at 673–700 directly precedes the O α-helix, but the short nature of the DNA bound (only 8 bp) means that no direct contacts between the predicted HTH in the bound protein and the nucleotide are observed. However, the position of the predicted HTH makes it likely that the HTH could make contacts with a full length DNA molecule. The differences in rmsd observed for template matches between the bound and the unbound protein highlight the difficulty of making allowances for changes in protein conformation on DNA binding.
The catalytic subunit of histone acetyltransferase (1fy7A) was identified as having a HTH motif that spanned residues 368–388 in the C-terminal domain. This protein acetylates histone H4, and is a member of the MYST family of histone acetyltransferases (18). Histones are a group of small proteins associated with nucleic acids in the chromatin of eukaryotic cells. Hence it is possible that this enzyme might also bind DNA. It is noted that there is a zinc finger fold in the N-terminal domain of this protein (18), which is known to mediate protein–DNA and protein–protein interactions. However, as histone acetyltransferase is believed to be part of a multiprotein complex, the zinc finger fold is interpreted as being involved in interactions with other proteins of the complex. This could also be true for the HTH motif. However, the potential DNA binding function of this HTH motif is supported by the inclusion of the C-terminal domain of 1fy7A in the SCOP database (19) in the family of N-acetyltransferases, with the added information that there is a ‘winged helix’ DNA-binding fold present. Hence it is predicted that histone acetyltransferase includes a DNA-binding HTH motif.
Methylguanine-DNA methyltransferase (MGMT) (1mgtA) was identified as having a HTH motif that spanned residues 110–129 in the C-terminal domain. This HTH motif includes the helices denoted ‘d’ and ‘e’ in the protein (20). Site-directed mutagenesis experiments of human MGMT suggest that these two helices interact with methylguanine-DNA (21). Hence it is predicted that this is a DNA-binding HTH motif, even though this secondary structure arrangement is referred to by the authors as a ‘helix–loop–helix motif’ (20).
Comparing E values from HMM searches with rmsd values from template scans
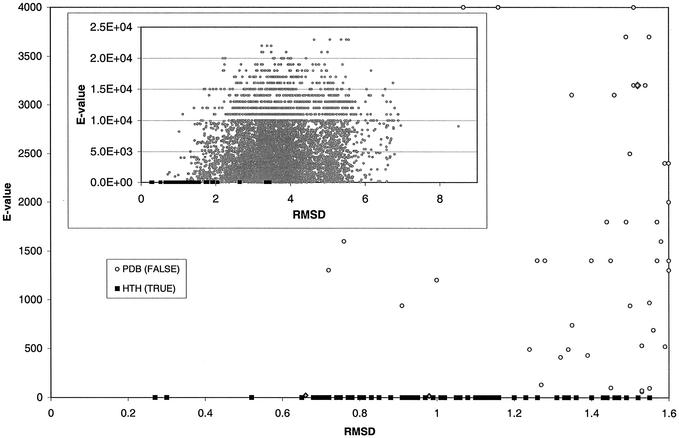
The minimum rmsd values obtained when extended templates were scanned against the PDB give a measure of the significance of a template fit against any single protein structure. When the HMMs were used to search the PDB using SAM-T99, the minimum E value for each protein, obtained from any of the 28 HMM models, was recorded. These E values give a measure of the significance of the hit by any one HMM. Comparing the minimum rmsd values from the structure scans with the minimum E values from the HMM sequence searches provides a means of comparing the structure based method with the sequence based method (Fig. 7). The main graph in this figure shows the false positive proteins with rmsd values <1.6 Å overlapping the distribution of the known HTH motifs but with significantly larger E values, since the HMM models for these proteins were not used in the sequence scans of the PDB. Interestingly, the two proteins predicted to contain DNA-binding HTH motifs from an analysis of the false positive proteins (1fya and 1mgt, shown as grey diamonds in Fig. 7) are the two false positive values with the smallest (but still not significant) E values (17 and 22, respectively).
Figure 7.
Scatter plot of E values derived from HMM scans of protein sequence against rmsd values from 3D extended motif scans of protein structure. The inset graph shows the distribution of rmsd values up to a maximum of 8.5 Å and E values to a maximum of 2.5E + 04 with values rounded to two significant figures as recorded in the results from SAM-T99. The main graphs show the distribution with rmsd values to a maximum of 1.6 Å and E values to a maximum of 4000. The data points for the 86 known HTH motifs (TRUE) are shown in filled black squares, those for the remaining PDB structures not known to contain DNA binding HTH motifs (FALSE) are shown as open grey circles. The filled grey diamonds indicate the two structures (1fy7A and 1mgtA) both predicted to include DNA-binding HTH motifs. These data are derived from the third scan of the PDB with seven non-homologous extended HTH motifs.
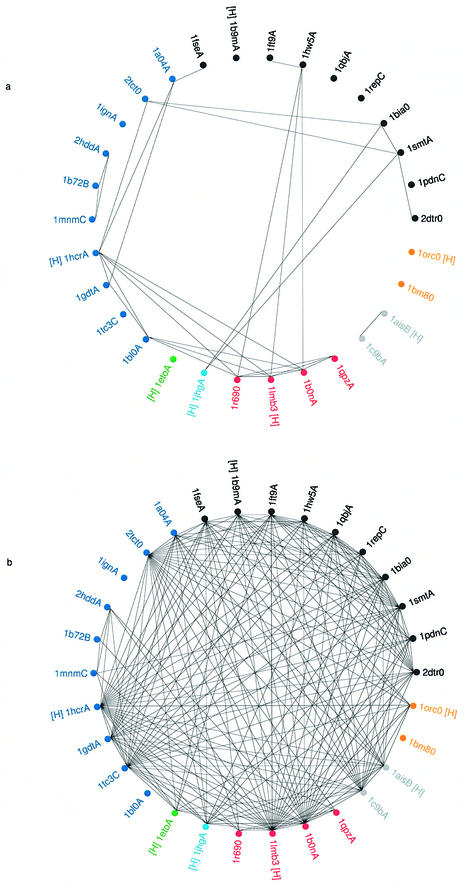
To make a quantitative comparison between the identification of HTH motifs using HMMs based on sequence and templates based on 3D structure, a series of searches were conducted using the 30 family representatives shown in Table 2. For the HTH searches based on sequence, each of the 30 representatives were associated with a given HMM (i.e. the HMM model created from the multiple sequence alignment of the protein family to which the representative belonged). The 30 representatives were associated with 22 different HMMs. Each HMM was then used to search the sequences of the same 30 representatives using SAM-T99. A successful HTH match was taken as an HMM matching a representative protein with an E value of <0.01. In this way it was possible to make a list of which representative proteins had HMMs that identified another representative. To illustrate the matches, the PDB codes of the 30 representatives were marked around a circle, and a match by an HMM of one representative against the sequence of another representative was indicated by a straight line joining the two PDB codes (Fig. 8a).
Figure 8.
(Previous page) Wheel diagrams depicting the identification of HTH motifs within a set of 30 sequence representatives. The PDB codes of the 30 proteins (identified in Table 2) are shown clustered into homologous families and the PDB codes in each family are shown in a different colour. The HREP from each family is indicated by a [H] printed next to each PDB code. Within each family the members are clustered according to CATH number (to the S-level) except where SREP proteins belong to the same Pfam family and are represented by the same HMM. In such cases the PDB codes sharing the same HMM are shown clustered together. (a) HTH identification using full sequence HMMs. A line joining two PDB codes indicates the successful match of one protein’s HMM against the sequence of the second protein. A successful match was taken as a HMM matching a representative sequence with an E value of <0.01. (b) HTH identification using structural templates. A line joining two PDB codes indicates the successful match of one structure’s template against the structure of the second protein. A successful match was taken as one where a maximal superposition gave a rmsd <1.6 Å.
A similar diagram was created for the 3D structural templates. Templates from the 30 representatives were matched, using the scan-rmsd algorithm, to the complete structures of the same 30 representatives. A successful identification was taken as one where a maximal superposition gave a rmsd <1.6 Å. To illustrate the matches, the PDB codes of the 30 representatives were marked around a circle, and the matches of one structure’s template against the structure of another representative was indicated by a straight line joining the two PDB codes (Fig. 8b).
Comparison of these two diagrams clearly shows that the HMMs are relatively specific, with one HMM model identifying relatively few of the 30 representatives from which they were derived. In contrast, one structural template can, in general, match many different representatives from different sequence families and different folds. The generic nature of the structural templates is of importance in the structural genomics projects. If a new structure is derived that contains a DNA-binding HTH motif that has no sequence or structural homologues, then, from these results, it is more likely that the motif will be identified by one of the generic 3D templates rather than one of the more specific HMMs.
Using templates on MCSG structural genomics targets
Each of the seven HTH+2 extended templates was scanned against 30 structures from the MCSG initiative (www.mcsg.anl.gov). One structure (target APS048) had a HTH motif matched at residues 21–44 by template 1LMB331-53 with a minimum rmsd of 1.3 Å and HTH ASA of 1695 Å2, and hence was predicted to have an HTH motif involved in DNA binding. This target, PDB code 1mkm, is the structure of Thermotoga maritima 0065, a member of the IcIR (isocitrate lyase regulator) transcriptional factor family (22). The protein was targeted in the structural genomics initiative as it has strong sequence similarity to other members of the IcIR family and no structural information was available. The structure has two domains, and the N-terminal domain has a DNA binding function, with a HTH motif comprising H2 and H3 with a 4 residue turn between them (22). This motif is the one matched by template 1LMB331-53 at positions 21–44 of the target.
DISCUSSION
This simple method of using 3D structural templates to make predictions about the potential DNA binding function of proteins has been validated using scans of complete proteins in the PDB, and then used to make predictions for structural genomics targets. The use of sequence templates such as those in PROSITE (23) has long been established as a means of predicting biological function in newly derived protein sequences. In addition, there have been many algorithms designed for mining protein sequences for structural motifs, based on the construction of consensus sequences and profiles (see, for example, 24,25). One recent example is GYM, an algorithm based around data mining and knowledge discovery techniques that detects motifs in protein sequences, and uses HTH motifs as a model system (26).
The use of structural templates in a similar predictive manner was pioneered for enzymes with catalytic triads. The TESS algorithm was implemented to derive consensus structural templates in the PROCAT database (27,28). However, such structural templates are sequentially discontinuous, unlike the HTH templates used in the current work, which are sequentially continuous. The TESS algorithm makes template searches and matches based on the geometric hashing paradigm (28). The current method extends this concept beyond enzyme catalytic sites and implements a very simple algorithm to calculate optimal superposition of a template on a complete protein structure, using sequential motifs based wholly on Cα coordinates. A more complex methodology that uses machine learning techniques to locate DNA-binding motifs using statistical models of structure has also recently been developed to address the same problem (H. M. McLaughlin and W. Berman, personal communication).
The importance of using structural templates lies in their ability to identify HTH motifs in structures from more than one homologous (fold) family. The generic nature of the structural templates is effectively demonstrated in the wheel diagram in Figure 8b. This clearly shows that templates can match HTH motifs from different sequence and different fold families within the designated threshold value. The ability to use a single structural motif to identify proteins across families will be invaluable for structural genomics projects. In these projects the targets are selected to have very low sequence identity to any currently in the PDB, and hence it likely that they will belong to a new sequence family and might have a new protein fold.
The current methodology will be a prototype for function predictions for proteins that recognise DNA with small contiguous structural motifs. The key element in the methodology was the use of extended templates that included two residues before the start and at the end of the HTH motif. In this way it was possible to reduce the false positives from 368 to 61. The inclusion of the ASA threshold value also contributed to the elimination of further false positives. The aim now is to repeat this success for other sequential DNA-binding motifs such as the helix–hairpin–helix, helix–loop– helix and ribbon–helix–helix. It will be necessary to calculate and validate new rmsd and ASA thresholds for each different motif. In this way it will be possible to scan a protein structure of unknown function with a library of many different types of motif in one single operation and make predictions about their presence or absence. Using the HTH motif templates as a prototype, a computer server has been constructed (http://www.ebi.ac.uk/thornton-srv/databases/DNA-motifs) that enables users to scan the uploaded coordinates of any 3D protein structure against the current template library. Further libraries will be added to this server as other DNA-binding motifs are extracted and validated.
Proteins bind DNA in many ways (see, for example, 29,30), including structures that do not use small compact motifs to recognise the DNA bases, but a large number of residues non-contiguous in sequence and in structure. The TATA box binding protein is just one example of this ‘large-scale’ DNA binding (31). In this structure a large number of residues in the curved β-sheet make contacts with the DNA molecule. To make functional predictions for this and similar proteins, it will be necessary to make spatial templates very similar to those used in PROCAT. A complete library of sequential and spatial DNA binding templates will provide a valuable tool for those making predictions of function from structure, a key element of the current structural genomics initiatives.
Acknowledgments
ACKNOWLEDGEMENTS
We would like to thank Professor Helen Berman for her contribution to the project. We also thank Roman Laskowski and James Watson for their help with the analysis of the MCSG structural genomics targets which were solved under a National Institutes of Health grant (GM62414). S.J. and I.N. were supported by a US Department of Energy grant (DE-FG02-96ER62166) and J.A.B. was supported by a UK MRC Training Fellowship in Bioinformatics.
REFERENCES
- 1.Berman H.M., Westbrook,J., Feng,Z., Gilliland,G., Bhat,T.N., Weissig,H., Shindyalov,I.N. and Bourne,P.E. (2000) The Protein Data Bank. Nucleic Acids Res., 28, 276–280. [DOI] [PMC free article] [PubMed] [Google Scholar]
- 2.Brennan R.G. and Matthews,B.W. (1989) The helix-turn-helix DNA-binding motif. J. Biol. Chem., 264, 1903–1906. [PubMed] [Google Scholar]
- 3.Beamer L.J. (1992) Refined 1.8 angstrom crystal-structure of the lambda-repressor operator complex. J. Mol. Biol., 227, 20. [DOI] [PubMed] [Google Scholar]
- 4.Luscombe N.M. and Thornton,J.M. (2002) Protein-DNA interactions: amino acid conservation and the effects of mutations on binding specificity. J. Mol. Biol., 320, 991–1009. [DOI] [PubMed] [Google Scholar]
- 5.Orengo C.A., Michie,A.D., Jones,S., Jones,D.T., Swindells,M.B. and Thornton,J.M. (1997) CATH – a hierarchic classification of protein domain structures. Structure, 5, 1093–1108. [DOI] [PubMed] [Google Scholar]
- 6.Bateman A., Birney,E., Cerruti,L., Durbin,R., Etwiller,E., Eddy,S.R., Griffiths-Jones,S., Howe,K.L., Marshall,M. and Sonnhammer,E.L.L. (2002) The Pfam protein families database. Nucleic Acids Res., 30, 276–280. [DOI] [PMC free article] [PubMed] [Google Scholar]
- 7.Hughey R. and Krogh,A. (1996) Hidden Markov models for sequence analysis: extension and analysis of the basic method. Comput. Appl. Biosci., 12, 95–107. [DOI] [PubMed] [Google Scholar]
- 8.Schultz J., Milpetz,F., Bork,P. and Ponting,C.P. (1998) SMART, a simple modular architecture research tool: identification of signalling domains. Proc. Natl Acad. Sci. USA, 95, 5857–5864. [DOI] [PMC free article] [PubMed] [Google Scholar]
- 9.Altschul S.F., Gish,W., Miller,W., Myers,E.W. and Lipman,D.J. (1990) Basic local alignmnet search tool. J. Mol. Biol., 215, 403–410. [DOI] [PubMed] [Google Scholar]
- 10.Thompson J.D., Gibson,T.J., Plewniak,F., Jeanmougin,F. and Higgins,D.G. (1997) The CLUSTAL_X windows interface: flexible strategies for multiple sequence alignment aided by quality analysis tools. Nucleic Acids Res., 25, 4876–4882. [DOI] [PMC free article] [PubMed] [Google Scholar]
- 11.Sayle R.A. and Milnerwhite,E.J. (1995) Rasmol – biomolecular graphics for all. Trends Biochem. Sci., 20, 374–376. [DOI] [PubMed] [Google Scholar]
- 12.Kabsch W. (1976) A solution for the best rotation to relate two sets of vectors. Acta Crystallogr. A, 32, 922–923. [Google Scholar]
- 13.Hubbard S.J. (1993) NACCESS. Department of Biochemistry and Molecular Biology, University College, London.
- 14.Bourne Y., Dannenberg,J., Pollmann,V., Marchot,P. and Pongs,O. (2001) Immunocytochemical localization and crystal structure of human frequenin (neuronal calcium sensor 1). J. Biol. Chem., 276, 11949–11955. [DOI] [PubMed] [Google Scholar]
- 15.Steitz T.A. (1999) DNA polymerases: structural diversity and common mechanisms. J. Biol. Chem., 274, 17395–17398. [DOI] [PubMed] [Google Scholar]
- 16.Kim Y., Eom,S.H., Wang,J.M., Lee,D.S., Suh,S.W. and Steitz,T.A. (1995) Crystal-structure of Thermus-aquaticus DNA-polymerase. Nature, 376, 612–616. [DOI] [PubMed] [Google Scholar]
- 17.Eom S.H., Wang,J.M. and Steitz,T.A. (1996) Structure of Taq polymerase with DNA at the polymerase active site. Nature, 382, 278–281. [DOI] [PubMed] [Google Scholar]
- 18.Yan Y., Barlev,N.A., Haley,R.H., Berger,S.L. and Marmorstein,R. (2000) Crystal structure of yeast Esa1 suggests a unified mechanism for catalysis and substrate binding by histone acetyltransferases. Mol. Cell, 6, 1195–1205. [DOI] [PubMed] [Google Scholar]
- 19.Murzin A.G., Brenner,S.E., Hubbard,T. and Chothia,C. (1995) Scop – a structural classification of Proteins Database for the investigation of sequences and structures. J. Mol. Biol., 247, 536–540. [DOI] [PubMed] [Google Scholar]
- 20.Hashimoto H., Inoue,T., Nishioka,M., Fujiwara,S., Takagi,M., Imanaka,T. and Kai,Y. (1999) Hyperthermostable protein structure maintained by intra and inter-helix ion-pairs in archaeal O-6-methylguanine-DNA methyltransferase. J. Mol. Biol., 292, 707–716. [DOI] [PubMed] [Google Scholar]
- 21.Goodtzova K., Kanugula,S., Edara,S. and Pegg,A.E. (1998) Investigation of the role of tyrosine-114 in the activity of human O-6-alkylguanine-DNA alkyltranferase. Biochemistry, 37, 12489–12495. [DOI] [PubMed] [Google Scholar]
- 22.Zhang R.G., Kim,Y., Skarina,T., Beasley,S., Laskowski,R., Arrowsmith,C., Edwards,A., Joachimiak,A. and Savchenko,A. (2002) Crystal structure of Thermotoga maritima 0065, a member of the IclR transcriptional factor family. J. Biol. Chem., 277, 19183–19190. [DOI] [PMC free article] [PubMed] [Google Scholar]
- 23.Bairoch A. (1992) Prosite – a dictionary of sites and patterns in proteins. Nucleic Acids Res., 20, 2013–2018. [DOI] [PMC free article] [PubMed] [Google Scholar]
- 24.Gribskov M., Luthy,R. and Eisenberg,D. (1990) Profile analysis. Methods Enzymol., 183, 146–159. [DOI] [PubMed] [Google Scholar]
- 25.Nevill-Manning C.G., Wu,T.D. and Brutlag,D.L. (1998) Highly-specific protein sequence motifs for genome analysis. Proc. Natl Acad. Sci. USA, 95, 5865–5871. [DOI] [PMC free article] [PubMed] [Google Scholar]
- 26.Narasimhan G., Bu,C., Gao,Y., Wang,X., Xu,N. and Mathee,K. (2002) Mining protein sequences for motifs. J. Comput. Biol., 9, 707–720. [DOI] [PubMed] [Google Scholar]
- 27.Wallace A.C., Laskowski,R.A. and Thornton,J.M. (1996) Derivation of 3D coordinate templates for searching structural databases: application to Ser-His-Asp catalytic triads in the serine proteinases and lipases. Protein Sci., 5, 1001–1013. [DOI] [PMC free article] [PubMed] [Google Scholar]
- 28.Wallace A.C., Borkakoti,N. and Thornton,J.M. (1997) TESS: a geometric hashing algorithm for deriving 3D coordinate templates for searching structural databases. Application to enzyme sites. Protein Sci., 6, 2308–2323. [DOI] [PMC free article] [PubMed] [Google Scholar]
- 29.Harrison S.C. (1991) A structural taxonomy of DNA-binding domains. Nature, 353, 715–719. [DOI] [PubMed] [Google Scholar]
- 30.Jones S., van Heyningen,P., Berman,H.M. and Thornton,J.M. (1999) Protein-DNA interactions: a structural analysis. J. Mol. Biol., 287, 877–896. [DOI] [PubMed] [Google Scholar]
- 31.Kim Y., Geiger,J.H., Hahn,S. and Sigler,P.B. (1993) Crystal structure of a yeast TBP/TATA-box complex. Nature, 365, 512–520. [DOI] [PubMed] [Google Scholar]


