Abstract
We have cloned the M and S genes of the restriction-modification (R-M) system AhdI and have purified the resulting methyltransferase to homogeneity. M.AhdI is found to form a 170 kDa tetrameric enzyme having a subunit stoichiometry M2S2 (where the M and S subunits are responsible for methylation and DNA sequence specificity, respectively). Sedimentation equilibrium experiments show that the tetrameric enzyme dissociates to form a heterodimer at low concentration, with Kd ≈ 2 µM. The intact (tetrameric) enzyme binds specifically to a 30 bp DNA duplex containing the AhdI recognition sequence GACN5GTC with high affinity (Kd ≈ 50 nM), but at low enzyme concentration the DNA binding activity is governed by the dissociation of the tetramer into dimers, leading to a sigmoidal DNA binding curve. In contrast, only non-specific binding is observed if the duplex lacks the recognition sequence. Methylation activity of the purified enzyme was assessed by its ability to prevent restriction by the cognate endonuclease. The subunit structure of the M.AhdI methyltransferase resembles that of type I MTases, in contrast to the R.AhdI endonuclease which is typical of type II systems. AhdI appears to be a novel R-M system with properties intermediate between simple type II systems and more complex type I systems, and may represent an intermediate in the evolution of R-M systems.
INTRODUCTION
In prokaryotes, methylation of specific sequences serves to protect the host DNA from cleavage by restriction enzymes encoded by the host restriction-modification (R-M) system, whilst allowing the cleavage of foreign DNA (1–3). It thus acts as a form of primitive immune system, protecting the bacterium from invasion by bacteriophage. Methylation occurs at either the cytosine C5 or at the N4 or N6 of adenine, the methyl group being donated by the cofactor S-adenosyl methionine (AdoMet).
Type I and type II R-M systems are readily distinguished. Classical type II systems are two-gene systems, with one gene for each activity; a gene for DNA methylation (M), which codes for a monomeric protein, and a quite unrelated gene for restriction (R), which produces a homodimeric enzyme. For both activities, the DNA recognition sequence is identical: a symmetrical (self-complementary) sequence of, typically, six adjacent base pairs. Type II MTases have two structural domains: the DNA sequence specificity is provided by a target recognition domain (TRD) and methylation activity is found on a separate AdoMet binding domain within the same subunit.
In contrast type I systems consist of three genes. Two genes are required for DNA methylation activity (M and S), the subunits combining to form a trimeric MTase (M2S) (4–6). An additional gene is required for restriction (R), the three genes together coding for the pentameric endonuclease (R2M2S) (7–9). Type I systems recognise an asymmetrical DNA sequence (typically ∼13–15 bp) in which the two recognition sites are separated by a non-specific ‘spacer’, 6–8 bp long. The specificity of DNA binding is conferred by the two TRDs of the S subunit, each binding a ‘half-site’ within the DNA recognition sequence (10,11). This locates the two recognition sites approximately one helical turn apart on the DNA.
The discovery of the restriction system AhdI suggested the possibility of a new class of R-M system (type 1½) that combines properties of both type I and type II systems (12). As in type II systems, the AhdI endonuclease is encoded by a single gene; on the other hand, AhdI is typical of type I systems in having two genes resembling the M and S genes that in type I systems are required for assembly of the active MTase. Both M and S genes are required for AhdI methylation activity (G. Wilson et al., manuscript in preparation). Moreover, although (like type I systems) the AhdI DNA recognition sequence is bipartite (GACN5GTC), it has rotational symmetry characteristic of the recognition site of classical type II systems.
There have been no studies reported on the AhdI methyltransferase to date. Here we report the expression and purification of the methyltransferase M.AhdI and characterisation of the purified enzyme in terms of subunit structure, DNA binding affinity and enzyme activity.
MATERIALS AND METHODS
Expression and purification of M.AhdI
Escherichia coli JM109 (DE3) cells containing either the pET11a plasmid containing the specificity (S) subunit gene or the pMTYB1 plasmid containing the methylation (M) subunit gene were grown at 30°C in 2× YT broth until an OD600 = 0.6 was obtained. The cells were then induced with 1 mM isopropyl β-d-thiogalactopyranoside and grown for 3 h. The cells were harvested by centrifugation and the pellets stored at –20°C until required.
The cell pellets were resuspended in 0.1 M NaCl, 50 mM Tris–HCl pH 8.2, 5 mM EDTA, 5 mM dithiothreitol (DTT), 1 mM benzamidine, 0.1 mM phenylmethylsulphonyl fluoride and the M and S cell pastes were mixed in a ratio of 1 l cell culture of S subunit to 3 l of M subunit, this ratio having been found in earlier experiments to give the optimum yield of MTase. Lysis was achieved by sonication at 4°C and the insoluble debris was removed by centrifugation at 48 000 g.
The soluble cell lysate was made to 1 M NaCl in a 30% saturated solution of (NH4)2SO4 and the precipitated protein was sedimented by centrifugation at 17 000 g. The protein pellet was solubilised in loading buffer (0.1 M NaCl, 50 mM Tris–HCl pH 8.2, 5 mM EDTA, 1 mM DTT) and subsequently bound to a heparin affinity column. Once a baseline had been reached, a linear 0.1–0.5 M NaCl gradient in loading buffer was used to elute the target protein. A dialysis step back to loading buffer was followed by final purification using a 24 ml Superose 12HR size exclusion column.
The extinction coefficient of the MTase was calculated to be 47 000 M–1 cm–1 for the MS dimer (94 000 M–1 cm–1 for the M2S2 tetramer) by summing the contributions from the aromatic amino acids in the M and S subunits.
End-labelling of DNA
Oligonucleotides containing the sequences for DNA binding analysis of M.AhdI were annealed to form DNA duplex. The DNA concentration for each duplex was then calculated by the summation of the nucleotide extinction coefficient and the percentage hyperchromicity estimated using phosphodiesterase digestion of the duplex. Aliquots of 10 µM duplex DNA were mixed with 50 U T4 polynucleotide kinase and 100 µCi of [γ-32P]ATP. The reaction was incubated at 37°C for 30 min before being supplemented with 1 mM dATP and incubated for a further 30 min. The DNA duplex was purified using the QIAquick™ Nucleotide Removal Kit (Qiagen).
Gel retardation analysis
Gel retardation experiments were performed using non-denaturing gel electrophoresis. The M.AhdI was incubated at various concentrations with radiolabelled DNA duplex at 4°C for a period of 20 min. The samples were then loaded onto a 5% native polyacrylamide gel. After electrophoresis for an appropriate time, the gels were dried and visualised using a phosphorimager screen. The fraction of bound DNA in each lane was determined using ImageQuant software.
The following 30 bp oligonucleotide duplexes were used, containing (i) the intact AhdI site, (ii) one half-site and (iii) no half-sites, respectively. Each half-site of the specific sequence is shown in bold. Duplexes of 20 and 60 bp containing the specific DNA recognition sequence were also prepared.
(i) CCCTGAATTCGACGTGTAGTCAAGCTTCAC
GGGACTTAAGCTGCACATCAGTTCGAAGTG
(ii) CCCTGAATTCGACGTGTACAGAAGCTTCAC
GGGACTTAAGCTGCACATGTCTTCGAAGTG
(iii) CCCTGAATTCCTGGTGTACAGAAGCTTCAC
GGGACTTAAGGACCACATGTCTTCGAAGTG
Light scattering
Dynamic light scattering was carried out on a series of methylase concentrations at ambient temperature using a Polymer Labs PDDLS/batch molecular size analysis system. From the resulting hydrodynamic radius Rh an estimate of the molecular weight of the multisubunit complex was obtained using the empirical relationship for typical globular proteins, M = (1.55 × Rh)2.43. Rayleigh light scattering was performed using the Polymer Labs PD2010 laser light scattering detector connected to a Superose 12HR size exclusion column and UV detector.
In vitro methylation assay
Linear pUC19 plasmid was obtained by EcoRI digestion and used as the substrate for the methylation reaction. The methylation reaction was set up with the M.AhdI enzyme (1 nM) in 10 mM HEPES pH 8, 10 mM MgCl2, 1 mM DTT, 200 µM AdoMet, 0.2 mg ml–1 BSA, before addition of the linearised pUC19 plasmid DNA (20 nM). Samples were removed at various times during the reaction and heat-inactivated at 80°C for 20 min. Each time point sample was then challenged with the endonuclease R.AhdI (5 U, 3 h incubation at 37°C) and run on a 1% agarose gel. Following ethidium bromide staining, the ratio of methylated to unmethylated DNA was quantified using the GelDoc system (Bio-Rad).
Analytical ultracentrifugation
A Beckman Optima XL-A analytical ultracentrifuge (Beckman-Coulter, Palo Alto, CA) was used for both sedimentation equilibrium and sedimentation velocity experiments. For the sedimentation velocity experiment a standard double sector cell with 12 mm optical path length was used and filled with 400 µl of solution and 410 µl of solvent/buffer in the respective sectors. The cell was loaded into an An-60 analytical rotor and equilibrated to temperature (20°C) before acceleration to 45 000 r.p.m. Upon reaching speed, scans of absorbance at 280 nm versus radial displacement were taken at intervals of 80 s at a resolution of 0.005 cm.
The sedimentation equilibrium experiment was performed in 6-channel cells of 12 mm optical path, using 70 µl of solution at protein concentrations between 0.6 and 19.4 µM. An aliquot of 75 µl of solvent/buffer was loaded into the corresponding channel. The rotor was accelerated and scans of absorbance versus radial displacement were taken at a resolution of 0.001 cm and at intervals of 2–4 h. Sediment ation equilibrium was deemed to have been achieved when there was no change in concentration distribution for a period of at least 4 h. This was performed for rotor speeds of 8000, 12 000 and 20 000 r.p.m.
RESULTS
Sub-cloning, expression and purification
Co-expression of the S and M subunits of M.AhdI could not be achieved in a single expression construct (13). For this reason the two subunits were expressed in separate bacterial cell cultures. The S subunit gene was sub-cloned into the pET11a expression vector. Problems were encountered with plasmid stability and cell toxicity, but with careful culturing at 30°C significant soluble expression could be achieved. The M subunit expression clones were much more stable and less toxic to the cell, although it was rather more difficult to produce soluble target protein from them. The M subunit gene was sub-cloned into a series of different expression vectors (pTYB1, pTYB11, pET11a and pET42a). Optimal expression of soluble protein was found using pTYB1 when grown at 30°C. The expression vectors chosen for the M and S subunits both produce unfused proteins, thus avoiding any possible problems caused by additional protein sequences at the N- or C-termini when forming the multisubunit complex (14).
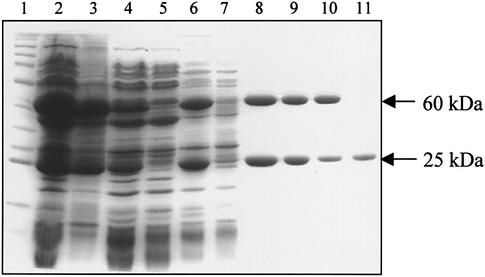
Trial experiments showed that higher yields of M.AhdI were produced by mixing crude cell extracts from the M and S expression systems, rather than reconstitution of the enzyme from its purified subunits (13). The bacterial cell pastes for the S and M subunits were mixed before lysis to form the M.AhdI enzyme. The subsequent soluble cell extract was fractionated using ammonium sulphate precipitation to remove contaminating bound DNA from the M.AhdI. The precipitation was followed by heparin affinity chromatography, which resulted in relatively pure M.AhdI but with some free S subunit also present since this elutes at a similar salt concentration. A final step using size exclusion chromatography was required to separate M.AhdI from the free S subunit contaminating the peak on the heparin column (Fig. 1). Reapplication of this sample to the gel filtration column confirmed that it elutes as a single species, and no peak corresponding to free S subunit was observed on subsequent runs.
Figure 1.
Purification of M.AhdI. SDS gel electrophoresis showing the purification of the methylase complex. Lane 1, molecular weight marker; lane 2, mixed cell lysates; lane 3, insoluble fraction; lane 4, soluble fraction; lane 5, supernatant after ammonium sulphate precipitation. Lanes 6–8, heparin column; lane 6, sample loaded; lane 7, run-through; lane 8, pooled fractions. Lanes 9–11, gel filtration; lane 9, sample loaded; lane 10, methylase peak; lane 11, S subunit peak.
M.AhdI stoichiometry
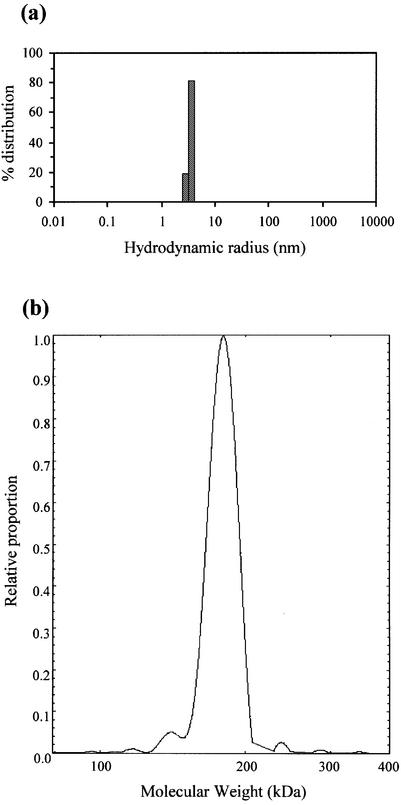
The purified M.AhdI MTase was applied to a calibrated Superose 12 gel filtration column to give an estimate of the size of the multisubunit enzyme. When loaded at 100 µM concentration, the enzyme elutes in a single peak with an apparent molecular mass of 154 kDa with respect to molecular weight markers. When loaded at lower concentrations (5 and 20 µM), the enzyme also elutes as a single peak, but with a slightly lower estimated molecular weight (144–147 kDa). Dynamic light scattering measurements (Fig. 2a) indicated a hydrodynamic radius of 5.4 nm, from which a molecular mass of 175 kDa is estimated by comparison with typical globular proteins. This is in reasonable agreement with the calculated Mr for the heterotetramer M2S2 of 170 398 Da, based on the calculated Mr of the S and M subunits (25 422 and 59 777 Da, respectively). However, both these techniques are unable to separate out the effects of size and shape if the molecule is elongated. Static (Rayleigh) light scattering, in contrast, gives an absolute molecular mass that is independent of the shape of the molecule. We therefore carried out on-line light scattering experiments in which the purified enzyme was loaded on a Superose 12 size exclusion column and the eluant monitored by laser light scattering. This technique gave a molecular weight of 179 kDa for M.AhdI (Fig. 2b).
Figure 2.
(a) Dynamic light scattering of the M.AhdI enzyme at a concentration of 4 µM. (b) Rayleigh light scattering data obtained from analysis of the elution profile of the M.AhdI enzyme from a Superose 12 size exclusion column.
Analytical centrifugation
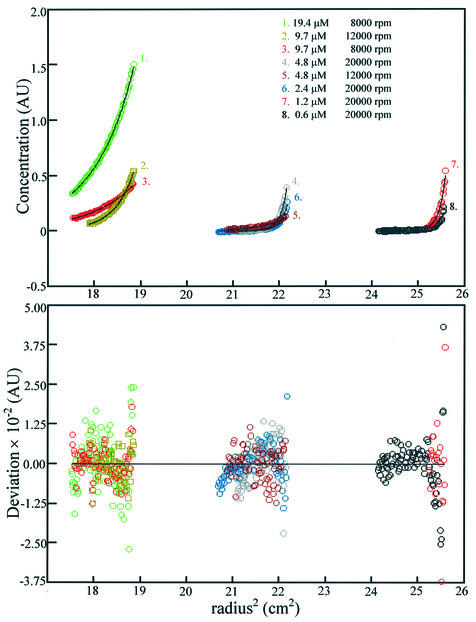
Analytical ultracentrifugation was used to further characterise the behaviour of the multisubunit enzyme. Sedimentation equilibrium can yield information on concentration-dependant oligomerisation. M.AhdI was therefore sedimented to equilibrium over the concentration range 0.6–19.4 µM, using three different rotor speeds, and the data analysed globally using the least squares fitting program Nonlin (v. 1.06). The data could not be fitted to a single species model or to a two component independent species model. However, a good fit was obtained using a dimer–tetramer equilibrium model, with molecular weights of 85 and 170 kDa, respectively, from which the dissociation constant Kd = 2.2 µM was obtained (Fig. 3).
Figure 3.
Sedimentation equilibrium. The top graph shows the sedimentation equilibrium data for the methyltransferase at a series of different concentrations and rotor speeds. Each data set has been fitted with a global model to describe the data and is shown by the black line, with the residuals to the fit plotted below. The model is of two heterodimers of 85 kDa self-associating to form a tetramer of 170 kDa.
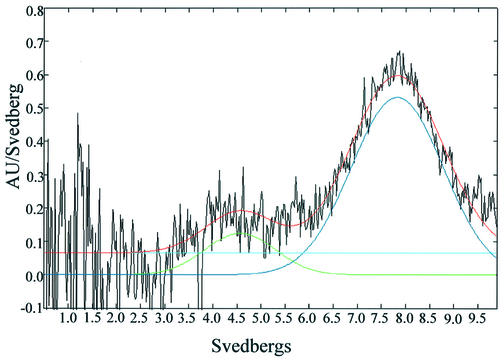
Sedimentation velocity experiments were then carried out on the purified MTase. From analysis of the sedimentation profiles using the DCDT algorithm (15) two components were observed, a major component with S20,w = 7.8 S and a minor component with S20,w =4.6 S. Assuming the faster sedimenting species corresponds to M2S2 and the slower one to MS, using the molecular weights of these species one can calculate frictional ratios (f/fo) of 1.34 and 1.43, respectively. This indicates that both species are somewhat elongated, although the tetramer is more compact than the dimer, suggesting that dimers associate in a side-by-side manner, rather than end-to-end, when forming the tetramer.
DNA binding studies
Gel retardation assays were carried out using a 30 bp oligonucleotide containing the AhdI DNA recognition site, GACN5GTC. The M.AhdI–DNA binding interaction was optimised for binding buffer conditions, varying the pH from 6.8 to 9.0, the salt concentration from 0 to 200 mM NaCl and with the addition of various concentrations of MgCl2, ATP and AdoMet. The variety of conditions tested resulted in no discernable differences in the gel retardation patterns between the different binding buffers or the presence of MgCl2, ATP and AdoMet (data not shown).
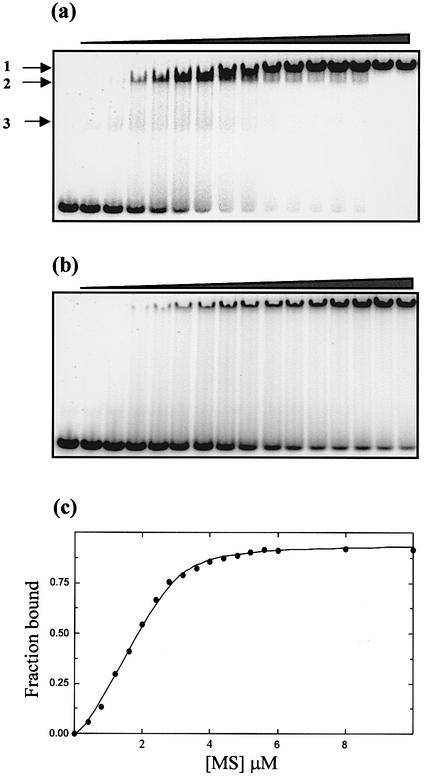
Titration of M.AhdI with the specific 30 bp oligonucleotide shows the presence of up to three complexes. At the lower protein concentrations, there is a clear complex band and a much fainter diffuse band (Fig. 5a, bands 2 and 3, respectively). These most likely correspond to binding the M2S2 tetramer and the MS heterodimer, respectively, and are only seen with the specific duplex (see below). At higher concentrations of protein (well above the stoichiometric point), a supershifted complex is seen (band 1). Since this band is also seen at an equivalent point in the titration with the non-specific duplex (see below), it is likely to represent multiple protein molecules bound non-specifically to the DNA when there is a significant excess of protein.
Figure 5.
Gel retardation assay. Increasing concentrations of M.AhdI (0–6 µM, in 0.4 µM steps) were incubated with a 30 bp duplex probe containing (a) the AhdI recognition sequence and (b) a non-specific sequence, both at a concentration of 1 µM, prior to electrophoresis on a native 6% acrylamide gel. (c) The fraction of bound DNA from experiment (a) is plotted against the total M.AhdI concentration (expressed as monomer). The data were then fitted to a model that allows for dissociation of the tetramer into dimers (see text). The fitted curve corresponds to values of K1 = 1 µM and K2 = 50 nM.
Gel retardation assays were also carried out using 20, 30 and 60 bp DNA duplexes bearing the AhdI recognition site. Similar binding characteristics were seen for the 30 and 60 bp duplexes, but much weaker binding to the 20 bp DNA was observed resulting in substantial smearing down the track (data not shown). This indicates that there are interactions outside the 11 bp recognition site that stabilise the protein–DNA complex. Further DNA duplexes, with alterations to the recognition site, were used to check the specificity of the protein–DNA interaction. Binding to a 30 bp duplex lacking the recognition site (Fig. 5b) resulted in a large reduction in binding affinity so that specific complex formation (band 2) was not apparent, although the slow migrating complex (band 1) was present at the higher protein concentrations, which we attribute to non-specific binding of multiple copies of the enzyme. An identical result was seen using a 30 bp duplex bearing one half-site from the AhdI recognition sequence. Gel retardation assays using a non-specific 30 bp duplex in competition with the 30 bp duplex containing the recognition sequence showed that the former did not effectively compete for binding, even when present in a 25:1 excess (data not shown).
Quantitation of the gel retardation assay using the 30 bp duplex containing the recognition sequence allowed the binding curve for M.AhdI to be fitted (Fig. 5c). The curve is sigmoidal, indicative of cooperative binding, and could not be fitted by the standard single site binding model. This would be expected if the active binding species is the tetramer, since this will dissociate at low concentrations. The band that we suggest arises from the MS heterodimer binding to DNA is extremely weak, and to a good approximation this interaction can be ignored. Using a cooperative binding model which allows for the formation of M2S2 from MS dimers (with dissociation constant K1) and assuming only the tetrameric species is capable of binding to DNA (with dissociation constant K2), the best fit was obtained with K1 = 1 µM and K2 = 50 nM.
Enzyme activity
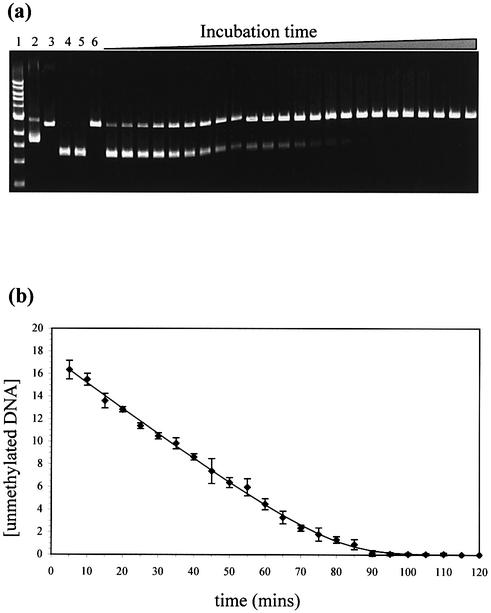
An enzyme assay for M.AhdI was devised, based on the ability of the MTase to methylate the AhdI recognition sequence and thus prevent cleavage by the cognate endonuclease, R.AhdI. The extent of methylation at a given time can be assessed by the inhibition of endonuclease activity, which in the absence of methylation results in the cleavage of the linearised 2686 bp plasmid into two fragments of almost equal length (1298 and 1388 bp), which can be visualised by agarose gel electrophoresis (Fig. 6a). Further experiments showed that the methylation reaction is dependent on the presence of both AdoMet and Mg2+ ions, and is inhibited by EDTA. Figure 6b shows a time course of the methylation reaction. This curve can be fitted using the integrated form of the Michaelis– Menton equation, from which values for Km for the DNA substrate (1.4 nM) and Vmax (0.25 nM min–1) were estimated, the latter providing an estimate of kcat (4.2 × 10⁻³ s–1). However, these must be regarded as provisional values, pending a more detailed enzyme kinetic analysis.
Figure 6.
Methylation assay. (a) Protection from R.AhdI endonuclease indicates methylation of the plasmid by M.AhdI. Lane 1, 1 kb marker; lane 2, uncut plasmid; lane 3, linearised plasmid; lane 4, linearised plasmid cut with R.AhdI; lane 5, linearised plasmid challenged with R.AhdI after incubation with heat killed M.AhdI; lane 6, linearised plasmid challenged with R.AhdI after incubation with native M.AhdI; lanes 7–30, time course of methylation with samples taken every 5 min. (b) Enzyme progression curve, showing the concentration of unmethylated DNA (nM) against incubation time with the M.AhdI enzyme. The data have been fitted to the integrated form of the Michaelis–Menten equation.
DISCUSSION
The results of the analytical centrifugation experiments show that M.AhdI exists as a 170 kDa tetrameric enzyme (M2S2) which dissociates into two heterodimers of the form MS at low concentration. Gel retardation analysis indicates that only the tetrameric form binds to DNA with high affinity. Thus in the intact enzyme, two copies of the AhdI S subunit combine with two M subunits (Fig. 7) to form a symmetrical tetrameric methyltransferase (M2S2), the naturally occurring equivalent of the structure proposed for deletion mutants of classical type I enzymes (16–18). The organisation of the subunits of M.AhdI is thus comparable with that resulting from a combination of the native M subunit of the EcoR124I R-M system with the N-terminal half of the S subunit of EcoR124I (denoted S3) and shows similar characteristics to the engineered enzyme. The (S3/M)2 enzyme also methylates a symmetrical recognition sequence (in this case GAAN7TTC) and dissociates at low concentration, resulting in a sigmoidal DNA binding curve resembling that observed for M.AhdI (19).
Figure 7.
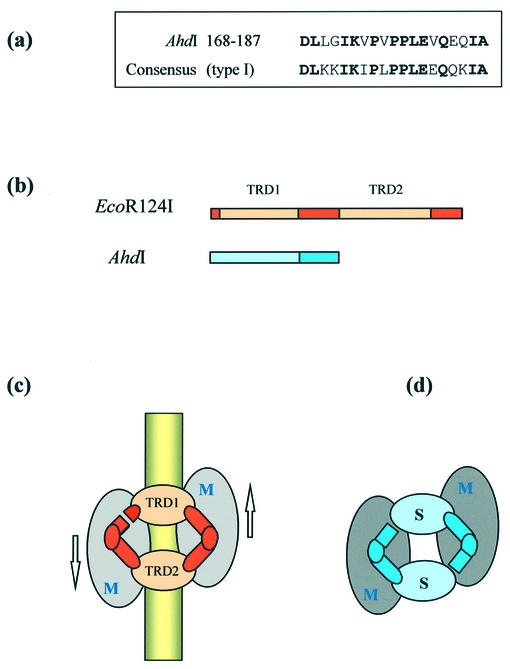
(a) Sequence alignment of residues 168–187 of the S subunit of AhdI and the consensus sequence found at the start of the central conserved region of all type I S subunits. (b) Comparison of the sequences of the S subunits of a type I MTase (EcoR124I) and AhdI. Conserved sequences (darker colours) are repeated in type I S subunits and include a limited region of sequence homology shared by all type I MTases. TRDs (lighter colours) responsible for recognition of DNA half-sites are unrelated in sequence. (c) Circular model for the subunit/domain structure of type I enzymes of the form M2S1 [adapted from Kneale (6)], showing the approximate two-fold symmetrical disposition of subunits and the orientation of the enzyme on the DNA. (d) Proposed symmetrical model (M2S2) for M.AhdI.
The Kd for DNA binding of M.AhdI (50 nM) is a little higher than that reported for the (S3/M)2 complex (Kd = 5 nM) and other type I enzymes such as EcoKI and EcoR124I (Kd ≈ 10 nM), but is nevertheless at the lower end of the range of Kd values typical for MTases binding sequence-specifically to oligonucleotide duplexes (10–6–10–9 M). It should be borne in mind, however, that dissociation of the tetrameric AhdI MTase into heterodimers means in practice that the effective DNA binding affinity is substantially lower than would be predicted from the Kd for the tetramer–DNA interaction.
The Km (for its DNA substrate) of M.AhdI (1.4 nM) is much lower than that reported for the type I MTase M.EcoKI (880 nM) (1) and is closer to the Km reported for the type II MTase M.EcoRI (0.3–1.3 nM) (20,21). Likewise the value of the catalytic rate constant, kcat, for M.AhdI (4.2 × 10⁻³ s–1) is intermediate between that of M.EcoRI (0.014–0.053 s–1) (20,21) and M.EcoKI (2 × 10⁻⁴ s–1). Caution should be exercised in interpreting these results, since the enzyme kinetic experiments are often conducted under different solution conditions and using different length DNA substrates (varying from short oligonucleotide duplexes to plasmids). It will also be apparent that if dissociation of the enzyme affects DNA binding, it should reduce the rate of DNA methylation at low enzyme concentrations. Since the enzyme assay is performed at a concentration (1 nM) well below the Kd (∼1 µM) for dissociation of the enzyme, this is likely to affect the activity of M.AhdI. In the bacterial cell, it has been estimated that MTase levels are likely to be in the region of 50–500 nM (1) and thus dissociation of M.AhdI is likely to occur in the cell, unless macromolecular exclusion effects prevail.
AhdI may represent an evolutionary intermediate between type I and type II R-M systems. Indeed, searching the sequence database (using BLASTP) shows that there is significant homology between the M subunit of AhdI and the type II methyltransferase XmnI (as well as to several type I systems); a similar search with the S subunit of AhdI shows significant similarity only to the S subunits of type I enzymes. Even so, in both cases the homology is rather limited.
The S subunit of AhdI has a short sequence of ∼20 amino acids (amino acids 168–187) that is clearly related to the sequence found at the start of the central conserved region of all type I S subunits (Fig. 7a), with 63% identity (79% similarity) to the consensus sequence at this site. However, there are no extensive sequence similarities of the sort commonly found between members of the same family. The S subunit of AhdI would appear to comprise a single N-terminal TRD (approximately amino acids 1–167) responsible for recognition of the trinucleotide half-site GAC and a single domain (approximately amino acids 168–227) that is equivalent to the ‘conserved’ domain of type I enzymes and is therefore presumed to interact with the M subunit (22). These features in the sequence of the S subunit of AhdI, together with the symmetrical DNA recognition sequence and the observed stoichiometry of the intact AhdI Mtase, suggest that the AhdI S subunit is equivalent to one half of a type I specificity subunit (Fig. 7b and c).
It is likely that AhdI represents a primitive type I MTase having a single TRD, from which more complex type I enzymes evolved by gene duplication and fusion. Further evolution of different specificities may then have arisen by ‘shuffling’ of TRDs on a scaffold of ‘conserved’ regions, a process that can also be engineered in vitro (11,23).
Figure 4.
Sedimentation velocity. Sedimentation velocity data were recorded for a 1.2 µM methyltransferase solution. The data were analysed to give a sedimentation coefficient distribution curve (black line) and were fitted to a two species model (S = 4.57 and 7.82). The sum of the two species is shown by the red line and an offset baseline shown in blue.
Acknowledgments
ACKNOWLEDGEMENTS
We thank Dr Darren Mernagh for advice and discussion during the earlier stages of this project and Polymer Laboratories for generous provision of laser light scattering facilities. The work was supported by a research grant from the Wellcome Trust and a PhD studentship from the Institute of Biomedical and Biomolecular Sciences, University of Portsmouth.
REFERENCES
- 1.Dryden D.T.F. (1999) Bacterial DNA methyltransferases. In Cheng,X. and Blumenthal,R.M. (eds), S-adenosyl Methionine Dependent Methyltransferases: Structure and Function. World Scientific Publishing, New York, NY, pp. 283–340.
- 2.Murray N.E. (2000) Type I restriction systems: sophisticated molecular machines. Microbiol. Mol. Biol. Rev., 24, 412–434. [DOI] [PMC free article] [PubMed] [Google Scholar]
- 3.Hornby D.P. (1993) DNA methyltransferases. In Methods in Molecular Biology, Vol. 16: Enzymes of Molecular Biology. Humana Press, Totowa, NJ.
- 4.Taylor I., Patel,J., Firman,K. and Kneale,G.G. (1992) Purification and biochemical characterisation of the EcoR124 type I modification methylase. Nucleic Acids Res., 20, 179–186. [DOI] [PMC free article] [PubMed] [Google Scholar]
- 5.Dryden D.T.F., Cooper,L.P. and Murray,N.E. (1993) Purification and characterization of the methyltransferase from the Type-1 restriction and modification system of E.coli K12. J. Biol. Chem., 268, 13228–13236. [PubMed] [Google Scholar]
- 6.Kneale G.G. (1994) A symmetrical model for the domain structure of Type I DNA methyltransferases. J. Mol. Biol., 243, 1–5. [DOI] [PubMed] [Google Scholar]
- 7.Mernagh D.R., Janscak,P., Firman,K. and Kneale,G.G. (1998) Protein-protein and protein-DNA interactions in the Type I restriction endonuclease R.EcoR124I. Biol. Chem., 379, 497–504. [DOI] [PubMed] [Google Scholar]
- 8.Janscak P., Dryden,D.T.F. and Firman,K. (1998) Analysis of the subunit assembly of the type IC restriction-modification enzyme EcoR124I. Nucleic Acids Res., 26, 4439–4445. [DOI] [PMC free article] [PubMed] [Google Scholar]
- 9.Dryden D.T., Cooper,L.P., Thorpe,P.H. and Byron,O. (1997) The in vitro assembly of the EcoKI type I DNA restriction/modification enzyme and its in vivo implications. Biochemistry, 36, 1065–1076. [DOI] [PubMed] [Google Scholar]
- 10.Cowan G.M., Gann,A.A.F. and Murray,N.E. (1989) Conservation of complex recognition domains between families of restriction enzymes. Cell, 56, 103–109. [DOI] [PubMed] [Google Scholar]
- 11.Gubler M., Braguglia,D., Meyer,J. Piekarowitz,A. and Bickle,T.A. (1992) Recombination of constant and variable modules alters DNA sequence recognition by Type IC restriction-modification enzymes. EMBO J., 11, 233–240. [DOI] [PMC free article] [PubMed] [Google Scholar]
- 12.Cui T., Lunnen,K., Chang,Z., Morgan,R., Nwanko,D., Slatko,B. and Wilson,G. (1997) Type 1 1/2 R-M systems. In Proceedings of the 4th NEB Workshop on Biological DNA Modification, Igls, Tyrol, Austria.
- 13.Marks P. (2001) Cloning expression and characterisation of the novel DNA methyltransferase, M.AhdI. PhD thesis, University of Portsmouth, Portsmouth, UK.
- 14.Mernagh D.R., Reynolds,L.A. and Kneale,G.G. (1997) DNA binding and subunit interactions in the type I methyltransferase M.EcoR124I. Nucleic Acids Res., 25, 987–991. [DOI] [PMC free article] [PubMed] [Google Scholar]
- 15.Philo J.S. (2000) A method for directly fitting the time derivative of sedimentation velocity data and an alternative algorithm for calculating sedimentation coefficient distribution functions. Anal. Biochem., 279, 151–163. [DOI] [PubMed] [Google Scholar]
- 16.Abadjieva A., Patel,J., Webb,M., Zinkevich,V. and Firman,K. (1993) A deletion mutant of the type 1C restriction endonuclease EcoR124I expressing a novel DNA specificty. Nucleic Acids Res., 21, 4435–4443. [DOI] [PMC free article] [PubMed] [Google Scholar]
- 17.Meister J., MacWilliams,M., Hubner,P., Jutte,H., Skrzypek,E., Piekarowicz,A. and Bickle,T.A. (1993) Macroevolution by transposition: drastic modification of DNA recognition by a type I restriction enzyme following Tn5 transposition. EMBO J., 12, 4585–4591. [DOI] [PMC free article] [PubMed] [Google Scholar]
- 18.Smith M.A., Mernagh,D.R. and Kneale,G.G. (1998) Expression and characterisation of the N-terminal fragment of the HsdS subunit of M.EcoR124I. Biol. Chem., 379, 505–510. [DOI] [PubMed] [Google Scholar]
- 19.Smith M., Read,C.M. and Kneale,G.G. (2001) Domain structure and subunit interactions in the type I DNA methyltransferase M.EcoR124I. J. Mol. Biol., 314, 41–50. [DOI] [PubMed] [Google Scholar]
- 20.Rubin R.A. and Modrich,P. (1977) EcoRI methylase: physical and catalytic properties of the homogenous enzyme. J. Biol. Chem., 252, 7265–7272. [PubMed] [Google Scholar]
- 21.Reich N.O. and Mashhoon,N. (1991) Kinetic mechanism of EcoRI DNA methyltransferase. Biochemistry, 30, 2933–2929. [DOI] [PubMed] [Google Scholar]
- 22.Cooper L.P. and Dryden,D.T.F. (1994) The domains of a type I DNA methyltransferase: interactions and role in recognition of DNA methylation. J. Mol. Biol., 236, 1011–1021. [DOI] [PubMed] [Google Scholar]
- 23.Janscak P. and Bickle,T.A. (1998) The DNA recognition subunit of the type IB restriction-modification enzyme EcoAI tolerates circular permutations of its polypeptide chain. J. Mol. Biol., 284, 937–948. [DOI] [PubMed] [Google Scholar]


