


Abstract
We have developed a novel multiplex quantitative DNA array based PCR method (MQDA-PCR). The MQDA-PCR is general and may be used in all areas of biological science where simultaneous quantification of multiple gene targets is desired. We used quantification of transgenic maize in food and feed as a model system to show the applicability of the method. The method is based on a two-step PCR. In the first few cycles bipartite primers containing a universal 5′ ‘HEAD’ region and a 3′ region specific to each genetically modified (GM) construct are employed. The unused primers are then degraded with a single-strand DNA-specific exonuclease. The second step of the PCR is run containing only primers consisting of the universal HEAD region. The removal of the primers is essential to create a competitive, and thus quantitative PCR. Oligo nucleotides hybridising to internal segments of the PCR products are then sequence specifically labelled in a cyclic linear signal amplification reaction. This is done both to increase the sensitivity and the specificity of the assay. Hybridisation of the labelled oligonucleotides to their complementary sequences in a DNA array enables multiplex detection. Quantitative information was obtained in the range 0.1–2% for the different GM constructs tested. Seventeen different food and feed samples were screened using a twelve-plex system for simultaneous detection of seven different GM maize events (Bt176, Bt11, Mon810, T25, GA21, CBH351 and DBT418). Ten samples were GM positive containing mainly mixtures of Mon810, Bt11 and Bt176 DNA. One sample contained appreciable amounts of GA21. An eight-plex MQDA-PCR system for detection of Mon810, Bt11 and Bt176 was evaluated by comparison with simplex 5′ nuclease PCRs. There were no significant differences in the quantifications using the two approaches. The samples could, by both methods, be quantified as containing >2%, between 1 and 2%, between 0.1 and 1%, or <0.1% in 43 out of 47 determinations. The described method is modular, and thus suited for future needs in GM detection.
INTRODUCTION
DNA amplification techniques, in particular the polymerase chain reaction (PCR) (1), have become key diagnostic tools. Challenges with PCR, however, are still to obtain quantitative information, and to analyse several targets simultaneously. Developments of multiplex PCR are generally limited by the complexity of the amplification reaction. The number of possible primer pair combinations increases arithmetically with the number of primers present in the reaction, and leads to distorting side reactions. These background amplifications together with differences in amplification efficiencies between amplicons represent severe challenges with multiplex PCR (2).
Methods have been developed where bipartite primers with both 5′ universal and 3′ specific regions are used in multiplex PCR (3). A more uniform amplification can be obtained with such approaches. Primers identical to the universal region can also be added together with the bipartite primers, or after a few cycles of the PCR (4). This gives a further improvement of the uniformity of the amplifications. However, the presence of the bipartite primers throughout the amplification will still contribute to primer dimer formation and distortion of the quantitative results. Heath et al. (5) optimised the approach for quantitative detection. Quantitative information, however, could only be obtained when relatively high and constant amounts of DNA were used. These criteria are not met in most applications.
Many diagnostic applications require the simultaneous detection and quantification of several targets in samples where the amount of DNA is unknown. The methodological limitations, however, are in many cases the reason for developing simplex assays, or assays only including a few targets (6–10). This, for instance, is the case for the current tests of genetically modified (GM) materials in foods (11). Due to the large consumer concern regarding GM food, there is a need for food producers, retailers and authorities to have access to appropriate detection and quantification methods for the different GM constructs. Approximately 50 GM plant constructs are approved for commercial use in the USA (http://www.aphis.usda.gov/). In the European Community (EC) foods require labelling if >1% of any ingredient originate from GM material. Considering the large numbers of GM constructs expected in the future, multiplex quantitative measurements are required to determine whether the foods contain approved or unapproved GM ingredients, and whether the amount of GM material is above or below the 1% limit.
GM constructs are often composed of common elements such as the P35 promoter, nos terminator and an antibiotic-resistance gene as selection markers (12). Detection of these elements indicates that GM material may be present. Construct-specific PCRs spanning a junction specific for a GM construct give more accurate determinations. Sometimes the same genetic elements are used in several different GM constructs of which only some may be approved for use in the EC. The optimal solution is therefore to design PCRs in regions that are event specific in order to obtain complete selectivity for a given construct. These regions may include the overlap between endogenous and inserted DNA or specific rearrangements arising unintentionally during the transformation event.
We have developed a new quantitative multiplex DNA array based PCR method (MQDA-PCR). The method was used to quantify different transgenic maize in food and feed samples. The method is based on a two-step PCR (schematically shown in Fig. 1). In the first step bipartite primers containing a universal 5′ ‘HEAD’ region and a 3′ region specific to each construct were used. The PCR is run for a few cycles only. The unused primers are then removed with a single-strand DNA-specific exonuclease. This digestion removes the bipartite primers that would otherwise prime unwanted amplifications. The second step of the PCR is run containing only the primer consisting of the universal HEAD region. This step is thus competitive, conserving the ratio between the amplifying fragments. Finally, both to obtain better specificity and sensitivity, a linear amplification by sequence-specific labelling of DNA probes is included. The detection is done in a DNA array format through hybridising the labelled probes to their complementary sequences spotted on a solid phase (13,14). In our multiplex set-up, both common elements, construct-specific elements and elements that are specific for the different events were included (Fig. 2). The system also has a synthetic DNA as an internal reference standard for assessing both PCR inhibitory compounds in the sample and the amount of template DNA.
Figure 1.
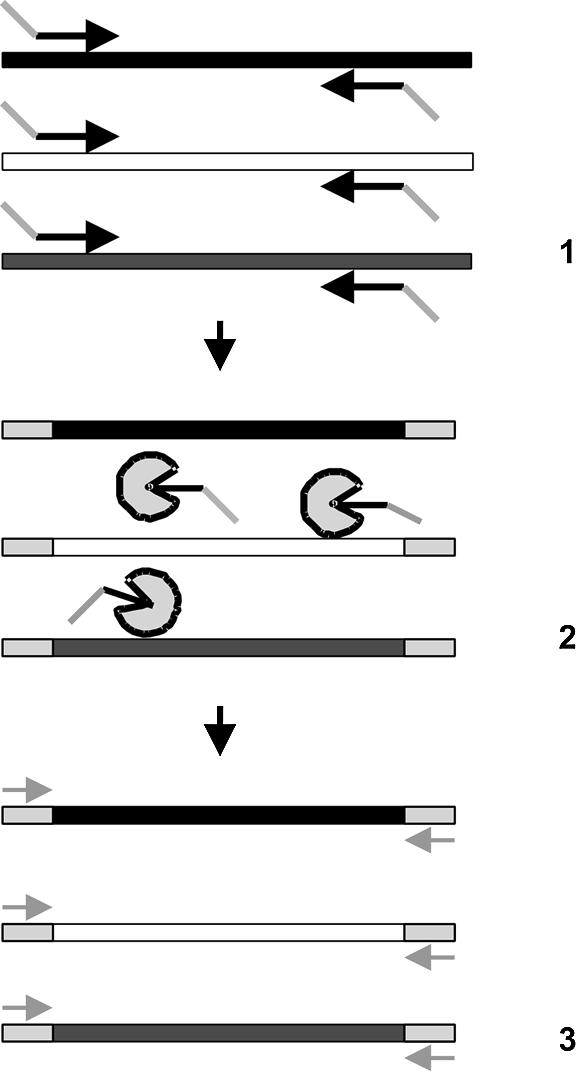
Schematic representation of the MQDA-PCR method. (1) In the first PCR step, the targets are amplified with bipartite primers containing universal HEAD regions (grey) which are equal for all the different targets. (2) The HEAD-containing primers are then removed by enzymatic digestion. (3) In the second PCR step, a primer identical to the HEAD sequence is used, creating a competitive reaction where the relative amounts of the different templates are maintained.
Figure 2.

Positions of primers and probes in the different GM maize constructs. Approximate positions of primers are shown as arrows, horizontal bars show probe positions. M, MQDA-PCR; T, 5′ nuclease PCR. Promoters are shown in grey, filled circles indicate specific point mutations in the epsps gene. P-35S, sequence derived from cauliflower mosaic virus promoter; hsp70, sequence containing intron no. 1 of the 70 kDa heat-shock protein of maize; IVS2, intron from maize alcohol dehydrogenase; cryA(b), synthetic delta endotoxin gene derived from Bacillus thuringiensis; T-nos, transcription terminator from Agrobacter tumefaciens nopalin synthase gene; pat, phosphinotricin N-acetyl transferase gene from Streptomyces viridochromogenes; pepC, phosphoenolpyruvate carboxylase promoter; pepC#9, fragment containing intron no. 9 from maize phosphoenol pyruvate carboxylase; T-35S, terminator from cauliflower mosaic virus; Pr-act, rice actin promoter; OTP, optimised transit peptide sequence; m-epsps, point mutated epsps gene derived from maize; cryIA(c) and cry9c, delta endotoxin genes from B.thuringiensis.
MATERIALS AND METHODS
Test materials
Mon810, Bt11 and Bt176 certified maize flour reference material prepared by the EU Joint Research Center, IRMM (Institute for Reference Materials and Measurements, Italy) were obtained from Fluka, Buchs, Switzerland. Additional Mon810 material was a gift from C. Bulkmans. For T25, GA21, CBH351 and DBT418 commercial maize reference material is not available. Larger amplicons encompassing the amplicon regions used in the multiplex assay were therefore mixed in various amounts with a background of non-GM maize DNA to create appropriate reference DNA material for these GM maizes. Food (corn meal, corn meal mixes, pop corn, corn snacks, canned sweet corn, whole kernel corn) and feed (horse feed, chicken feed, pet food) samples were from various food and feed stores in California, USA.
DNA purification
Samples were homogenised with a warring blender 708A (Krups, Germany) and purified using DNA adsorption columns (Dneasy plant mini kit; Qiagen, Hilden, Germany) as described by the manufacturer with the following modifications. The initial buffer volume was doubled and lysis was carried out for 30 min at 65°C using a shaking incubator. When eluting DNA bound to the column, 50 µl of elution buffer preheated to 70°C was used. In the repeated elution step another 50 µl buffer was added and the columns were spun at 13 000 r.p.m. (Biofuge Fresco; Kendro Laboratory Products, Osterodes, Germany) for 2 min. Finally, approximately 100 copies per reaction of an internal positive control (IPC) was included (Table 1). The copy number was calculated from OD260 measurements on the undiluted samples, using the nearest neighbour transformation (see http://www.genosys. com/oligo_uvquant.asp). The specificity of the IPC was tested with a search in GenBank, as well to the other targets amplified.
Table 1. Primers, probes and synthetic template DNA used in MQDA-PCR and 5′ nuclease PCR.
| Template | Orientation | Name | Sequence (5′ to 3′) |
|---|---|---|---|
| Primers and probes for the MQDA-PCR | |||
| HEAD sequence | H | TGC TAT GCG CGA GCT GCG | |
| Mon810 (15) | Sensea | Mon810F1101MH | H-AAT AAA GTG ACA GAT AGC TGG GCA |
| Antisensea | Mon810R1101MH | H-CCT TCA TAA CCT TCG CCC G | |
| Probeb | Mon810 Mud1101 | ACG AAG GAC TCT AAC GTT TAA CAT CCT TTG C | |
| Bt11 | Sense | AHJ-2MH | H-CGC ACA ATC CCA CTA TCC TT |
| Antisense | Bt11 RBMH | H-GCC TCC CAG AAG TAG ACG TC | |
| Probe | Bt11 MudF | AAG AAA CCC TTA CTC TAG CGA AGA TCC T | |
| Bt176 | Sense | PepC-20MH | H-ATC TCG CTT CCG TGC TTA GC |
| Antisense | Cry04(SMT-CT96)MH | H-GGT CAG GCT CAG GCT GAT GT | |
| Probe | Bt176-cryA1-1904 | TGA GCA ACC CCG AGG TGG AGG TG | |
| T25 (19) | Sense | T25 FMHB | H-CCA GTT AGG CCA GTT ACC CAG A |
| Antisense | T25 RMHB | H-TGG GAA CTA CTC ACA CAT TAT TAT AGA GAG | |
| Probe | T25 Mud | AGA CTG GTG ATT TCA GCG GGC ATG | |
| GA21 (19) | Sense | GA21 FMHB | H-AGC CTC GGC AAC GTC AGC |
| Antisense | GA21 RMHB | H-TCT CCT TGA TGG GCT GCA G | |
| Probe | GA21 MUDR | AAG GAT CCG GTG CAT GGC CGG | |
| Probe capture | GA21 MUD | GCC GGC CAT GCA CCG GAT CCT T | |
| DBT418 | Sense | DBT418 FMHB | H-GTC ATT TCA GGA CCA GGA TTC AC |
| Antisense | DBT418 RMHB | H-CCT CTA TTC TGG ATG TTG TTG CC | |
| Probe | DBT418 MUDR | GAA GAA TTC AGC CTA ACC AAG TCG CCT C | |
| CBH351 | Sense | CBH351 FMHB | H-GGT CAG ATC GTG AGC TTC TAC CA |
| Antisense | CBH351 RMHB | H-CGC ATG AAA GCT TCC CAG AT | |
| Probe | CBH351 MUD | GCT GAA CAC CCT GTG GCC AGT GAA | |
| 35S | Sense | 35SH-1 | H-GCT CCT ACA AAT GCC ATC A |
| Antisense | 35SMHH-R2 | H-CTT GCT TTG AAG ACG TGG TTG G | |
| Probe | 35S Mud2F | TGC CGA CAG TGG TCC CAA AGA TGG A | |
| Amp | Sense | Ampres FMH | H-TGC TCA CCC AGA AAC GCT G |
| Antisense | Ampres RMH | H-TTC TTC GGG GCG AAA ACT CTC | |
| Probe | Amp pro | GTA AAA GAT GCT GAA GAT CAG TTG GGT GCA | |
| Nos | Sense | Nos FMH | H-GAA TCC TGT TGC CGG TCT TG |
| Antisense | Nos RMH | H-AAT TTA TCC TAG TTT GCG CGC TA | |
| Probe | Nos pro | TTT ATG AGA TGG GTT TTT ATG ATT AGA GTC CCG | |
| IPC | Forward | IPC-FMH | H-CGC AGC GTT TCA AGC AGC |
| Reverse | IPC-RMH | H-CCA GTT AGC GGG CAG TAT CG | |
| Probe | IPC pro | AGC AGA CGG TAC GAT CAG ACG CTG T | |
| ZM ref | Sense | ZM1 FMH | H-TTG GAC TAG AAA TCT CGT GCT GA |
| Antisense | ZM1 RMH | H-GCT ACA TAG GGA GCC TTG TCC T | |
| Probe | MudF | CAA TCC ACA CAA ACG CAC G | |
| Primers and DNA used for template construction | |||
| T25 | T25 1–5′ | GCC AGT TAG GCC AGT TAC CCA | |
| T25 1–3′ | TGA GCG AAA CCC TAT AAG AAC CCT | ||
| GA21 | GA21 F | AGC CTC GGC AAC GTC AGC | |
| GA21 R | TCT CCT TGA TGG GCT GCA G | ||
| DBT418 | Template | DBT418hele | GTC ATT TCA GGA CCA GGA TTC ACT GGA GGC GAC TTG GTT AGG CTG AAT TCT TCC GGC AAC AAC ATC CAG AAT AGA GG |
| CBH351 | Template | CBH351hele | GGT CAG ATC GTG AGC TTC TAC CAG TTC CTG CTG AAC ACC CTG TGG CCA GTG AAC GAC ACC GCC ATC TGG GAA GCT TTC ATG CG |
| 35S | Sense | P35S 1–5′ | ATT GAT GTG ATA TCT CCA CTG ACG T |
| Antisense | T35S 1–3′ | ACT AAG GGT TTC TTA TAT GCT CAA CA | |
| IPC | Forward | IPC-F | CGC AGC GTT TCA AGC AGC |
| Reverse | IPC-R | CCA GTT AGC GGG CAG TAT CG | |
| Template | IPC-T | CGC AGC GTT TCA AGC AGC ACA TCA TCG ATC TAA TCG AGC AGA CGG TAC GAT CAG ACG CTG TCA TAC GCA TAA TCG ATA CGC GAT ACT GCC CGC TAA CTG G | |
| 5′ nuclease PCR primers and probesc | |||
| Bt11 | Sense | Fbt11-enhpatjun-AHJ-1 | CTT GGC GGC TTA TCT GTC TC |
| Antisense | Rbt11-enhpatjun-AHJ-2 | GCT GCT GTA GCT GGC CTA AT | |
| Probe | Fam-Bt11-enh-patd | TCG ACA TGT CTC CGG AGA GGA GAC C | |
| Bt176 | Probe | Bt176-CryA1td | CTG AGC AAC CCC GAG GTG GAG GT |
| T25 | Sense | T25 1–5′ | GCC AGT TAG GCC AGT TAC CCA |
| Antisense | T25 1–3′ | TGA GCG AAA CCC TAT AAG AAC CCT | |
| Probe | T25 prod | GCA TGC CCG CTG AAA TCA CCA GTC T | |
| DBT418 | Sense | DBT418 F | GTC ATT TCA GGA CCA GGA TTC AC |
| Antisense | DBT418 R | CCT CTA TTC TGG ATG TTG TTG CC | |
| Probe | DBT418 prod | GGA GGC GAC TTG GTT AGG CTG AAT TCT TC | |
| CBH351 | Probe | CBH351 prod | TGC TGA ACA CCC TGT GGC CAG TGA |
| zein (20) | Sense | Zetm1 | TGT TAG GCG TCA TCA TCT GTG G |
| Antisense | Zetm3 | TGC AGC AAC TGT TGG CCT TAC | |
| Probe | Zetmpd | ATC ATC ACT GGC ATC GTC TGA AGC GG | |
aAll sense and antisense primers used in the MQDA-PCR contain the HEAD sequence, designated by an H at the 5′end in addition to the given sequence.
bAll filter-bound capture probes are complementary to their corresponding probes.
cOnly primers and probes different from those used in the MQDA-PCR are listed. All 5′ nuclease primers are without the HEAD sequence.
dAll 5′ nuclease PCR probes contain 5′ FAM (6-FAM) and 3′ Tamra.
MQDA-PCR
Purified DNA was used in the amplification reactions. We used a two-step PCR amplification approach (Fig. 1). Primers and probes are listed in Table 1. In the first PCR step we used 10 pmol of each of the bipartite primers, 1 × Dynazyme DNA polymerase II reaction buffer, 0.2 mM dNTP (Promega, Madison, WI), 2 µl of Dynazyme DNA polymerase II (2 U/µl; Finnzymes Oy, Espoo, Finland), and 5 µl of purified DNA in a final volume of 50 µl. For the Bt11-specific amplicon, the concentration of primers was increased to 20 pmol (3). The amplification protocol used was as follows (first PCR step): four cycles of 95°C for 30 s, 55°C for 30 s and 72°C for 30 s. Twenty microlitres of the amplification product from the first PCR was treated with 20 U exonuclease I (U.S. Biochemical Corp., Cleveland, OH) to degrade the residual single-stranded primers, and 4 U shrimp alkaline phosphatase (U.S. Biochemical Corp.) to inactivate nucleoside triphosphates. The reaction was incubated at 37°C for 30 min, and then at 95°C for 10 min to inactivate the added enzymes.
Five microlitres of the treated products was then used for the second PCR amplification. Fifty pmoles of a universal primer identical to the universal HEAD region of the primers used in the first PCR was added. The other components were the same as in the first amplification. The second PCR step was carried out under the following conditions: 30–40 cycles of 95°C for 30 s and 70°C for 45 s.
When the system was used to quantify unknown samples, reference samples of known concentrations of GM maize were always included in the same experiment. The ratio of the specific signals over the maize reference signal were normalised against the averaged signal from the maize reference gene and used to construct the normalised standard curves. The internally added synthetic DNA, the IPC control, was used as a control for the activity of the DNA polymerase and to identify samples with low content of maize DNA. All samples were analysed in duplicate.
Sequence-specific labelling
After amplification with the HEAD primer the amplification products were treated with 20 U exonuclase I and 4 U shrimp alkaline phosphatase at 37°C for 30 min to degrade residual oligonucleotides and to dephosphorylate trinucleotides, and then 95°C for 10 min to inactivate the enzymes. The cyclic labelling conditions were as follows: 1× Thermosequenase reaction buffer, 10 pmol of each GM-specific probe, 100 pmol ddNTP (except ddCTP) (Roche Biochemicals, Mannheim, Germany), 100 pmol fluorescein-12-ddCTP (Perkin Elmer, Boston, MA), 16 U Thermosequenase DNA polymerase (Amersham Pharamacia plc, Buckinghamshire, UK) and 24 µl of phosphatase and exonuclease treated PCR product in a total volume of 60 µl. The labelling was done using the following conditions: 95°C for 15 s, 60°C for 1 min for 15 cycles, 95°C for 15 s, 55°C for 1 min for 15 cycles, and finally 95°C for 15 s, 50°C for 1 min for 15 cycles.
DNA array hybridisation
Fifty pmoles of probes complementary to those used in the labelling reaction were spotted on Gene screen Plus nylon membranes (Perkin Elmer), and crosslinked for 15 min with a UV transilluminator (Model TL33; UVP Inc., San Gabriel, CA). The membranes were prehybridized in 0.5 M Na2HPO4 pH 7.2 and 1% SDS for 2 h. The labelled probes were added to 300 µl of 1× SSC and 6% PEG 1500 and heated to 80°C for 5 min. The hybridisation was done overnight at room temperature with agitation in a Cross Blot Dot Blot hybridisation chamber (Sebia, Moulinaux, France) using wells perpendicular to those employed when spotting the complementary probes. The membrane was subsequently rinsed in 1× SSC, 1% SDS for 5 min, then 5 min in 0.1× SSC, 0.1% SDS, and finally 5 min in 0.1 M Tris–HCl pH 7.5 and 0.15 M NaCl (antibody buffer). At this point the fluorescence was detected directly using a confocal laserscanner (Typhoon Variable Imager; Amersham-Pharmacia). The membranes were then blocked for 1 h in blocking buffer: antibody buffer containing 1% skimmed milk (Difco, Detroit, MI). Blocking buffer containing 1/500 antifluorescein horse radish peroxidase (HRP) conjugate was then added, and the reaction continued at room temperature for 1 h. Finally, the membranes were rinsed for 30 min in antibody buffer, and the signals detected with 4 CN Plus chromogenic substrate according to the manufacturer’s recommendations (Perkin Elmer).
Quantifications of both fluorescent and chromogenic signals were carried out using the Imagemaster™ Array software version 2.0 program and calculations were done with Microsoft Excel 97 SR-2 (Microsoft Corp., Redmond, WA).
5′ Nuclease PCR
5′ Nuclease PCR was carried out essentially as described (15) using the primer probe systems described in Table 1 and the Applied Biosystems 7700 Sequence Detector (Applied Biosystems).
RESULTS AND DISCUSSION
The MQDA-PCR was thoroughly evaluated in an eight-plex quantitative detection of the GM maize constructs Mon810, Bt11 and Bt176, the hmga reference gene, the IPC, in addition to the common GM elements 35S promoter and nos terminator (Fig. 3). A series of samples containing dilutions of Mon810, alone or with 2% Bt11 DNA, were analysed. In all cases, samples containing Mon810 gave a linear response proportional to the GM content in the range 0.1–2.0%. The linear regression curves gave squared regression coefficients of 0.987 and 0.974 for the samples without and with Bt11, respectively. For the samples containing only Mon810 the Pearson correlation between the Mon810 and the 35S signals was 0.994. The 35S signals from the samples containing both Mon810 and Bt11 gradually weaken as the amount of Mon810 is lowered and approach a constant value due to presence of Bt11 DNA. The Bt11, nos and IPC signals (Fig. 3B) remained constant with average values 1900 ± 580, 8100 ± 230 and 2780 ± 960, respectively, and were not affected by the Mon810 content. We also analysed sample series containing Bt11 and Bt176. These samples gave good linear responses in the range 0.1–2% GM material, with square regression coefficients of 0.998 and 0.978, respectively.
Figure 3.

Eight-plex quantitative determinations of the Mon810 maize in the absence (A) and presence (B) of 2% Bt11 maize together with quantified fluorescence signals (C). Each column represents one MQDA-PCR, each row represents one amplicon. Samples: 1, 2: 2.0% Mon810 maize; 3, 4: 1.0% Mon810; 5, 6: 0.5% Mon810; 7, 8: 0.1% Mon810; 9, 10: 0% Mon810; R, reference sample containing 0.7% of each of Mon810, Bt11 and Bt176 maize. N, no template control. The HRP-enhanced chromogenic signals are shown. (C) Quantification of the fluorogenic signals of Mon810 alone (diamonds) and Mon810 together with 2% Bt11 (squares). All samples were analysed in duplicate. Amp, ampicillin-resistance gene; Nos, T-nos transcription terminator from A.tumefaciens nopalin synthase gene; 35S, P-35S sequence derived from cauliflower mosaic virus promoter; ZM ref, sequence derived from the hmga gene endogenous to maize.
Mixtures of Mon810, Bt11 and Bt176 were also analysed. The signals for each target remained unchanged or could be slightly weaker (20–30%) when more than one target was present in the same sample, compared to the signals obtained for single targets (results not shown). This is probably due to a slightly higher frequency of side reactions when multiple targets are amplified simultaneously (see also discussion for twelve-plex PCR).
To investigate the influence of template DNA concentration on quantification, a reference mixture of 0.7% of each of Mon810, Bt11 and Bt176 at different dilutions was used as template in the PCR. The undiluted sample contained approximately 100 (determined from 5′ nuclease PCR) genome copies of the respective GM constructs. The sample was diluted in 4-fold dilutions up to 64-fold. The signals were relatively stable up to a 16-fold dilution. For the more diluted samples, however, there were probably stochastic effects due to the few target copies.
The multiplex system was expanded from an eight-plex to a twelve-plex PCR through the inclusion of primers for detection of the maize constructs CBH351, DBT418, GA21 and T25 (Fig. 4A). Mixtures containing 0.7 or 1.0% of each of all seven different GM constructs were amplified in one reaction together with the amplicons from amp, nos, 35S, IPC and the maize reference gene. When CBH351, DBT418, GA21 and T25 were amplified separately, a dose response was observed. Specific signals were obtained for all the constructs. The signals from the mixtures of the seven GM constructs were generally weaker than those obtained with single GM samples (Fig. 3B). The signals obtained for CBH351 in the mixture was ∼40% of the signal obtained for CBH351 alone. The corresponding values for DBT418, GA21 and T25 were 35, 35 and 55%, respectively. It is likely that the reduced signals are due to unspecific side reactions since all the targets are affected in the same manner. An inherent property of all PCRs is unspecific side reactions. Side reactions are not completely eliminated in the twelve-plex PCR, although the MQDA-PCR drastically reduces this problem (see example below where the bipartite primers are not removed after the first PCR). The problem could probably be reduced further by extensive primer optimisation of the bipartite primers. Another option could be to use experimental design to include standards that cover the expected variation. With two level fractional factorial design (0.1 and 1% of the respective GM constructs) quantifications of unknown samples should be possible with eight standards per analytical series for the seven GM constructs (determined with the experimental design software Design-Expert version 6.0.7.; Stat-Ease Inc, Minneapolis, MN). In some cases, the standard curves deviate from linearity. This is particularly observed when signals are strong and stems from saturation of targets during the probe labelling reaction. This may be adjusted by lowering the number of labelling cycles.
Figure 4.

Twelve-plex system for detection of seven different GM maize events. (A) HRP-enhanced chromogenic signals and (B) quantifications of the corresponding fluorogenic signals for CBH351, DBT418, GA21 and T25. Samples 1, 2: a mixture of 0.7% of each of Mon810, Bt11 and Bt176 and 1% of each of T25, GA21, CBH351 and DBT418; 3, 4: non-GM maize; 5, 6: 2.0% CBH351; 7, 8: 0.5% CBH351; 9, 10: 2% DBT418; 11, 12: 0.5% DBT418; 13, 14: 2% GA21; 15, 16: 0.5% GA21; 17, 18: 2% T25; 19, 20: 0.5% T25. Amplicons are as described in the legend to Figure 3 with additions of amplicons for CBH351, DBT418, GA21 and T25 as indicated in Figure 2. (Squares) Signals obtained from samples 1 and 2.
Seventeen different food and feed samples were screened using both the twelve-plex MQDA-PCR and simplex 5′ nuclease PCRs for the respective GM constructs. Ct values for the maize reference gene in the food and feed samples were generally in the range 26–29. This corresponds to approximately 104–105 gene copies. Ten samples were GM positive, and seven GM negative (GM content <0.1%). Eight GM-positive samples contained Mon810, eight contained Bt11 and seven contained Bt176. One sample contained appreciable amounts of GA21, a few more samples harboured small amounts of GA21 and in one sample small amounts of T25 were observed. No maize material containing the constructs CBH351 or DBT418 was detected. These results are reasonable since the latter four GM maizes are either withdrawn from the market or known to be not very widespread. Two GM-positive samples contained only marginal amounts of DNA as judged by the increase in intensity of the IPC signal and the Ct values of the 5′ nuclease PCR. Quantification of GM content in these samples was therefore not possible (Ct for GM constructs >40).
Seven of the other GM-positive samples and one negative sample were selected for a comparative quantitative study between the eight-plex MQDA-PCR and simplex 5′ nuclease PCRs for the constructs Mon810, Bt11 and Bt176 (Table 2). Both the MQDA-PCR and 5′ nuclease PCR require known standards for quantification. That is, accurate quantifications can only be obtained if reference materials are analysed in the same experiment. The quantitative results obtained using the calibration curves based on the reference material gave good agreement between the MQDA-PCR and the 5′ nuclease approach. The multiplex method accurately identified samples with high and low content of GM material. In 20 out of 23 analyses the samples could be quantified as containing >2%, between 1 and 2%, between 1 and 0.1% or <0.1% by both methods. If all the other GM-negative samples (<0.1% GM material) are included, the corresponding figures are 43 out of 47, respectively. For samples containing ∼1% GM material one experiences the same uncertainties as with the 5′ nuclease PCR. Some of these uncertainties are inherent to the methods due to the low number of template molecules at the start of the PCR (16,17). A sample containing 0.1–1% GM material would harbour 10–100 copies of the GM construct. Other uncertainties may be caused by differential degradation of the target, or slight differences in amplification efficiencies. The averaged standard deviation for the MQDA-PCR detection of Mon810, Bt11 and Bt176 for the different food and feed samples (with GM content ≤2%) was 0.360, while the corresponding average standard deviation for the 5′ nuclease PCR was 0.405. The performance of the MQDA-PCR method is comparable to that of the 5′ nuclease method in these types of analyses. The use of independent amplicons and amplification reactions are limiting factors for the 5′ nuclease and other real-time PCR approaches as compared to MQDA-PCR. Only slight alterations in the amplification efficiencies for the independent amplicons under different conditions (e.g. by compounds in the samples that affect or inhibit the PCR) may have dramatic effects on the quantifications. It is interesting to note that there was a better agreement between the MQDA-PCR and 5′ nuclease PCR for Mon810 and Bt176 than for Bt11. This is probably because the same target regions are used for both approaches for Mon810 and Bt176 (see Fig. 2).
Table 2. GM quantification comparisons between MQDA-PCR and 5′ nuclease PCR in food and feed samples (%).
| Sample no. | Origin | Mon810 | Bt11 | Bt176 | |||
|---|---|---|---|---|---|---|---|
| MQDA-PCR | 5′ Nuclease | MQDA-PCR | 5′ Nuclease | MQDA-PCR | 5′ Nuclease | ||
| 1 | Maize graina | 1.1 ± 0.2 | 1.1 ± 0.3 | <0.1 | <0.1 | NDb | 18.6 ± 9.1 |
| 3 | Dog food | >2 | 4.4 ± 3.5 | >2 | 11.5 ± 5.2 | 0.8 ± 0.2 | 0.6 ± 0.1 |
| 5 | Dog food | >2 | 8.5 ± 2.4 | >2 | 5.2 ± 0.0 | 0.8 ± 0.3 | 0.5 ± 0.1 |
| 8 | Chicken feed | >2 | 35.1 ± 23 | 0.6 ± 0.4 | 2.0 ± 0.9 | 0.7 ± 0.0 | 2.1 ± 0.2 |
| 11 | Instant corn mix | <0.1 | <0.1 | 0.8 ± 0.5 | 0.2 ± 0.1 | <0.1 | <0.1 |
| 13 | Corn meal | 0.3 ± 0.0 | 0.2 ± 0.2 | 0.2 ± 0.3 | 0.1 ± 0.0 | 1.6 ± 0.8 | 1.5 ± 0.3 |
| 18c | Whole kernel corn | <0.1 | <0.1 | <0.1 | <0.1 | <0.1 | <0.1 |
| 19 | Yellow corn meal | >2 | 13.6 ± 2.0 | 1.4 | 0.6 ± 0.7 | >2 | 12.9 ± 2.7 |
aHorse feed.
bND, not determined.
cA negative sample included.
The effect of removing the bipartite primers after the first PCR was tested in an experiment where Bt176 DNA and Bt11 DNA were kept constant at 0.7% in all samples. Concentrations of Mon810 DNA were from 0 to 2.0%. Very weak, not quantifiable, signals were obtained when bipartite primers from the first round were not degraded prior to the second PCR. Generally, the signals were in the range of <10% or less of the signals obtained when the primers were removed. Agarose gel electrophoresis showed that unspecific background amplification was the reason for the low signals when the bipartite primers were not removed. The bipartite primers have a much higher Tm than the HEAD primers, and are thus more prone to generate unspecific products. Furthermore, there is also a high number of possible primer combinations contributing to the unspecific background amplification. Similar problems have also been reported previously (5). Using symmetric amplification termini significantly reduces the problem with primer dimer formation (4). Heath et al. concluded that constant amounts of input DNA were needed to obtain quantitative results when the bipartite primers from the first reaction were present. Low amounts of DNA gave no or irreproducible amplifications, while high amounts gave unspecific background amplifications (5). The presence of bipartite primers throughout the amplification also makes the quantification of low abundant targets impossible. The bipartite primers do also generate unspecific products during the initial PCR cycles of the MQDA-PCR, but the amount of unspecific amplification remains low during the rest of the PCR since the bipartite primers are degraded after four cycles.
We tested the effect of running the whole PCR with only the bipartite primers. It has previously been shown that the inclusion of a universal region on the PCR primers increases the uniformity of multiplex amplifications (3). The first PCR step using bipartite primers was extended to 40 cycles, and the second PCR step omitted. By doing this, some of the amplicons were not amplified, while the IPC amplicon was unexpectedly strong (>10-fold that of when the primers were removed). The lack of amplification of selected fragments is a common phenomenon when several independent amplifications are run simultaneously (18). The reason for this is probably the complexity of the amplification reaction. Only small alterations in the reaction conditions will have a profound effect on the amplification results. Furthermore, the nature of the assay in these cases were non-competitive, since the ratios between the different amplicons are not conserved.
The MQDA-PCR approach described here is a general approach for DNA quantifications. The GM detection shows the applicability of the method. We are currently adapting it both for the detection of pathogens in foods, and for gene expression studies. Other applications could, for example, be clinical diagnostics of viruses and bacteria.
Acknowledgments
ACKNOWLEDGEMENTS
We want to thank Dr Frøydis Bjerke for carrying out the statistical analysis. The European Commission is acknowledged for financial support through the Fifth (EC) Framework program 1998–2002, project QPCRGMOFOOD, proposal no. QLRT-1999-01301. This project was also partially financed by a research levy on certain agricultural products.
REFERENCES
- 1.Saiki R.K., Scharf,S., Faloona,F., Mullis,K.B., Horn,G.T., Erlich,H.A. and Arnheim,N. (1985) Enzymatic amplification of beta-globin genomic sequences and restriction site analysis for diagnosis of sickle cell anemia. Science, 230, 1350–1354. [DOI] [PubMed] [Google Scholar]
- 2.Markoulatos P., Siafakas,N. and Moncany,M. (2002) Multiplex polymerase chain reaction: a practical approach. J. Clin. Lab. Anal., 16, 47–51. [DOI] [PMC free article] [PubMed] [Google Scholar]
- 3.Shuber A.P., Grondin,V.J. and Klinger,K.W. (1995) A simplified procedure for developing multiplex PCRs. Genome Res., 5, 488–493. [DOI] [PubMed] [Google Scholar]
- 4.Brownie J., Shawcross,S., Theaker,J., Whitcombe,D., Ferrie,R., Newton,C. and Little,S. (1997) The elimination of primer-dimer accumulation in PCR. Nucleic Acids Res., 25, 3235–3241. [DOI] [PMC free article] [PubMed] [Google Scholar]
- 5.Heath K.E., Day,I.N.M. and Humphries,S.E. (2000) Universal primer quantitative fluorescent multiplex (UPQFM) PCR: a method to detect major and minor rearrangements of the low density lipoprotein receptor gene. J. Med. Genet., 37, 272–280. [DOI] [PMC free article] [PubMed] [Google Scholar]
- 6.Henegariu O., Heerema,N.A., Dlouhy,S.R., Vance,G.H. and Vogt,P.H. (1997) Multiplex PCR: critical parameters and step-by-step protocol. Biotechniques, 23, 504–511. [DOI] [PubMed] [Google Scholar]
- 7.Rithidech K.N., Dunn,J.J. and Gordon,C.R. (1997) Combining multiplex and touchdown PCR to screen murine microsatellite polymorphisms. Biotechniques, 23, 36, 40,, 42,, 44. [DOI] [PubMed] [Google Scholar]
- 8.Roux K.H. (1995) Optimization and troubleshooting in PCR. PCR Methods Appl., 4, S185–S194. [DOI] [PubMed] [Google Scholar]
- 9.Walsh P.S., Erlich,H.A. and Higuchi,R. (1992) Preferential PCR amplification of alleles: mechanisms and solutions. PCR Methods Appl., 1, 241–250. [DOI] [PubMed] [Google Scholar]
- 10.Williams J.F. (1989) Optimization strategies for the polymerase chain reaction. Biotechniques, 7, 762–769. [PubMed] [Google Scholar]
- 11.Giovannini T. and Concillo,L. (2002) PCR detection of genetically modified organisms: a review. Starch, 54, 321–327. [Google Scholar]
- 12.MacCormick C.A., Griffin,H.G., Underwood,H.M. and Gasson,M.J. (1998) Common DNA sequences with potential for detection of genetically manipulated organisms in food. J. Appl. Microbiol., 84, 969–980. [DOI] [PubMed] [Google Scholar]
- 13.Rudi K., Flateland,S.L., Hanssen,J.F., Bengtsson,G. and Nissen,H. (2002) Development and evaluation of a 16S rDNA array approach for describing complex microbial communities in ready-to-eat vegetable salads packed in modified atmosphere. Appl. Environ. Microbiol., 68, 1146–1156. [DOI] [PMC free article] [PubMed] [Google Scholar]
- 14.Rudi K., Skulberg,O.M., Larsen,F. and Jakobsen,K.S. (1998) Quantification of toxic cyanobacteria in water by use of competitive PCR followed by sequence-specific labeling of oligonucleotide probes. Appl. Environ. Microbiol., 64, 2639–2643. [DOI] [PMC free article] [PubMed] [Google Scholar]
- 15.Holck A., Vaïtilingom,M., Didierjean,L. and Rudi,K. (2002) 5′-Nuclease PCR for quantitative event-specific detection of the genetically modified Mon810 MaisGard maize. Eur. Food Res. Technol., 214, 449–453. [Google Scholar]
- 16.Kay S. and Van den Eede,G. (2001) The limits of GMO detection. Nat. Biotechnol., 19, 405. [DOI] [PubMed] [Google Scholar]
- 17.Peccoud J. and Jacob,C. (1996) Theoretical uncertainty of measurements using quantitative polymerase chain reaction. Biophys. J., 71, 101–108. [DOI] [PMC free article] [PubMed] [Google Scholar]
- 18.Mitsuhashi M. (1996) Technical report: Part 2. Basic requirements for designing optimal PCR primers. J. Clin. Lab. Anal., 10, 285–293. [DOI] [PubMed] [Google Scholar]
- 19.Matsuoka T., Kuribara,H., Akiyama,H., Miura,H., Goda,Y., Kusakabe,Y., Isshiki,K., Toyoda,M. and Hino,A. (2001) A multiplex PCR method of detecting recombinant DNAs from five lines of genetically modified maize. J. Food Hyg. Soc. Jpn, 42, 24–32. [DOI] [PubMed] [Google Scholar]
- 20.Vaïtilingom M., Pijnenburg,H., Gendre,F. and Brignon,P. (1999) Real-time quantitative PCR detection of genetically modified Maximizer Maize and Roundup Ready Soybean in some representative foods. J. Agric. Food Chem., 47, 5261–5266. [DOI] [PubMed] [Google Scholar]