Abstract
The FYVE domain binds with high specificity and avidity to phosphatidylinositol 3-phosphate. It is present in ≈30 proteins in humans, some of which have been implicated in functions ranging from early endosome fusion to signal transduction through the TGF-β receptor. To develop a further understanding of the biological roles of this protein family, we turned to the nematode Caenorhabditis elegans, which contains only 12 genes predicted to encode for phosphatidylinositol 3-phosphate binding, FYVE domain-containing proteins, all of which have homologs in the human genome. Each of these proteins was targeted individually by RNA interference. One protein, WDFY2, produced a strong inhibition of endocytosis when silenced. WDFY2 contains WD40 motifs and a FYVE domain, is highly conserved between species, and localizes to a set of small endosomes that reside within 100 nm from the plasma membrane. These endosomes are involved in transferrin uptake but lack the classical endosomal markers Rab5 and EEA1. Silencing of WDFY2 by siRNA in mammalian cells impaired transferrin endocytosis. These studies reveal the important, conserved role of WDFY2 in endocytosis, and the existence of a subset of early endosomes, closely associated with the plasma membrane, that may constitute the first stage of endocytic processing of internalized cargo.
Keywords: internalization, phosphatidylinositol 3-kinase, phosphoinositide, total internal reflection fluorescence microscopy
Phosphorylated phosphoinositides play critical roles in the process of endocytosis. Phosphatidylinositol 3-phosphate [PtdIns(3)P], a major product of PtdIns 3-kinase, is found almost exclusively on the surface of endosomes, where it can recruit proteins containing FYVE or PX domains (1, 2). The first protein found to be recruited onto endosomes in a PtdIns 3-kinase-dependent manner was EEA1 (3–5). EEA1 also interacts with the GTPase Rab5 (6, 7), and calmodulin (8–10) and has been proposed to function as a tether to facilitate early endosome fusion (6, 11–14).
Many other proteins containing FYVE domains are recruited to early endosomes. Examples include the proteins Rabenosyn5 (15) and Rabip4 (16), which appear to coordinate the functions of the small GTPases Rab4 and Rab5, and Hrs, which is involved in ubiquitin-mediated lysosomal degradation (17, 18). In addition, Fab1p/PIKfyve, which catalyzes the phosphorylation of PtdIns(3)P to PtdIns(3,5)P2 appears to have an important role in multivesicular body formation (19–21). FYVE domain-containing proteins also function in pathways not primarily related to endosomal trafficking. These include SARA (22–24), which mediates signal transduction through the TGF-β receptor. The human UniGene collection lists 30 different FYVE-domain-containing proteins, indicating that many more functions involving PtdIns(3)P and FYVE-domain interaction remain to be discovered. Of these, it is not known how many or which are involved in the control of trafficking in the endocytic pathway, or which are involved in other functions, such as specific signal transduction events.
The Caenorhabditis elegans genome contains only 12 proteins that contain FYVE domains predicted to bind PtdIns(3)P on the basis of their primary amino acid sequence. The function of each of these proteins can be analyzed in transgenic strains of worms engineered to report the activity of specific cellular processes. For example, endocytosis can be monitored indirectly or directly by looking for an Unc (uncoordinated) phenotype, which can indicate deficient synaptic vesicle recycling (25, 26), by accumulation of yolk in the pseudocoelom (27), or by the lack of rhodamine-dextran endocytosis by intestinal cells of the gut (28). Resistance of aldicarb treatment in hypersensitive strains can identify genes involved in endocytosis or exocytosis at the neuromuscular synapse (29). We have used a system developed by Fares and Greenwald (28) in which endocytosis is monitored by looking at the uptake of secretory GFP into coelomocytes. Coelomocytes are six cells that actively internalize fluid and degrade the GFP secreted from the muscle cells into the pseudocoelom. When Vps34, dynamin, RME-1, and other proteins involved in endocytosis are targeted by injection of dsRNA, GFP fails to internalize into coelomocytes and accumulates in the pseudocoelom. With this screen we have uncovered an important role for the WD40 and FYVE domain-containing protein 2 in the endocytic pathway and the existence of a subset of early endosomes that lack canonical markers EEA1 and Rab5.
Results and Discussion
Proteins were classified as FYVE-domain-containing proteins if the sequence contained the following: a WXXD motif, four CXXC motifs, a R(R/K)HHCR motif, and a RVC motif. The cDNAs of 12 different genes in C. elegans that conformed to this criteria (Table 1) were transcribed in vitro into dsRNAs and individually injected. Although no single protein was found to be essential for viability, the absence of lethality could be caused by redundancy in pathways involving FYVE-domain-containing proteins or inefficient RNA knockdown, necessitating further studies in which genes are deleted, silenced in combination, or both to reveal potential functions and interactions. Thus, our results up to now can only rule in, not out, a function for a particular FYVE-domain-containing protein.
Table 1.
Genes screened for coelomocyte uptake deficiency
| Clone | Gene | Protein | Homolog |
|---|---|---|---|
| Yk15a2 | Aka-1 | WP:CE02581 | SARA/AKAP |
| Yk1334h08 | ZK632.12 | WP:CE01110 | Phafin2 |
| Yk877d04 | Pqn-9 | WP:CE32574 | Hrs |
| Yk1281a05 | R160.7 | WP:CE33815 | KIAA1643 |
| Yk523h7 | Y42H9AR.3 | WP:CE29111 | Rabenosyn5 |
| Yk1121h09 | VT23B5.2 | WP:CE20122 | |
| Yk1334f06 | Ppk-3 | WP:CE18979 | PIP5K |
| Yk1189b03 | D2013.2 | WP:CE00928 | WDFY2 |
| Yk5g8 | T10G3.5 | WP:CE31066 | EEA1 |
| Yk212f9 | F22G12.4 | WP:CE27740 | |
| Yk394e11 | C28C12.10 | WP:CE28920 | ANKHZN |
| Yk553e11 | Mtm-3 | WP:CE03708 | Myotubularin-related protein 2 |
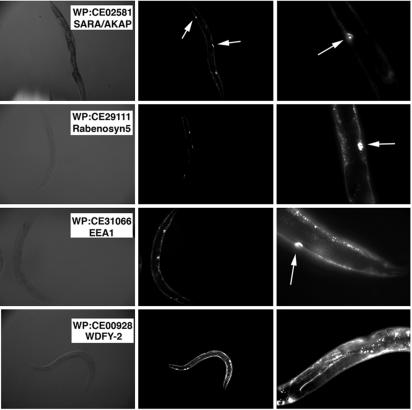
To reveal defects specifically in the endocytic pathway we used a transgenic strain (arIs37[pmyo::ssGFP] I; dpy-20(e1282) IV) in which GFP is under control of the myosin promoter. The progeny of the injected worms was scored for coelomocyte endocytosis by analyzing the relative amounts of GFP in the pseudocoelom versus the coelomocytes (Fig. 1). Two dsRNAs yielded a phenotype different from the uninjected worm. These transcripts were t10g3.5 (yk5g8), which corresponds to the homolog of EEA1 and displayed a slight increase in GFP fluorescence in the pseudocoelom, and d2013.2 (yk1189b03), which displayed a much greater accumulation of pseudocoelomic GFP (Fig. 1). A BLAST search for homology revealed extensive similarity between yk1189b03 and the mammalian protein WDFY2.
Fig. 1.
Disruption of coelomocyte endocytosis by WDFY2 silencing. Worms were injected with the dsRNAs for the proteins indicated (Left), and the progeny were visualized by phase microscopy (Left) or fluorescence microscopy (Right) at low (×15) (Center) and higher (×45) magnifications (Right). All images were taken with the same exposure time and are representative of at least 10 worms from each of three different experiments. The phenotypes of the worms injected with dsRNAs to SARA or Rabenosyn5 (top two panels) were indistinguishable from noninjected control worms and are included as examples of the WT phenotype. Coelomocytes are clearly visible over the background in these worms (arrows) but are less apparent in worms injected with dsRNA to WDFY2, which have much brighter GFP levels.
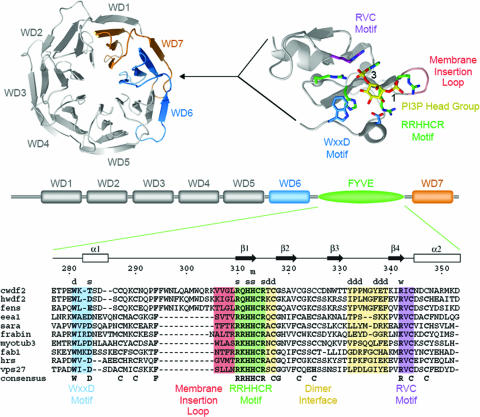
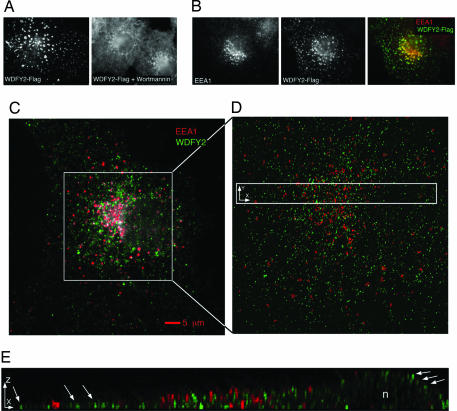
WDFY2 contains a FYVE domain and seven WD40 motifs, and its amino acid sequence is highly conserved among species. The FYVE domains of both C. elegans and human WDFY2 display the structural properties known to be critical for PtdIns(3)P binding (Fig. 2). Both WDFY2 and the closely related mammalian protein WDFY1 (also called FENS-1; ref. 30), contain a large insertion N terminal to the predicted membrane insertion or “turret” loop of the FYVE domain. The role of this insertion is not known. To determine whether indeed WDFY2 is targeted to endosomes in mammalian cells, a full-length construct of human WDFY2 was cloned in-frame with a Flag tag. When transiently transfected into Cos cells, WDFY2-Flag was visualized on vesicular structures of varying sizes, consistent with its endosomal localization, and treatment of cells with wortmannin caused its rapid redistribution into the cytoplasm (Fig. 3A), indicating that WDFY2 is targeted to endosomes in a PtdIns 3-kinase-dependent manner. We noticed that the distribution of WDFY2-Flag did not completely match that of endogenous EEA1 (Fig. 3B), being more prominent in smaller and more peripherally distributed endosomes.
Fig. 2.
Structural organization of WDFY2 and conservation of functional motifs. C. elegans WDFY2 (cWDFY2) and the human homolog (hWDFY2) consist of seven WD40 repeats with a FYVE domain inserted between repeats WD6 and WD7. The WD40 repeats are predicted to form a b propeller structure with seven blades. The predicted site of insertion in the loop connecting repeats WD6 and WD7 of human WDFY2 is indicated with respect to the structure of UNC-78 (Protein Data Bank ID code 1PEV), which represents the closest structural homolog identified by threading by using the Phyre fold recognition server. The FYVE domain of EEA1 (Protein Data Bank ID code 1JOC) is depicted on the right. Note that the FYVE domains of WDFY2 and FENS-1 contain a large insertion at the N terminus of the membrane insertion loop. Structural images were rendered with PyMol (www.pymol.org).
Fig. 3.
Localization of expressed Flag-tagged and endogenous WDFY2. (A) Flag-tagged WDFY2 was expressed in Cos-7 cells, which were incubated in the presence or absence of wortmannin as indicated, fixed, and stained with anti-Flag antibodies. (B) Cos cells expressing Flag-WDFY2 were fixed and stained with antibodies to EEA1 and Flag. The overlap between the two signals is depicted in yellow (Right) and is likely to result from overexpression of Flag-WDFY2. (C) Nontransfected Cos-7 cells were stained with antibodies to EEA1 (red) and endogenous WDFY2 (green). Shown is the 2D projection of a 3D image stack before restoration. (D) Area in square in C, after restoration. (E) Area in rectangle in D, projected after 90° rotation along the y axis; n = nucleus. Arrows point to few of the many peripherally localized structures that contain WDFY2 but no detectable endogenous EEA1. (Magnifications: A and B, ×1,000.)
To determine whether endogenous WDFY2 displayed this distribution or whether it was an artifact of overexpression, we generated affinity-purified rabbit anti-WDFY2 antibodies by using recombinant full-length protein. The distribution of WDFY2 relative to that of EEA1 was analyzed by using deconvolution microscopy as described in Methods. Antibody to WDFY2 stained vesicular structures of various sizes distributed over the entire cytoplasmic volume. Some colocalization with endogenous EEA1 was seen in non-nonrestored images (Fig. 3C), but it was mostly in the perinuclear region where the cytoplasmic volume is largest and was not apparent in restored images where structures that reside in close proximity can be resolved from each other (Fig. 3 D and E). Analysis of the 3D images revealed a more peripheral localization of endosomes containing WDFY2 compared to those enriched in EEA1 (Fig. 3E, arrows), suggesting that vesicles containing WDFY2 are closer to the plasma membrane that those containing EEA1.
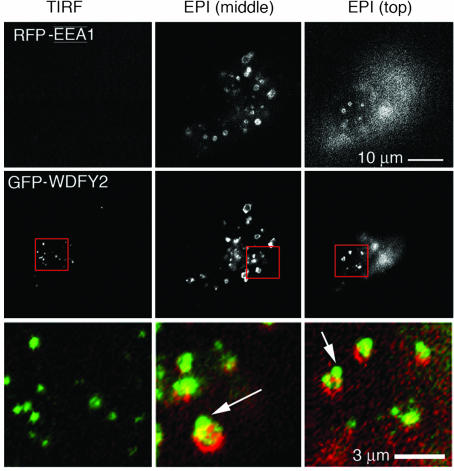
To determine whether indeed WDFY2 targets to a population of endosomes closer to the plasma membrane, live cells expressing GFP-WDFY2 and RFP-EEA1 were analyzed by using total internal reflection fluorescence (TIRF) microscopy (TIRF-M), which reveals exclusively those fluorophores present within 100 nm from the plasma membrane (31). In preliminary experiments, we verified the colocalization of expressed protein with the endogenous protein detected with anti-WDFY2 antibodies. When imaged by TIRF-M, many vesicles containing GFP-WDFY2 could be observed near the surface, but very few structures containing RFP-EEA1 were detected (Fig. 4Left). This difference was not caused by lack of RFP-EEA1 expression, for when the same cells were visualized by epifluorescence a very bright signal of RFP-EEA1 could be detected (Fig. 4 Center and Right). Interestingly, in these images endosomes containing EEA1 appear to be surrounded by smaller endosomes containing WDFY2, suggesting the possibility that WDFY2 may mark a subset of endosomes that serves as a first stage of endocytic transport, operating between the plasma membrane and EEA1-enriched endosomes.
Fig. 4.
WDFY2 marks an endosomal population adjacent to the plasma membrane. Cos-7 cells were cotransfected with RFP-EEA1 (Top) and GFP-WDFY2 (Middle). Cells were imaged by using TIRF-M (Left) and then by epifluorescence (EPI) focusing on planes through the middle of the cell (Center) or at the top of the cell (Right). The regions marked by the red squares are expanded to display the overlap between the red and green signals (Bottom). Note the virtual absence of RFP-EEA1 in the TIRF images, which represent the region within 100 nm of the plasma membrane, and the apparent binding of GFP-WDFY2 containing vesicles onto RFP-EEA1-enriched endosomes seen by epifluorescence (arrow). A similar distribution was seen in cells expressing divergent ratios of WDFY2-GFP and RFP-EEA1 (>1, =1, or <1).
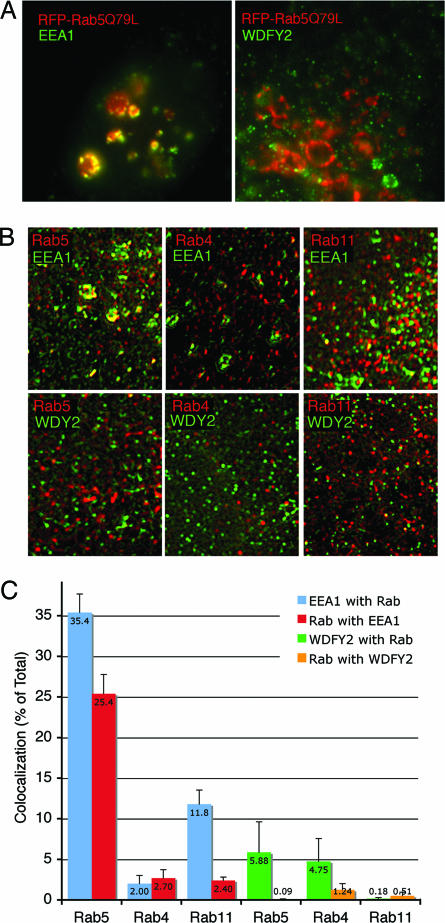
To further test the hypothesis that WDFY2 defines a novel subset of endosomes we compared the effect of Rab5Q79L expression on the localization of endogenous EEA1 and WDFY2. Expression of persistently active mutants of Rab5 (Rab5Q79L) results in enlargement of endosomes containing EEA1 and an almost quantitative recruitment of cellular EEA1 to these endosomes (6, 32). RFP-Rab5Q79L displayed the characteristic distribution into enlarged endosomes and colocalized extensively with endogenous EEA1 (Fig. 5A Left), but not with endogenous WDFY2 (Fig. 5A Right), which remained associated with smaller vesicular structures. To determine whether WDFY2 preferentially associates with another member of the endocytic Rab GTPase family, we measured its colocalization with endogenous Rabs 4, 5, and 11. Some colocalization with all three Rabs was seen in restored images, but it was small (<6%) and not significantly selective for any of these three GTPases (Fig. 5 B and C). In contrast, significant clocalization (>30%) was seen between EEA1 and endogenous Rab5 and to a lower extent between EEA1 and Rab11.
Fig. 5.
Colocalization of WDFY2 with endocytic Rab GTPases. (A) HeLa cells were transiently transfected with RFP-Rab5Q79L (red), and after 24 h they were fixed and stained with antibodies (green) to EEA1 (Left) or WDFY2 (Right). Colocalization is depicted in yellow. (B) Cos-7 cells were fixed and stained with antibodies to WDFY2 or EEA1 (green) and antibodies (red) to Rab5 (Left), Rab4 (Center), and Rab11 (Right). Image stacks were obtained and restored; shown are single 250-nm-thick regions enriched in both signals. Colocalized regions are rendered in yellow. (C) The degree of colocalization of WDFY2 with each Rab, and of each Rab with WDFY2, was determined by using areas of the cell enriched in both signals, such as those shown in B. Colocalization is expressed as the percent of the total fluorescence from WDFY2 or EEA1 colocalizing with each Rab and vice versa. Spurious colocalization was obtained by flipping one of the images along the x axis. The value for spurious colocalization was subtracted from the properly aligned colocalization values. Bars represent the mean, and vertical lines indicate the SEM, from 12 regions (3 regions per cell) obtained from four independent cells. (Magnifications: A, ×2,000; B, ×3,000.)
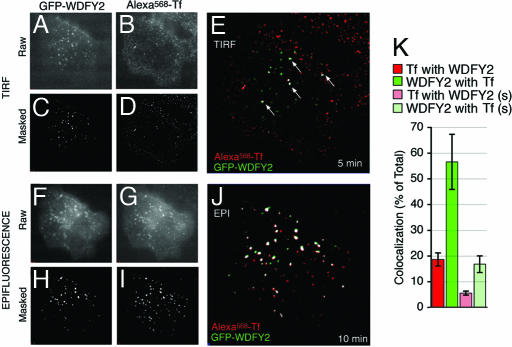
The lack of colocalization with endogenous or transfected, activated Rab5 suggests that WDFY2 marks a set of endosomes that differ functionally from those enriched in EEA1. To determine whether WDFY2-enriched endosomes function in the endocytic pathway of the transferrin (Tf) receptor, we analyzed the binding and early steps of internalization of fluorescent Tf in live HeLa cells stably expressing GFP-WDFY2 by using TIRF-M (33). Within 5 min of addition of Tf to the media, significant colocalization with endosomes enriched with GFP-WDFY2 was seen in the TIRF zone (Fig. 6A–E), which increased over time of continuous incubation with ligand. After 10 min of continuous incubation with Tf, ≈40% of GFP-WDFY2 colocalized with the ligand (Fig. 6F). Colocalization was also seen when the cells were visualized in epifluorescence (Fig. 6 F–J). This degree of colocalization exceeded that seen with GFP-EEA1 (data not shown) and demonstrates that WDFY2 is present in endosomes involved in the early steps of Tf receptor internalization.
Fig. 6.
Trafficking of Tf through WDFY2-containing endosomes. (A–J) HeLa cells stably expressing GFP-WDFY2 were incubated with fluorescent transferrin (Alexa568-Tf) and imaged by TIRF (A–E) and epifluorescence (F–J). TIRF images were obtained after 5 min, and epifluorescence images of the same cell were obtained after 10 min of continuous exposure to Alexa568-Tf. Raw (A, B, F, and G) and masked (C, D, H, and I) images of GFP-WDFY2 (A, C, F, and H) and Alexa568-Tf (B, D, G, and I) are shown. Colocalization between GFP-WDFY2 (green) and Alexa568-Tf (red) is rendered in white in overlaps of the masked images (E and J). Arrows point to colocalized voxels in the TIRF images. (K) The colocalization between Tf and WDFY2 in TIRF images from cells incubated for 10 min in the continuous presence of Tf was quantified. Rectangular areas enriched in both signals were analyzed, and colocalization was expressed as the percent of the total fluorescence from Tf colocalizing with WDFY2 and vice versa. Spurious colocalization was obtained by flipping one of the images along the x axis. Bars and vertical lines represent the mean and standard error of the real (red and green) or spurious (light red and light green) colocalization measured in 10 regions from 10 independent cells. (Magnifications: A–D, ×1,000; F–G, ×2,000.)
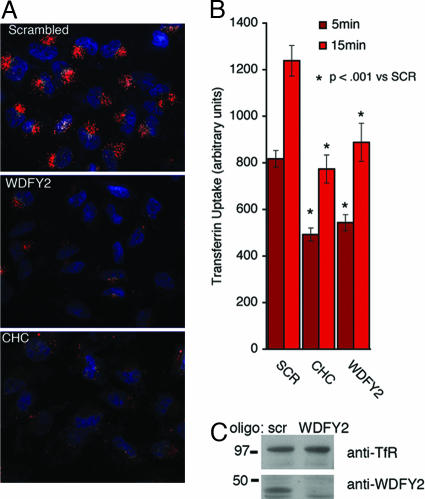
To determine whether WDFY2 is required for Tf uptake we analyzed the effects of disruption of WDFY2 expression by using siRNA. Silencing oligonucleotides to WDFY2 reduced the levels of endogenous WDFY2 mRNA (data not illustrated) and protein (Fig. 7C) by >80%. Cells treated with scrambled siRNA or oligos directed to clathrin or WDFY2 for 48 h were exposed to fluorescent Tf. Tf was detected in >90% of cells treated with scrambled siRNA after 5 min of uptake (Fig. 7A Top). In contrast, the Tf signal was faint or undetectable in >80% of cells treated with siRNA oligos directed to clathrin and strongly diminished in the majority of cells treated with siRNA directed to WDFY2. The total amount of fluorescence associated with lysates of cells incubated for different periods with Alexa594-Tf was determined (Fig. 7B). Although the results of this assay seemed in general less pronounced than those collected from microscopy images, they fully confirm the observation of a comparable inhibition of Tf uptake in response to clathrin or WDFY2 silencing.
Fig. 7.
Inhibition of Tf uptake by silencing of WDFY2. HeLa cells were treated with silencing oligonucleotides to the proteins indicated. (A) Cells were incubated for 5 min with fluorescent Tf, acid-washed to remove noninternalized Tf, fixed, counterstained with DAPI, and visualized. (Magnification: ×200.) (B) Cells were incubated for 5 or 15 min with Tf, acid-washed, and lysed, and total fluorescence in the lysate was quantified. Plotted are the means and SEM of three independent experiments performed in triplicate. (C) Western blots of cell lysates stained with antibodies to the Tf receptor (anti-TfR) or WDFY2.
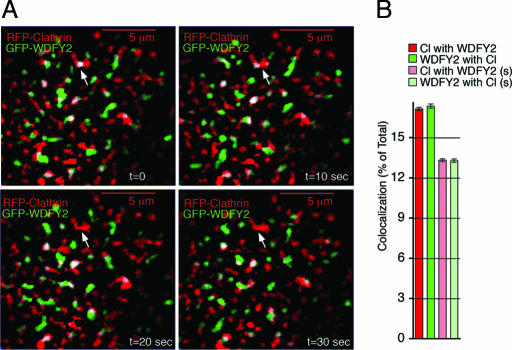
The rapid entry of Tf into WDFY2-enriched structures, and its requirement for Tf internalization raised the possibility that WDFY2 may directly localize to clathrin-coated structures. To determine whether WDFY2 might be localized to clathrin-coated pits or clathrin-coated vesicles, we analyzed cells expressing RFP-clathrin and GFP-WDFY2 by TIRF-M (Fig. 8). As previously shown, clathrin localized to pleomorphic regions at the plasma membrane, many of which displayed little lateral mobility over a 1-min time frame (33–36). Endosomes containing GFP-WDFY2 displayed very different dynamics, undergoing rapid changes in localization caused by both lateral movements and appearance and disappearance from the TIRF zone. Some overlap could be seen between WDFY2 and clathrin-coated membrane regions, indicating that endosomes can localize to regions within 100 nm of clathrin-coated membrane domains. However, the amount of specific colocalization of WDFY2 and clathrin at any given time point was low (≈4%), being almost the same as the colocalization caused by spurious coincidence of the two fluorophores (≈13%), assessed by flipping one of the channels along the x axis (Fig. 8B). Thus, we believe it unlikely that WDFY2-enriched structures close to the plasma membrane represent clathrin-coated pits or budding vesicles, but we do not rule out that a functional relationship may exist in which WDFY2-enriched endosomes may transiently interact with clathrin-coated membrane regions. Further studies simultaneously visualizing clathrin, WDFY2, and endocytic ligands will be necessary to better define the pathway of endocytic cargo from clathrin-coated membrane domains into endosomal populations enriched in specific FYVE-domain-containing proteins.
Fig. 8.
Simultaneous imaging of GFP-WDFY2 and RFP-clathrin. (A) Cos-7 cells cotransfected with GFP-WDFY2 (green) and RFP-clathrin (red) were imaged by TIRF-M. Shown are four time points taken 10 s apart. The arrow indicates a clathrin-coated membrane region colocalizing with WDFY2 in the first time point. Clathrin persists in the region in the four time points shown, but WDFY2 does not. (B) Colocalization is expressed as the percent of total WDFY2 colocalizing with clathrin and clathrin colocalizing with WDFY2. Spurious colocalization was calculated by flipping one image along the x axis and calculating the colocalization as above. Bars and vertical lines represent the mean and standard error values for real (red and green) or spurious (light red and light green) colocalization measured in 1,500 frames from five cells imaged at 0.5 frames per s (300 frames per cell, 10 min total imaging time). Although small, the difference between real and spurious colocalization was statistically significant (P < 0.001, paired two-tailed Student’s t test).
In summary, the results shown here reveal the existence of a set of endosomes in mammalian cells defined by the presence of WDFY2 that participate in the uptake of Tf. Future experiments will determine the mechanisms involved in the biogenesis of these endosomes, their relationship to those containing EEA1, and their possible involvement in stage or cargo-specific endocytic uptake. Ligands such as Tf and EGF are taken up by receptors that differentially interact with diverse microdomains at the plasma membrane, which include clathrin-coated membrane regions and raft-like microdomains (37). The possibility that cargo proteins enriched in these different regions may preferentially be targeted to diverse sets of endosomes is an interesting possibility, supported by the recent identification of heterogeneity of early endosomes based on their motility on microtubules (38). The precise function of WDFY2 in the endocytic pathway is not known, but the simplicity of its structure, consisting only of WD40 motifs and a FYVE domain, suggests it serves to coordinate the interaction between compartments containing PtdIns(3)P and other WD40 motif-binding proteins at one or several stages of the early endocytic pathway. The identification of such proteins will be required to better understand these mechanistic details.
Methods
RNAi Experiments in C. elegans.
The cDNAs encoding for the various FYVE-domain-containing genes were a gift from Yugi Kohara (University of Tokyo, Tokyo, Japan). Some were received as plasmids, and some were received in phage. The cDNAs were excised from the phage. The dsRNA was generated by using the in vitro RNAi transcription kit from Ambion (Austin, TX). L4 to young adult worms were injected, and the progeny of the injected worms were analyzed by phase and fluorescence microscopy.
Constructs.
The cDNA clone MGC:20275 (IMAGE Id 3842598) for the human WDFY2 was obtained from the American Tissue Culture Collection (Manassas, VA) and sequenced fully for verification. The cDNA was then cloned in-frame with a Flag tag or EGFP at the N terminus of the protein by using standard techniques. Clathrin and EEA1 constructs have been described (10, 32, 33).
Immunofluorescence.
Rabbit antibodies to the full-length WDFY2 protein made in bacteria and affinity-purified against full-length WDFY2 were used. Chicken or mouse antibodies to the N terminus of EEA1 were used. Secondary detection was with Alexa-coupled species-specific antibodies obtained from Molecular Probes (Eugene, OR).
Optical Systems.
High-resolution images were generated by using a Zeiss (Thornwood, NY) Axiovert 200 inverted microscope equipped with a Zeiss AxioCam HR CCD camera with 1,300 × 1,030 pixels basic resolution and a Zeiss 100 × 1.40 NA oil-immersion objective. For image restoration, 3D stacks of images spaced by 250 nm were obtained and deconvolved with the super resolution algorithm developed by Carrington et al. (39), resulting in a resolution of 66 nm/pixel. The TIRF microscope has been described in detail (33) and includes a modified Olympus (Center Valley, PA) IX81 inverted microscope, a modified Olympus TIRF fiber illuminator, IX2-RFAEVA, and a high-speed CCD camera developed in collaboration with the Lincoln Laboratory at the Massachusetts Institute of Technology. The objective used is an Olympus Plan APO ×60 objective with an NA of 1.45. Imaging analysis procedures have been described in detail (33).
Cell Culture and Transfection of HeLa or Cos7 Cells.
HeLa or Cos-7 cells were maintained in DMEM supplemented with antibiotics and 10% FCS (Invitrogen, Carlsbad, CA). Expression vectors were transfected into HeLa cells by using FuGENE 6 transfection reagent (Roche Applied Science, Indianapolis, IN).
siRNA Experiments.
siRNA oligonucleotides to the human homolog of the proteins studied were purchased as Smartpools from Dharmacon (Lafayette, CO) and transfected by using HiPerFect (Qiagen, Valencia, CA). Cells were transfected twice according to HiPerFect transfection reagent manual protocol with 100 pmol per well of siRNA oligos at 24-h intervals. Forty-eight hours after the second transfection, cells were serum-starved for 2 h and incubated with Alexa568-Tf (Molecular Probes) at 20 μg/ml for the times indicated. Cells were then placed on ice, washed twice with ice-cold PBS, and incubated for 5 min in acidic buffer (0.2 M acetic acid/0.5 M NaCl in double-distilled H2O) to remove noninternalized Tf. Cells were either fixed for fluorescence microscopy or harvested, centrifuged for 20 min at 1,200 × g at 4°C, resuspended in 100 μl of ice-cold PBS, and added to wells on a 96-well plate. The fluorescence intensity of each well was measured with a plate reader at an excitation/emission wavelength of 594/625. Statistical analyses were done by using two-tailed equal variance Student’s t tests.
Acknowledgments
We thank Kuan-Ju Lai and Isabelle Fay for microinjection and imaging experiments. This work was supported by National Institutes of Health Grants DK54479 and DK60564 (to S.C.). Support for the use of core facilities was through Diabetes Endocrinology Research Center Grant DK32520.
Abbreviations
- PtdIns(3)P
phosphatidylinositol 3-phosphate
- TIRF
total internal reflection fluorescence
- TIRF-M
TIRF microscopy
- Tf
transferrin.
Footnotes
Conflict of interest statement: No conflicts declared.
This paper was submitted directly (Track II) to the PNAS office.
References
- 1.DiNitto J. P., Cronin T. C., Lambright D. G. Sci. STKE. 2003 Dec 16; doi: 10.1126/stke.2132003re16. [DOI] [PubMed] [Google Scholar]
- 2.Misra S., Miller G. J., Hurley J. H. Cell. 2001;107:559–562. doi: 10.1016/s0092-8674(01)00594-3. [DOI] [PubMed] [Google Scholar]
- 3.Patki V., Virbasius J., Lane W. S., Toh B. H., Shpetner H. S., Corvera S. Proc. Natl. Acad. Sci. USA. 1997;94:7326–7330. doi: 10.1073/pnas.94.14.7326. [DOI] [PMC free article] [PubMed] [Google Scholar]
- 4.Gaullier J. M., Simonsen A., D’Arrigo A., Bremnes B., Stenmark H., Aasland R. Nature. 1998;394:432–433. doi: 10.1038/28767. [DOI] [PubMed] [Google Scholar]
- 5.Burd C. G., Emr S. D. Mol. Cell. 1998;2:157–162. doi: 10.1016/s1097-2765(00)80125-2. [DOI] [PubMed] [Google Scholar]
- 6.Simonsen A., Lippe R., Christoforidis S., Gaullier J. M., Brech A., Callaghan J., Toh B. H., Murphy C., Zerial M., Stenmark H. Nature. 1998;394:494–498. doi: 10.1038/28879. [DOI] [PubMed] [Google Scholar]
- 7.Callaghan J., Nixon S., Bucci C., Toh B. H., Stenmark H. Eur. J. Biochem. 1999;265:361–366. doi: 10.1046/j.1432-1327.1999.00743.x. [DOI] [PubMed] [Google Scholar]
- 8.Mu F. T., Callaghan J. M., Steele-Mortimer O., Stenmark H., Parton R. G., Campbell P. L., McCluskey J., Yeo J. P., Tock E. P., Toh B. H. J. Biol. Chem. 1995;270:13503–13511. doi: 10.1074/jbc.270.22.13503. [DOI] [PubMed] [Google Scholar]
- 9.Mills I. G., Urbe S., Clague M. J. J. Cell Sci. 2001;114:1959–1965. doi: 10.1242/jcs.114.10.1959. [DOI] [PubMed] [Google Scholar]
- 10.Lawe D. C., Sitouah N., Hayes S., Chawla A., Virbasius J. V., Tuft R., Fogarty K., Lifshitz L., Lambright D., Corvera S. Mol. Biol. Cell. 2003;14:2935–2945. doi: 10.1091/mbc.E02-09-0591. [DOI] [PMC free article] [PubMed] [Google Scholar]
- 11.McBride H. M., Rybin V., Murphy C., Giner A., Teasdale R., Zerial M. Cell. 1999;98:377–386. doi: 10.1016/s0092-8674(00)81966-2. [DOI] [PubMed] [Google Scholar]
- 12.Rubino M., Miaczynska M., Lippe R., Zerial M. J. Biol. Chem. 2000;275:3745–3748. doi: 10.1074/jbc.275.6.3745. [DOI] [PubMed] [Google Scholar]
- 13.Christoforidis S., McBride H. M., Burgoyne R. D., Zerial M. Nature. 1999;397:621–625. doi: 10.1038/17618. [DOI] [PubMed] [Google Scholar]
- 14.Mills I. G., Jones A. T., Clague M. J. Curr. Biol. 1998;8:881–884. doi: 10.1016/s0960-9822(07)00351-x. [DOI] [PubMed] [Google Scholar]
- 15.Nielsen E., Christoforidis S., Uttenweiler-Joseph S., Miaczynska M., Dewitte F., Wilm M., Hoflack B., Zerial M. J. Cell Biol. 2000;151:601–612. doi: 10.1083/jcb.151.3.601. [DOI] [PMC free article] [PubMed] [Google Scholar]
- 16.Cormont M., Mari M., Galmiche A., Hofman P., Le Marchand-Brustel Y. Proc. Natl. Acad. Sci. USA. 2001;98:1637–1642. doi: 10.1073/pnas.031586998. [DOI] [PMC free article] [PubMed] [Google Scholar]
- 17.Komada M., Soriano P. Genes Dev. 1999;13:1475–1485. doi: 10.1101/gad.13.11.1475. [DOI] [PMC free article] [PubMed] [Google Scholar]
- 18.Katzmann D. J., Stefan C. J., Babst M., Emr S. D. J. Cell Biol. 2003;162:413–423. doi: 10.1083/jcb.200302136. [DOI] [PMC free article] [PubMed] [Google Scholar]
- 19.Dove S. K., Piper R. C., McEwen R. K., Yu J. W., King M. C., Hughes D. C., Thuring J., Holmes A. B., Cooke F. T., Michell R. H., et al. EMBO J. 2004;23:1922–1933. doi: 10.1038/sj.emboj.7600203. [DOI] [PMC free article] [PubMed] [Google Scholar]
- 20.Cooke F. T., Dove S. K., McEwen R. K., Painter G., Holmes A. B., Hall M. N., Michell R. H., Parker P. J. Curr. Biol. 1998;8:1219–1222. doi: 10.1016/s0960-9822(07)00513-1. [DOI] [PubMed] [Google Scholar]
- 21.Odorizzi G., Babst M., Emr S. D. Cell. 1998;95:847–858. doi: 10.1016/s0092-8674(00)81707-9. [DOI] [PubMed] [Google Scholar]
- 22.Tsukazaki T., Chiang T. A., Davison A. F., Attisano L., Wrana J. L. Cell. 1998;95:779–791. doi: 10.1016/s0092-8674(00)81701-8. [DOI] [PubMed] [Google Scholar]
- 23.Hu Y., Chuang J. Z., Xu K., McGraw T. G., Sung C. H. J. Cell Sci. 2002;115:4755–4763. doi: 10.1242/jcs.00177. [DOI] [PMC free article] [PubMed] [Google Scholar]
- 24.Runyan C. E., Schnaper H. W., Poncelet A. C. J. Biol. Chem. 2005;280:8300–8308. doi: 10.1074/jbc.M407939200. [DOI] [PubMed] [Google Scholar]
- 25.Nonet M. L., Grundahl K., Meyer B. J., Rand J. B. Cell. 1993;73:1291–1305. doi: 10.1016/0092-8674(93)90357-v. [DOI] [PubMed] [Google Scholar]
- 26.Nonet M. L., Holgado A. M., Brewer F., Serpe C. J., Norbeck B. A., Holleran J., Wei L., Hartwieg E., Jorgensen E. M., Alfonso A. Mol. Biol. Cell. 1999;10:2343–2360. doi: 10.1091/mbc.10.7.2343. [DOI] [PMC free article] [PubMed] [Google Scholar]
- 27.Grant B., Hirsh D. Mol. Biol. Cell. 1999;10:4311–4326. doi: 10.1091/mbc.10.12.4311. [DOI] [PMC free article] [PubMed] [Google Scholar]
- 28.Fares H., Greenwald I. Genetics. 2001;159:133–145. doi: 10.1093/genetics/159.1.133. [DOI] [PMC free article] [PubMed] [Google Scholar]
- 29.Sieburth D., Ch’ng Q., Dybbs M., Tavazoie M., Kennedy S., Wang D., Dupuy D., Rual J. F., Hill D. E., Vidal M., et al. Nature. 2005;436:510–517. doi: 10.1038/nature03809. [DOI] [PubMed] [Google Scholar]
- 30.Ridley S. H., Ktistakis N., Davidson K., Anderson K. E., Manifava M., Ellson C. D., Lipp P., Bootman M., Coadwell J., Nazarian A., et al. J. Cell Sci. 2001;114:3991–4000. doi: 10.1242/jcs.114.22.3991. [DOI] [PubMed] [Google Scholar]
- 31.Axelrod D. Methods Enzymol. 2003;361:1–33. doi: 10.1016/s0076-6879(03)61003-7. [DOI] [PubMed] [Google Scholar]
- 32.Lawe D. C., Patki V., Heller-Harrison R., Lambright D., Corvera S. J. Biol. Chem. 2000;275:3699–3705. doi: 10.1074/jbc.275.5.3699. [DOI] [PubMed] [Google Scholar]
- 33.Bellve K. D., Leonard D., Standley C., Lifshitz L. M., Tuft R. A., Hayakawa A., Corvera S., Fogarty K. E. J. Biol. Chem. 2006;281:16139–16146. doi: 10.1074/jbc.M511370200. [DOI] [PubMed] [Google Scholar]
- 34.Merrifield C. J., Perrais D., Zenisek D. Cell. 2005;121:593–606. doi: 10.1016/j.cell.2005.03.015. [DOI] [PubMed] [Google Scholar]
- 35.Moskowitz H. S., Yokoyama C. T., Ryan T. A. Mol. Biol. Cell. 2005;16:1769–1776. doi: 10.1091/mbc.E04-08-0739. [DOI] [PMC free article] [PubMed] [Google Scholar]
- 36.Rappoport J. Z., Simon S. M., Benmerah A. Traffic. 2004;5:327–337. doi: 10.1111/j.1398-9219.2004.00187.x. [DOI] [PubMed] [Google Scholar]
- 37.Puri C., Tosoni D., Comai R., Rabellino A., Segat D., Caneva F., Luzzi P., Di Fiore P. P., Tacchetti C. Mol. Biol. Cell. 2005;16:2704–2718. doi: 10.1091/mbc.E04-07-0596. [DOI] [PMC free article] [PubMed] [Google Scholar]
- 38.Lakadamyali M., Rust M. J., Zhuang X. Cell. 2006;124:997–1009. doi: 10.1016/j.cell.2005.12.038. [DOI] [PMC free article] [PubMed] [Google Scholar]
- 39.Carrington W. A., Lynch R. M., Moore E. D., Isenberg G., Fogarty K. E., Fay F. S. Science. 1995;268:1483–1487. doi: 10.1126/science.7770772. [DOI] [PubMed] [Google Scholar]


