Abstract
Compartmentation and dynamics of cAMP and PKA signaling are important determinants of specificity among cAMP’s myriad cellular roles. Both cardiac inotropy and the progression of heart disease are affected by spatiotemporal variations in cAMP/PKA signaling, yet the dynamic patterns of PKA-mediated phosphorylation that influence differential responses to agonists have not been characterized. We performed live-cell imaging and systems modeling of PKA-mediated phosphorylation in neonatal cardiac myocytes in response to G-protein coupled receptor stimuli and UV photolysis of “caged” cAMP. cAMP accumulation was rate-limiting in PKA-mediated phosphorylation downstream of the β-adrenergic receptor. Prostaglandin E1 stimulated higher PKA activity in the cytosol than at the sarcolemma, whereas isoproterenol triggered faster sarcolemmal responses than cytosolic, likely due to restricted cAMP diffusion from submembrane compartments. Localized UV photolysis of caged cAMP triggered gradients of PKA-mediated phosphorylation, enhanced by phosphodiesterase activity and PKA-mediated buffering of cAMP. These findings indicate that combining live-cell FRET imaging and mechanistic computational models can provide quantitative understanding of spatiotemporal signaling.
Keywords: fluorescence imaging, models, signal transduction
Intracellular signaling through cAMP and its cAMP-dependent protein kinase (PKA) mediates hundreds of distinct cellular functions. Compartmentation and dynamics of cAMP/PKA signaling are gaining increasing acceptance as general mechanisms used to maintain signaling specificity in a context-dependent manner. In the heart, compartmentation appears to contribute to functional differences between β1- and β2-adrenergic signaling and other stimuli that increase cAMP and thus has important consequences for understanding the role of β-adrenergic signaling in the development and treatment of heart failure (1, 2). Short-term β-adrenergic signaling increases heart contractility (3), whereas prolonged exposure to β1-adrenergic agonists induces apoptosis (4). Recent live-cell imaging and electrophysiologic approaches are now providing direct measurements of compartmentation (5, 6) and cAMP signaling dynamics (7–10) in intact cells, and our increasing molecular understanding provides numerous candidate molecular mechanisms for compartmentation including caveolae (2, 11), β-arrestins (12, 13), and A-kinase anchoring proteins (AKAPs) (14, 15). A future challenge will be to understand quantitatively how these molecular signaling mechanisms orchestrate such precise context-dependent signaling in the cell.
Here, we integrate fluorescent reporters of PKA-mediated phosphorylation (16) and mechanistic computational models to characterize rate-limiting biochemical reactions in β-adrenergic signaling and identify signaling mechanisms contributing to asynchronous and spatially heterogeneous PKA-mediated phosphorylation. This combination of techniques reveals restricted diffusion, phosphodiesterase (PDE)-mediated cAMP degradation, and cAMP buffering by PKA as important contributors to PKA-mediated phosphorylation gradients.
Results
Imaging PKA Activity Dynamics in Neonatal Cardiac Myocytes.
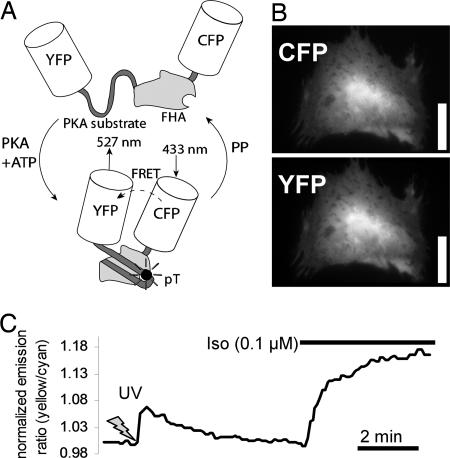
A-kinase activity reporter 2 (AKAR2) has been shown to act as a specific, real-time indicator of PKA-mediated phosphorylation in other cells (16, 17). We transfected neonatal rat cardiac myocytes with AKAR2 (Fig. 1A), which distributed evenly throughout the cytosol, slightly more concentrated in the nucleus (Fig. 1B). As shown in Fig. 1C, uncaging 50 μM 4,5-dimethoxy-2-nitrobenzyl (DMNB)-cAMP with a 5-s UV exposure produced a rapid and robust increase in AKAR2 emission ratio (tMAX = 12.0 ± 1.5 s, R/Ro = 1.079 ± 0.004, n = 5) followed by AKAR2 dephosphorylation as cAMP is hydrolyzed (t1/2 = 114 ± 6 s). To assess the extent of PKA activation caused by the uncaged DMNB-cAMP, we next applied 0.1 μM isoproterenol (Iso), which induced high levels of PKA-mediated phosphorylation (R/Ro = 1.18 ± 0.01, n = 9). These steps demonstrate the reversibility and dynamic range of AKAR2 in cardiac myocytes.
Fig. 1.
Expression and function of the AKAR2 in neonatal rat cardiac myocytes. (A) Schematic of AKAR2, with FRET from cyan fluorescent protein (CFP) to yellow fluorescent protein (YFP) upon phosphorylation by PKA leading to an increase in yellow/cyan emission ratio. (B) Expression and cytosolic distribution of AKAR2 in a neonatal rat cardiac myocyte. (Scale bar: 25 μm.) (C) AKAR2 emission ratios with 50 μM DMNB-caged cAMP (5-s UV activation) followed by 0.1 μM Iso.
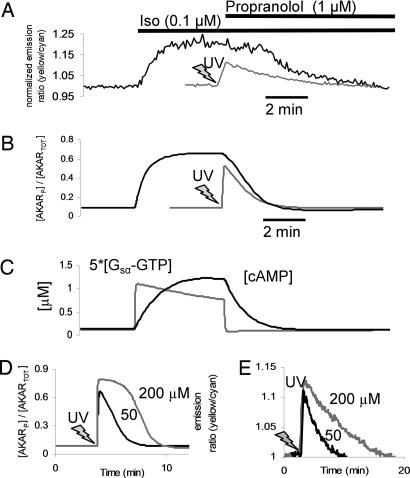
Compared with the rapid response to DMNB-cAMP uncaging, AKAR2 emission ratio changes after 0.1 μM Iso were more gradual (t1/2 = 33 ± 0.8 s, n = 9, P < 0.05; Fig. 2A) with no measurable delay. These data allow estimation of some underlying signaling kinetics. Because of no measurable lag in Iso response, β-adrenergic receptor (β-AR) and Gs appear to activate with t1/2 < 5 s, consistent with previous measurements of G protein kinetics in live cells (18, 19). From DMNB-cAMP uncaging experiments, PKA is activated and phosphorylates AKAR2 with t1/2 ≈ 5 s. Given the t1/2 of 33 s for the Iso-stimulated AKAR2 response, we estimate a lower bound for cAMP accumulation t1/2 as 33 − 5 − 5 = 23 s. These estimates are consistent with time courses from a mechanistic computational model of β-adrenergic signaling (see Methods and Fig. 2 B and C) and suggest that cAMP accumulation near PKA may limit the rate of response to β-AR agonists.
Fig. 2.
PKA-mediated phosphorylation/dephosphorylation kinetics and underlying mechanisms. (A and B) Representative AKAR2 response to 0.1 μM Iso followed by 1 μM propranolol (black line) compared with 50 μM DMNB-caged cAMP (gray line, 5 s UV) in experiment (A) and a mechanistic computational model of β-adrenergic signaling dynamics and AKAR2 phosphorylation (B). (C) Model [Gsα–GTP] and [cAMP] kinetics underlying the response to Iso and propranolol. Gsα–GTP hydrolysis occurred too quickly to explain differences between rates of DMNB-caged cAMP and propranolol-induced dephosphorylation seen in A. (D and E) High [cAMP] saturates PKA and delays AKAR2 dephosphorylation as demonstrated by comparing 50 and 200 μM DMNB-cAMP in the model (D) and validated experimentally (E).
Subsequent blockade of β-ARs with 1 μM propranolol produced a more delayed and prolonged AKAR2 dephosphorylation (t1/2 = 246 ± 11 s, n = 5, P < 0.05) than seen with DMNB-cAMP (Fig. 2A) or in model predictions (Fig. 2B). A computational analysis of rate-limiting steps can identify which mechanisms are most likely to contribute to such a difference (see Tables 1 and 2, which are published as supporting information on the PNAS web site). Model predictions of β-AR and G-protein kinetic responses to propranolol were much faster than the AKAR2 response to propranolol (hydrolysis of activated Gsα–GTP with t1/2 = 2 s; Fig. 2C), showing that upstream mechanisms are unlikely to contribute. A rate-limiting role for protein phosphatases (PPs) could be probed experimentally by rapid inhibition of PKA. However, 8–8-(4-chlorophenylthio)-cAMPS [8–8-(CPT)-cAMPS], a stimulatory analog of the most membrane-permeable PKA inhibitor (Rp-8-CPT-cAMPS), exhibited a t1/2 of 6.7 min (see Fig. 7, which is published as supporting information on the PNAS web site), suggesting that sufficiently rapid PKA inhibition (seconds) is currently infeasible. Fifty percent inhibition of the model’s PDE activity increased AKAR dephosphorylation t1/2 by 265%, whereas 50% inhibition of PP activity increased t1/2 by only 22%, showing that PDE activity may sensitively affect AKAR2’s response to propranolol. Consistent with this observation, simulations of 50 and 200 μM DMNB-cAMP uncaging (15 s UV; Fig. 2D) showed similar magnitudes of AKAR2 phosphorylation yet different dephosphorylation rates, suggesting that the time required to degrade PKA-saturating levels of cAMP may delay AKAR2 dephosphorylation. This model-guided hypothesis was validated experimentally by comparing responses with 50 μM (t1/2 = 99 ± 4 s, n = 7) and 200 μM DMNB-cAMP (t1/2 = 162 ± 12 s, n = 5, P < 0.05; Fig. 2E).
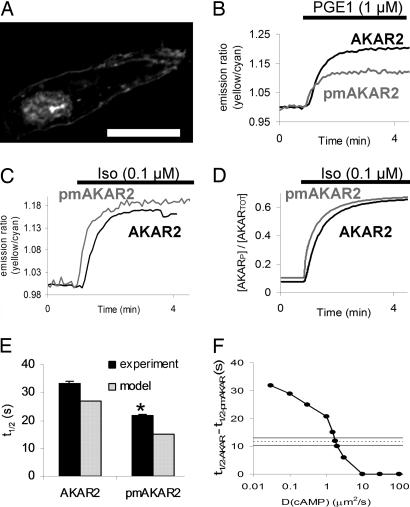
To gain insight into possible differences in PKA activity patterns at the membrane compared with the cytosol, we used a variant of AKAR2, plasma membrane-targeted AKAR2 (pmAKAR2), in which several lysines and a lipid modification domain from the small G protein Rho (KKKKKSGCLVL) were incorporated at the C-terminal end of AKAR2. pmAKAR2 expressed in neonatal cardiac myocytes was targeted to the plasma membrane with some nuclear localization (Fig. 3A; see also Fig. 8, which is published as supporting information on the PNAS web site). Prostaglandin E1 (PGE1) has been shown to elevate soluble cAMP in vitro yet not activate particulate PKA or have a positive inotropic effect on the heart (20). We found that in response to 1 μM PGE1, cells expressing the cytosolic AKAR2 had larger and slower emission ratio changes than cells expressing the pmAKAR2 (R/Ro = 1.22 ± 0.01, n = 3, vs. 1.10 ± 0.01, n = 4, P < 0.05; t1/2 35 ± 3 vs. 23 ± 1, P < 0.05; Fig. 3B). This effect was not due to a possible difference in local concentration of AKAR2, because 0.1 μM Iso exhibited similar magnitude responses for AKAR2 and pmAKAR2 (R/Ro 1.18 ± 0.01, n = 9 vs. R/Ro 1.15 ± 0.01, n = 9).
Fig. 3.
Differential cytosolic and plasma membrane-associated PKA phosphorylation dynamics. (A) Confocal image of pmAKAR2 in a live neonatal cardiac myocyte. (Scale bar: 20 μm.) (B) PGE1 (1 μM) displayed greater efficacy for cytosolic AKAR2 phosphorylation than pmAKAR2 phosphorylation. (C and D) AKAR2 response to 0.1 μM Iso was delayed compared with pmAKAR2 in the experiment (C) and a two-compartment model with reduced apparent cAMP diffusion (DcAMP = 2 μm2/s) (D). (E) Summary of experiments as in C compared with the model. ∗, P < 0.05 vs. AKAR2 experiment. (F) Sensitivity of half-rise time delay (Δt1/2) with respect to DcAMP in the two-compartment model, where the horizontal lines represent the experimental mean ± SEM from E.
However, the Iso-induced response of AKAR2 was delayed compared with pmAKAR2 (t1/2 = 33 ± 1 s vs. 22 ± 1 s, P < 0.05; Fig. 3C and see also Fig. 9, which is published as supporting information on the PNAS web site). This delay appeared unlikely to be mediated by PKA catalytic subunit diffusion from membrane to cytosol, because PGE1 stimulation was able to produce large increases in cytosolic phosphorylation without a corresponding increase in membrane activity. Neither response magnitude nor response time to Iso correlated with AKAR2 or pmAKAR2 expression level (Fig. 9). Thus, we hypothesized that an apparent restricted diffusion of cAMP from the membrane to the cytosol may explain the observed delay in cytosolic AKAR2 emission ratio compared with pmAKAR2. We examined this hypothesis in a simple, two-compartment extension of our above computational model (see Methods), in which cAMP is generated in a membrane compartment and can either activate membrane-bound PKA or diffuse to the cytosol to activate cytosolic PKA. With this model, an apparent diffusion coefficent DcAMP = 2 μm2/s produced a delay between membrane and cytosolic phosphorylation similar to that seen experimentally (Fig. 3 D and E). This diffusion coefficient is much smaller than the previously measured DcAMP = 270 μm2/s in the cytosol of frog olfactory cilia (21). We found that this membrane–cytosol phosphorylation delay was very sensitive to changes in the model parameter DcAMP (Fig. 3F; see also Fig. 10, which is published as supporting information on the PNAS web site), with apparent diffusion coefficients lower or higher than 2 μm2/s producing much larger or smaller phosphorylation delays than observed experimentally. Phosphorylation delays were insensitive to varied membrane targeting of PDE except at very low diffusion rates (DcAMP 0.1 μm2/s) (see Fig. 11, which is published as supporting information on the PNAS web site).
Imaging PKA-Mediated Phosphorylation Gradients.
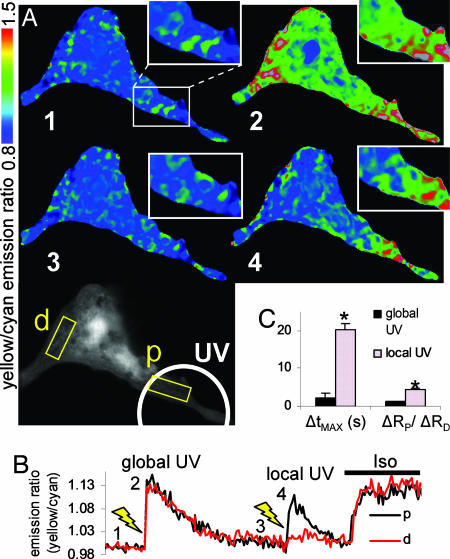
To test whether local cAMP can generate gradients of PKA-mediated phosphorylation in a single cell, we modified our DMNB–cAMP uncaging technique by limiting UV exposure to a defined portion of the cell. Local activation of signaling complements the previous approach of genetically targeting the FRET sensor. Fig. 4A Bottom depicts a representative myocyte, where the white circle denotes the local UV illumination region and the ends of the cell proximal (p) and distal (d) to this activation site are labeled. In each cell, a global 5-s UV exposure was given to demonstrate functional response to DMNB–cAMP throughout the cell [Fig. 4A Right Top (image 2)]. Once the AKAR2 emission ratio returned to baseline, a local 5-s UV exposure was given only to the proximal end of the cell. Local uncaging of DMNB-cAMP produced a gradient of PKA-mediated phosphorylation with a delay in peak response at the distal compared with the proximal end [Fig. 4A Right Middle (image 4)]. The approximate time course of these responses and results of subsequent exposure to 0.1 μM Iso are shown in Fig. 4B. We quantified the phosphorylation propagation time as ΔtMAX = tDMAX − tPMAX and the magnitude of the phosphorylation gradients as ΔRP/ΔRD = (RPMAX − RPMIN)/(RDMAX − RDMIN). Quantitation of phosphorylation gradient magnitude as ΔRP/ΔRD, similar to that used in ref. 6, facilitates comparison of compartmentation with other experiments and with computational models. We observed significantly larger propagation delays [ΔtMAX = 20 ± 1 s, n = 5 (local uncaging) vs. 1 ± 0.3 s, n = 5 (global uncaging), P < 0.05] and phosphorylation gradients due to local uncaging compared with global uncaging [ΔRP/ΔRD = 4.5 ± 0.4, n = 8 (local uncaging) vs. 1.3 ± 0.1, n = 8 (global uncaging), P < 0.05; Fig. 4C].
Fig. 4.
PKA-mediated phosphorylation gradients generated by local uncaging of DMNB–cAMP. (A) Sequence of emission ratio images after global uncaging of 50 μM DMNB–cAMP (whole-cell 5-s UV exposure), local uncaging (5-s UV exposure restricted to white circle), and 0.1 μM Iso; times are indicated in B. p, proximal; d, distal. (Scale bar: 25 μm.) (B) Emission ratio time course from regions proximal and distal to the local uncaging site. (C) Summary of experiments comparing phosphorylation propagation time from proximal to distal ends (ΔtMAX) and phosphorylation gradient magnitude [ΔRP/ΔRD = (RPMAX − RPMIN)/(RDMAX − RDMIN)] for global and local uncaging stimuli. ∗, P < 0.05 vs. global UV.
Modeling PKA-Mediated Phosphorylation Gradients.
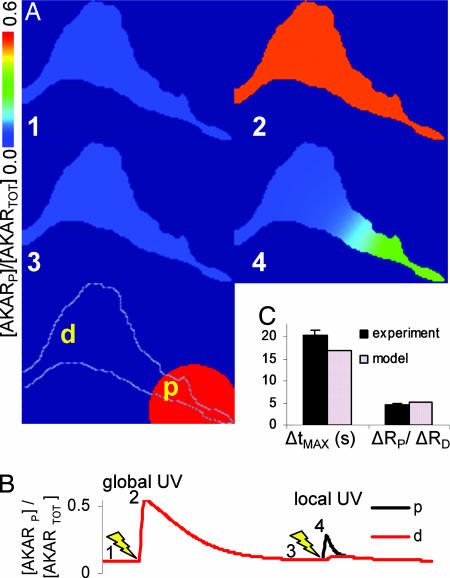
To examine signaling mechanisms contributing to such PKA-mediated phosphorylation gradients, we created a 2D version of our model of cAMP signaling by using geometry from individual myocytes (see Methods). By using an apparent diffusion coefficient DcAMP = 200 μm2/s, approximately that measured in the cytosol of simple cells (21), we simulated a local 5-s UV exposure as done in the imaging experiments above. As seen from the phosphorylation images (Fig. 5A), time courses (Fig. 5B), and quantitative comparison of phosphorylation propagation time (ΔtMAX = 17 s) and gradient magnitude (ΔRP/ΔRD = 5.0; Fig. 5C), our model predicted similar dynamics and phosphorylation gradients to those seen experimentally. These similarities between model and experiment suggested that the model may capture many of the essential mechanisms responsible for the observed PKA-mediated phosphorylation gradients.
Fig. 5.
PKA-mediated phosphorylation gradients in a 2D computational model of local DMNB–cAMP uncaging (DcAMP = 200 μm2/s). (A) AKAR phosphorylation images after global uncaging and then local uncaging (5-s UV activation restricted to red circle, timepoints indicated in B). p, proximal; d, distal. (B) Emission ratio time course from regions proximal and distal to the local uncaging site. (C) Model validation of propagation time (ΔtMAX) and gradient magnitude (ΔRP/ΔRD) for local DMNB–cAMP uncaging.
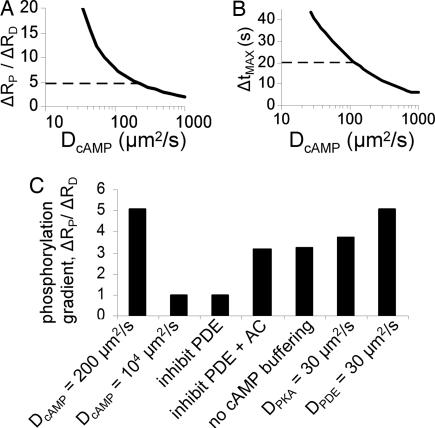
We next used our spatial model to test the role of individual signaling mechanisms toward the generation of PKA-mediated phosphorylation gradients. We began by examining the sensitivity of variation in DcAMP on phosphorylation gradient magnitude ΔRP/ΔRD (Fig. 6A) and propagation time ΔtMAX (Fig. 6B) after local uncaging. Although a wide range of diffusion coefficients could produce phosphorylation gradients and propagation delays, only DcAMP near 200 μm2/s could produce both propagation delays and gradients consistent with the experimental measurements. Increasing DcAMP to an unrealistically high 104 μm2/s in the model completely eliminated compartmentation (Fig. 6B), verifying a critical role for nonrapid diffusion in creating signaling gradients.
Fig. 6.
Model predictions of mechanisms contributing to PKA-mediated phosphorylation gradients. (A and B) Sensitivity of predicted gradient magnitude (ΔRP/ΔRD) (A) and propagation time (ΔtMAX) (B) to variation in DcAMP, where dashed lines are experimental means from Fig. 4C. (C) Comparison of predicted gradients (ΔRP/ΔRD) for the baseline model (DcAMP = 200 μm2/s, as in Fig. 5) and several model perturbations that test mechanisms contributing to PKA-mediated phosphorylation gradients.
Consistent with many other studies of cAMP compartmentation (5–7), our model simulations predicted inhibition of PDEs to greatly decrease PKA-mediated phosphorylation gradients (ΔRP/ΔRD from 5.0 to 1.0; Fig. 6B). Model analysis suggested two distinct roles for PDEs in phosphorylation gradients: (i) restricting basal [cAMP] and (ii) directly enhancing signaling gradients by providing a “sink” for cAMP separated from the “source” of cAMP. PDE inhibition with 1 mM 3-isobutyl-methylxanthine (IBMX) raised basal cAMP considerably in both model and experiment due to high basal adenylyl cyclase (AC) activity, such that a direct role for PDEs in enhancing signaling gradients could not be observed. However, we found that simultaneous inhibition of AC and PDE in the model produced an intermediate compartmentation magnitude (ΔRP/ΔRD = 3.2), which could be attributed to the direct role for PDEs in compartmentation independent of basal [cAMP]. Consistent with previous studies using P-site AC inhibitors in cardiac myocytes (22), the P-site AC inhibitor MDL-12,330A was unable to inhibit basal AC activity (data not shown), so we have not yet validated this hypothesis experimentally.
Buffered cAMP (PKA-bound cAMP protected from PDE catalysis) comprises a significant proportion of total basal [cAMP] (23, 24) and has been predicted to stabilize basal [cAMP] near a region of maximal PKA sensitivity (25). In our simulations, eliminating cAMP buffering reduced PKA-mediated phosphorylation gradients by 46% (Fig. 6B), suggesting that cAMP buffering may contribute significantly to cAMP/PKA compartmentation. We had assumed that the relevant signaling proteins diffused much more slowly than cAMP in the 2D model. By relaxing this assumption for PKA and PDE, we tested the contributions of PKA anchoring and PDE scaffolding, respectively, to PKA-mediated phosphorylation gradients. An apparent diffusion coefficient DPKA = 30 μm2/s reduced gradients somewhat (ΔRP/ΔRD = 3.8), whereas DPDE = 30 μm2/s or DAKAR = 30 μm2/s did not appreciably reduce phosphorylation gradient magnitude (ΔRP/ΔRD = 5.1 or 4.6).
Discussion
Integrating live-cell imaging and mechanistic computational models may facilitate quantitative understanding of how dynamics and compartmentation contribute to the function of cell-signaling networks. Here, we used a FRET reporter of PKA activity, AKAR2, and computational models to investigate mechanisms underlying PKA signaling dynamics and compartmentation in the neonatal cardiac myocyte. Combining experimental perturbations and model analysis allowed estimation of kinetics for Gs activation, cAMP accumulation, and PKA-mediated phosphorylation, revealing cAMP accumulation near PKA as a rate-limiting step in response to β-AR agonists in this system. AKAR2 dephosphorylation rates, consistent with measured dephosphorylation rates of troponin I and C-protein (26), revealed that saturation of PKA with cAMP can delay substrate dephosphorylation, indicating a capacity for cAMP synthesis greatly exceeding the requirements for PKA activation. This hypothesis is consistent with observed cAMP “spill-over” from the particulate to the soluble fraction of cardiac myocyte homogenates (24, 27). However, Iso-stimulated phosphatase inhibition may also contribute to decreased dephosphorylation rates (28).
Compared with cells expressing the cytosolic PKA activity sensor AKAR2, response to PGE1 in cells expressing the membrane-tagged PKA activity sensor pmAKAR2 was markedly reduced, suggesting that PGE1 receptors are not well coupled functionally to PKA substrates at the plasma membrane. This finding is consistent with both functional data and molecular evidence suggesting that prostaglandin receptors may be excluded from caveolae of cardiac myocytes, where β-ARs and their downstream targets appear concentrated (2, 29). Iso caused similar increases in yellow/cyan emission ratio for both cytosolic and membrane-tagged PKA sensors, yet cytosolic responses to both PGE1 and Iso were delayed. Model analysis suggested that such phosphorylation asynchrony may arise from restricted cAMP diffusion between the plasma membrane and cytosol (9), a hypothesis consistent with faster cAMP accumulation at the plasma membrane than cytosol as reported in cell lines (9, 10). Simulated phosphorylation delays were much more sensitive to DcAMP than to AC, PDE, or PKA expression levels. However, subcellular mechanisms responsible for such restricted diffusion are unclear. Although physical submembrane microdomains abound in cardiac myocytes, calcium diffuses from these microdomains to the cytosol of cardiac myocytes on a millisecond timescale (3). These data show that PKA signaling may generate both spatially heterogeneous and asynchronous phosphorylation signals.
Although we did not find striated patterns of PKA-mediated phosphorylation with AKAR2 or pmAKAR2 in response to uniform β-AR stimulation as reported for cAMP (5), we did observe gradients of PKA-mediated phosphorylation in response to local uncaging of DMNB–cAMP. This result confirms that cAMP compartmentation can facilitate gradients in PKA-mediated phosphorylation, a necessary step toward mediating functional diversity of PKA signaling. We probed the mechanistic requirements for the observed PKA-mediated phosphorylation gradients by using a computational model with 2D geometry from individual cardiac myocytes. Surprisingly, an apparent diffusion coefficient DcAMP = 200 μm2/s, close to that measured in the cytosol of simple cells (21), produced phosphorylation gradients and propagation times similar to those seen experimentally. Large increases in the model’s DcAMP eliminated PKA-mediated phosphorylation gradients, demonstrating a critical role for diffusion in compartmentation. The dissimilar apparent diffusion coefficients predicted for Iso-induced membrane/cytosol delays (DcAMP = 2 μm2/s), and local uncaging-induced phosphorylation gradients (DcAMP = 200 μm2/s) suggest that the most restrictive diffusional barriers may be close to the membrane, with much less restriction in the cytosol.
In addition to diffusional restriction, we quantitatively characterized two molecular mechanisms contributing to PKA-mediated phosphorylation gradients. The first, PDEs, are perhaps the most recognized contributor to cAMP compartmentation (2, 5, 6). Although PDE inhibition with 3-isobutyl-methylxanthine reduced phosphorylation gradients in both model and experiment, it did so by elevating [cAMP] globally because of the high basal activity of AC. Such an effect obscures a direct role for PDEs in compartmentation. In frog ventricular myocytes, PDE inhibition alone did not elevate calcium currents (6), suggesting a low basal AC activity. But in mammalian cardiac myocytes, basal AC activity appears difficult to eliminate specifically because P-site inhibitors only block stimulated AC (22). Inhibiting both AC and PDE in the model unmasked a direct role for PDEs in enhancing PKA-mediated phosphorylation gradients. PDEs enhanced phosphorylation gradients by providing a sink for cAMP spatially separated from its source. A role for PDEs was prominent even with homogeneous distribution of PDE, with and without PDE anchoring. PDEs contributed most to compartmentation at very low cAMP diffusion rates or over long cAMP diffusion distances.
A second molecular mechanism for compartmentation was provided by PKA-mediated buffering of cAMP (23, 24), which was previously predicted to stabilize basal [cAMP] near a region of maximal PKA sensitivity (25). In the context of cAMP/PKA signaling gradients, cAMP binding to PKA reduced cAMP diffusion due to the low diffusivity of PKA. cAMP buffering appears somewhat analogous to the role of Ca2+ buffers in modulating Ca2+ concentrations and waves (30), yet binding cAMP additionally induces activation of PKA. Given a role for PKA-mediated cAMP buffering in compartmentation, overexpression of PKA may have exaggerated previously measured cAMP gradients (5).
Although the models help reveal mechanisms from our live-cell imaging data, they also clarify how much there is yet to explain. Differences between our PGE1 and Iso responses suggest heterogeneity and compartmentation within the plasma membrane. However, only a small number of membrane microdomains, such as caveolae, have been identified (2). Our measurement and analysis of PKA-mediated gradients suggest that additional molecular mechanisms may be needed to restrict cAMP compartmentation to <2 μM as observed by Zaccolo and Pozzan (5). Such signaling compartmentation may reside at the level of protein complexes (15), yet our current models are not appropriate for molecular-length scales. Although our models showed that phosphorylation gradients can allow sensitive indirect estimates of cAMP signaling, direct cAMP measurements will be needed to validate such model predictions. Complex interactions with the cytoskeleton may also contribute to cAMP/PKA compartmentation, as recently shown for Src signaling (31). Given this importance of subcellular structure in signaling, live-cell imaging of adult cardiac myocytes (8, 32), more highly differentiated than the neonatal myocytes studied here, will be needed to understand signaling compartmentation in the adult heart.
In summary, we found cAMP accumulation/degradation to limit the rate of β-AR signaling in neonatal cardiac myocytes, which may limit responsiveness in cardiac inotropy. Restricted cAMP diffusion can facilitate asynchronous phosphorylation of membrane-bound and cytosolic PKA substrates, providing a mechanism for functional heterogeneity in response to a uniform β-AR stimulus. Cardiac myocytes produced gradients of PKA-mediated phosphorylation in response to local cAMP generation, direct evidence of compartmentation at the level of protein phosphorylation. These phosphorylation gradients were produced predominantly by restricted cAMP diffusion, PDE-mediated cAMP degradation, and PKA-mediated cAMP buffering.
Methods
Cell Culture.
Neonatal cardiac myocytes were isolated from the ventricles of 1- to 2-day-old Sprague–Dawley rats by using the Neomyts isolation kit (Cellutron, Highland Park, NJ) and cultured on 35-mm glass-bottom dishes (MatTek Corp., Ashland, MA). Myocytes were transfected with AKAR2 (16, 17) 1 day after isolation by using FuGene6 transfection reagent (Roche Diagnostics, Indianapolis, IN) and imaged 2 days after transfection (≈5% transfection efficiency). AKAR2 is a recombinant protein composed of the yellow (YFP) and cyan (CFP) mutants of GFP, a PKA substrate, and a phosphothreonine-binding domain. PKA-mediated phosphorylation of AKAR2 increases FRET from CFP to YFP, allowing real-time fluorescence imaging of endogenous PKA activity by the yellow/cyan emission ratio (Fig. 1A). Fixed myocytes expressing AKAR and labeled for α-actinin are shown in Fig. 8.
Imaging.
DMNB–cAMP and DMNB-caged fluorescein were from Molecular Probes (Carlsbad, CA). All other reagents were from Sigma (St. Louis, MO). Cells were washed with Hanks buffered saline solution with 20 mM Hepes buffer (pH 7.2) 20 min before imaging and kept at 35°C with a stage heater (Carel, Manheim, PA) during imaging. Myocytes were imaged on an Eclipse TE300 inverted microscope (Nikon, Tokyo, Japan) with a 60× PlanApochromat objective, Cascade 512F CCD camera (Photometrics, Tucson, AZ), and MetaFluor software (Version 6.2; Universal Imaging Corporation, Downington, PA). Imaging was performed by using a 430/25-nm excitation filter (for CFP) and simultaneously recording CFP (470/30 nm) and YFP (535/30 nm) emissions with a DualView emission splitter (Chroma filters; Optical Insights, Santa Fe, NM). Images were acquired with 1-s exposure every 5 s.
Uncaging of DMNB–cAMP was performed by illumination with a 175-W xenon lamp (Sutter, Novato, CA) and a UV (360/40 nm) excitation filter and dichroic for the time specified. In some experiments, local uncaging was performed by adjusting the field diaphragm to a 40-μm-diameter spot. This technique was validated by using DMNB-caged fluorescein dried onto glass slides. UV exposure uncaged dried DMNB–fluorescein with τ = 1.8 ± 0.1 s, n = 4, and DMNB-cAMP in cardiac myocytes with apparent τ = 3.1 ± 0.1 s, n = 6, as measured by AKAR2 emission ratio. Characterization of DMNB–cAMP membrane transport and uncaging kinetics is shown in Figs. 12 and 13, which are published as supporting information on the PNAS web site.
To obtain emission ratio time courses, YFP or CFP emission intensities for each image were averaged over a region of interest and background subtracted, and then yellow/cyan emission ratio was calculated and normalized by the ratio before reagent application. For emission ratio images, a similar approach was used on a pixel-by-pixel basis with a 5 × 5-pixel median filter using MetaMorph software (Universal Imaging Corporation). Statistical significance was determined at P < 0.05 by using Student’s t test. Data are expressed as mean ± SEM.
Computational Models.
We have previously described and validated a mechanistic computational model of β-AR signaling in adult rat cardiac myocytes (25) and methods for model development (33). This model was used here with the following modifications and additions. Rate constants for AC catalysis (kAC = 0.025 s−1) and PDE concentration ([PDETOT] = 0.014 μM) were adjusted to obtain kinetics more consistent with our measured response to Iso in neonatal myocytes. Uncaging of DMNB–cAMP was incorporated by estimating effective DMNB–cAMP concentrations (6% of total concentration, tested response to 5–200 μM DMNB–cAMP normalized by the subsequent response to 1 mM 3-isobutyl-methylxanthine) and cAMP uncaging rates (kPHOT = 0.1 s−1, by varying UV exposure time) by using least-squares fits between experiments and the model (Figs. 12 and 13). AKAR phosphorylation rate constants were estimated from Kemptide (34), the substrate on which AKAR is based.
For some studies, a simple two-compartment version of this model was used, containing both membrane and cytosolic species for cAMP, PDE, PKA, phosphatase, and AKAR. Total concentrations of PDE, PKA, phosphatase, and AKAR were assumed similar in membrane and cytosolic compartments. The diffusive flux of cAMP was modeled as JcAMP = DcAMP·SA/(Vi·L)·([cAMPMEM] − [cAMPCYT]). Geometric parameters were estimated from neonatal rat cardiac myocytes as follows: SA = 4,000 μm2, L = 2.5 μm, VCELL = 12,500 μm3, and VMEM = 0.02·VCELL. (For model parameters, see Table 1.)
For simulation of local DMNB–cAMP uncaging, we developed a 2D version of our single-compartment model described above. To create the 2D model geometry, images of several neonatal myocytes were segmented to create grid-like meshes. Our base model contained 2,542 of the 1.5 × 1.5-μm elements, and we also confirmed numerical convergence by comparing with a higher resolution mesh containing 10,168 of the 0.75 × 0.75-μm elements. The numerical solution of the 2D model used a finite volume approach as described in ref. 35, whereas the compartmental models were solved by using LSODA. All models were implemented by using Virtual Cell software (36) and are freely available in the Virtual Cell environment for download or online use at www.nrcam.uchc.edu/applications/published%20_models.html.
Supplementary Material
Acknowledgments
We thank Dr. Laurence Brunton for helpful discussions, Dr. Kirk Knowlton for use of his DeltaVision microscope, and Zhuangjie Li for technical assistance. This work was supported by National Science Foundation Grant BES-0086482 (to A.D.M.); National Institutes of Health Grants RR08605 and HL46345 (to A.D.M.), NS27177 and GM72033 (to R.Y.T.), and DK73368 (to J.Z.); and a Whitaker Foundation Graduate Fellowship (to J.J.S.).
Abbreviations
- AC
adenylyl cyclase
- AKAR
A-kinase activity reporter
- pmAKAR2
plasma membrane-targeted AKAR2
- β-AR
β-adrenergic receptor
- DMNB
4,5-dimethoxy-2-nitrobenzyl
- Iso
isoproterenol
- PDE
phosphodiesterase
- PGE1
prostaglandin E1
- CFP
cyan fluorescent protein
- YFP
yellow fluorescent protein.
Footnotes
Conflict of interest statement: No conflicts declared.
This paper was submitted directly (Track II) to the PNAS office.
Data deposition: The data for the Virtual Cell models implemented in this paper have been deposited in the National Resource for Cell Analysis and Modeling database, www.nrcam.uchc.edu/applications/published%20_models.html.
References
- 1.Xiao R. P., Zhu W., Zheng M., Chakir K., Bond R., Lakatta E. G., Cheng H. Trends Pharmacol. Sci. 2004;25:358–365. doi: 10.1016/j.tips.2004.05.007. [DOI] [PubMed] [Google Scholar]
- 2.Steinberg S. F., Brunton L. L. Annu. Rev. Pharmacol. Toxicol. 2001;41:751–773. doi: 10.1146/annurev.pharmtox.41.1.751. [DOI] [PubMed] [Google Scholar]
- 3.Bers D. M. Nature. 2002;415:198–205. doi: 10.1038/415198a. [DOI] [PubMed] [Google Scholar]
- 4.Communal C., Singh K., Pimentel D. R., Colucci W. S. Circulation. 1998;98:1329–1334. doi: 10.1161/01.cir.98.13.1329. [DOI] [PubMed] [Google Scholar]
- 5.Zaccolo M., Pozzan T. Science. 2002;295:1711–1715. doi: 10.1126/science.1069982. [DOI] [PubMed] [Google Scholar]
- 6.Jurevicius J., Fischmeister R. Proc. Natl. Acad. Sci. USA. 1996;93:295–299. doi: 10.1073/pnas.93.1.295. [DOI] [PMC free article] [PubMed] [Google Scholar]
- 7.Mongillo M., McSorley T., Evellin S., Sood A., Lissandron V., Terrin A., Huston E., Hannawacker A., Lohse M. J., Pozzan T., et al. Circ. Res. 2004;95:67–75. doi: 10.1161/01.RES.0000134629.84732.11. [DOI] [PubMed] [Google Scholar]
- 8.Rochais F., Vandecasteele G., Lefebvre F., Lugnier C., Lum H., Mazet J. L., Cooper D. M., Fischmeister R. J. Biol. Chem. 2004;279:52095–52105. doi: 10.1074/jbc.M405697200. [DOI] [PubMed] [Google Scholar]
- 9.Rich T. C., Fagan K. A., Tse T. E., Schaack J., Cooper D. M., Karpen J. W. Proc. Natl. Acad. Sci. USA. 2001;98:13049–13054. doi: 10.1073/pnas.221381398. [DOI] [PMC free article] [PubMed] [Google Scholar]
- 10.DiPilato L. M., Cheng X., Zhang J. Proc. Natl. Acad. Sci. USA. 2004;101:16513–16518. doi: 10.1073/pnas.0405973101. [DOI] [PMC free article] [PubMed] [Google Scholar]
- 11.Ostrom R. S., Insel P. A. Br. J. Pharmacol. 2004;143:235–245. doi: 10.1038/sj.bjp.0705930. [DOI] [PMC free article] [PubMed] [Google Scholar]
- 12.Lefkowitz R. J., Shenoy S. K. Science. 2005;308:512–517. doi: 10.1126/science.1109237. [DOI] [PubMed] [Google Scholar]
- 13.Perry S. J., Baillie G. S., Kohout T. A., McPhee I., Magiera M. M., Ang K. L., Miller W. E., McLean A. J., Conti M., Houslay M. D., Lefkowitz R. J. Science. 2002;298:834–836. doi: 10.1126/science.1074683. [DOI] [PubMed] [Google Scholar]
- 14.Fink M. A., Zakhary D. R., Mackey J. A., Desnoyer R. W., Apperson-Hansen C., Damron D. S., Bond M. Circ. Res. 2001;88:291–297. doi: 10.1161/01.res.88.3.291. [DOI] [PubMed] [Google Scholar]
- 15.Wong W., Scott J. D. Nat. Rev. Mol. Cell. Biol. 2004;5:959–970. doi: 10.1038/nrm1527. [DOI] [PubMed] [Google Scholar]
- 16.Zhang J., Ma Y., Taylor S. S., Tsien R. Y. Proc. Natl. Acad. Sci. USA. 2001;98:14997–15002. doi: 10.1073/pnas.211566798. [DOI] [PMC free article] [PubMed] [Google Scholar]
- 17.Zhang J., Hupfeld C. J., Taylor S. S., Olefsky J. M., Tsien R. Y. Nature. 2005;437:569–573. doi: 10.1038/nature04140. [DOI] [PubMed] [Google Scholar]
- 18.Janetopoulos C., Jin T., Devreotes P. Science. 2001;291:2408–2411. doi: 10.1126/science.1055835. [DOI] [PubMed] [Google Scholar]
- 19.Bunemann M., Frank M., Lohse M. J. Proc. Natl. Acad. Sci. USA. 2003;100:16077–16082. doi: 10.1073/pnas.2536719100. [DOI] [PMC free article] [PubMed] [Google Scholar]
- 20.Hayes J. S., Brunton L. L., Mayer S. E. J. Biol. Chem. 1980;255:5113–5119. [PubMed] [Google Scholar]
- 21.Chen C., Nakamura T., Koutalos Y. Biophys. J. 1999;76:2861–2867. doi: 10.1016/S0006-3495(99)77440-0. [DOI] [PMC free article] [PubMed] [Google Scholar]
- 22.Iwatsubo K., Minamisawa S., Tsunematsu T., Nakagome M., Toya Y., Tomlinson J. E., Umemura S., Scarborough R. M., Levy D. E., Ishikawa Y. J. Biol. Chem. 2004;279:40938–40945. doi: 10.1074/jbc.M314238200. [DOI] [PubMed] [Google Scholar]
- 23.Beavo J. A., Bechtel P. J., Krebs E. G. Proc. Natl. Acad. Sci. USA. 1974;71:3580–3583. doi: 10.1073/pnas.71.9.3580. [DOI] [PMC free article] [PubMed] [Google Scholar]
- 24.Corbin J. D., Sugden P. H., Lincoln T. M., Keely S. L. J. Biol. Chem. 1977;252:3854–3861. [PubMed] [Google Scholar]
- 25.Saucerman J. J., Brunton L. L., Michailova A. P., McCulloch A. D. J. Biol. Chem. 2003;278:47997–48003. doi: 10.1074/jbc.M308362200. [DOI] [PubMed] [Google Scholar]
- 26.Stemmer P. M., Ledyard T. H., Watanabe A. M. Biochem. Pharmacol. 2000;59:1513–1519. doi: 10.1016/s0006-2952(00)00292-6. [DOI] [PubMed] [Google Scholar]
- 27.Hohl C. M., Li Q. A. Circ. Res. 1991;69:1369–1379. doi: 10.1161/01.res.69.5.1369. [DOI] [PubMed] [Google Scholar]
- 28.Oliver C. J., Shenolikar S. Front Biosci. 1998;3:D961–72. doi: 10.2741/a336. [DOI] [PubMed] [Google Scholar]
- 29.Ostrom R. S., Gregorian C., Drenan R. M., Xiang Y., Regan J. W., Insel P. A. J. Biol. Chem. 2001;276:42063–42069. doi: 10.1074/jbc.M105348200. [DOI] [PubMed] [Google Scholar]
- 30.Wagner J., Keizer J. Biophys. J. 1994;67:447–456. doi: 10.1016/S0006-3495(94)80500-4. [DOI] [PMC free article] [PubMed] [Google Scholar]
- 31.Wang Y., Botvinick E. L., Zhao Y., Berns M. W., Usami S., Tsien R. Y., Chien S. Nature. 2005;434:1040–1045. doi: 10.1038/nature03469. [DOI] [PubMed] [Google Scholar]
- 32.Warrier S., Belevych A. E., Ruse M., Eckert R. L., Zaccolo M., Pozzan T., Harvey R. D. Am. J. Physiol. 2005;289:C455–C461. doi: 10.1152/ajpcell.00058.2005. [DOI] [PubMed] [Google Scholar]
- 33.Saucerman J. J., McCulloch A. D. Prog. Biophys. Mol. Biol. 2004;85:261–278. doi: 10.1016/j.pbiomolbio.2004.01.005. [DOI] [PubMed] [Google Scholar]
- 34.Gibson R. M., Taylor S. S. J. Biol. Chem. 1997;272:31998–32005. doi: 10.1074/jbc.272.51.31998. [DOI] [PubMed] [Google Scholar]
- 35.Schaff J. C., Slepchenko B. M., Choi Y. S., Wagner J., Resasco D., Loew L. M. Chaos. 2001;11:115–131. doi: 10.1063/1.1350404. [DOI] [PubMed] [Google Scholar]
- 36.Slepchenko B. M., Schaff J. C., Macara I., Loew L. M. Trends Cell Biol. 2003;13:570–576. doi: 10.1016/j.tcb.2003.09.002. [DOI] [PubMed] [Google Scholar]
Associated Data
This section collects any data citations, data availability statements, or supplementary materials included in this article.


