Abstract
Heparin is a highly sulfated glycosaminoglycan that is used as an important clinical anticoagulant. Monitoring and control of the heparin level in a patient's blood during and after surgery is essential, but current clinical methods are limited to indirect and off-line assays. We have developed a silicon field-effect sensor for direct detection of heparin by its intrinsic negative charge. The sensor consists of a simple microfabricated electrolyte-insulator-silicon structure encapsulated within microfluidic channels. As heparin-specific surface probes the clinical heparin antagonist protamine or the physiological partner antithrombin III were used. The dose–response curves in 10% PBS revealed a detection limit of 0.001 units/ml, which is orders of magnitude lower than clinically relevant concentrations. We also detected heparin-based drugs such as the low-molecular-weight heparin enoxaparin (Lovenox) and the synthetic pentasaccharide heparin analog fondaparinux (Arixtra), which cannot be monitored by the existing near-patient clinical methods. We demonstrated the specificity of the antithrombin III functionalized sensor for the physiologically active pentasaccharide sequence. As a validation, we showed correlation of our measurements to those from a colorimetric assay for heparin-mediated anti-Xa activity. These results demonstrate that silicon field-effect sensors could be used in the clinic for routine monitoring and maintenance of therapeutic levels of heparin and heparin-based drugs and in the laboratory for quantitation of total amount and specific epitopes of heparin and other glycosaminoglycans.
Keywords: heparin sensors, label-free sensing, medical devices, enoxaparin, fondaparinux
The complications associated with regulating blood coagulation present major health concerns that can be managed by careful administration and monitoring of anticoagulant drugs (1, 2). In a clinical setting, it is critical to maintain anticoagulant levels that are sufficient to prevent thrombosis yet low enough to avoid bleeding risks. Heparin has been used as a major anticoagulant, and it is second to insulin as a natural therapeutic agent (3). Heparin is a linear glycosaminoglycan (GAG) consisting of uronic acid-(1→4)-d-glucosamine repeating disaccharide subunits containing variable substitution with N-sulfate, O-sulfate, and N-acetyl groups (4). The biological activities of heparin result from sequence-specific interactions with proteins, most importantly with antithrombin III (AT-III), a serine protease inhibitor that mediates heparin's anticoagulant activity (5–7). Heparin, heparan sulfate (HS), and other structurally similar GAGs have been implicated in various other biological processes, including embryonic development, cancer metastasis, and viral pathogenesis (8–10).
Despite its widespread use, native, unfractionated heparin has many limitations, such as interpatient variablility, nonspecific protein binding, unstable pharmacokinetics, and potential side effects such as hemorrhage and heparin-induced thrombocytopenia (11). The variability of heparin arises from its complex molecular structure, intrinsic polydisperity (molecular mass ranges from 3 to 30 kDa) and heterogeneity of samples (only one in three molecules contains the active AT-III-binding site) (12). Clinical use of heparin remains high because it is the only anticoagulant drug that can be effectively controlled and neutralized by an antidote, namely the cationic protein protamine (13).
Low-molecular-weight heparins (LMWHs), i.e. chemically or enzymatically modified heparin molecules with reduced chain length, have been designed as a class of heparin-based drugs with improved bioavailability, simplified administration, more predictable dose–response and pharmacokinetics, and therefore improved safety (14). LMWHs such as enoxaparin (Lovenox), which is generated by chemical β-elimination of heparin, have been used for prophylaxis of deep venous thromboembolysms, which occurs in as many as 50% of patients after undergoing elective orthopedic surgical procedures (15). Compared with heparin, LMWHs have a longer half-life and a lower incidence of complications.
Fondaparinux (Arixtra), a synthetic heparin-based drug based on the unique pentasaccharide AT-III-binding domain of heparin, has antithrombotic anti-Xa activity superior to that of LMWHs. Fondaparinux is therefore used for the prevention of thromboembolic events after elective orthopedic surgery and other prophylactic indications and for the treatment of deep venous thromboembolysms, pulmonary embolisms, and coronary artery diseases (16). Although LMWHs and fondaparinux improve on heparin's therapeutic limitations, they also have shortcomings. The most important safety concerns are that the anticoagulant activity of LMWHs and fondaparinux cannot be effectively neutralized (17) and that their blood levels cannot be effectively monitored by current point-of-care clinical methods. Without the ability to monitor and control their blood level, LMWHs are unsuitable for certain critical and unmet clinical needs. For example, patients with acute coronary syndrome taking a LMWH are at high risk of bleeding complications in the case of an urgent surgical intervention (18).
Standard clinical procedures for monitoring anticoagulant activity of heparin are based on measuring the activated clotting time or activated partial thromboplastin time (1, 19). Although widely used, these tests often fail to provide the actual heparin level because the clotting time can be affected by additional factors commonly encountered during surgery, such as hypothermia or hemodilution, and abnormal levels of clotting factors (1, 20, 21). It has been demonstrated that careful patient-specific assessment of heparin levels would reduce the occurrence of anticoagulation complications (20, 22). Standard colorimetric assays of heparin levels based on the anti-Xa or other activities are available, but they require laboratory settings and elaborate sample handling.
There have been extensive efforts to develop new devices suitable for routine measurement of heparin levels in clinical settings (1, 23). Various approaches such as quartz crystal microbalance, surface plasmon resonance, ion-sensitive field-effect transistor, and membrane-based ion-selective electrode involve either protamine or synthetic cationic polymers as heparin probes, and they are based on either surface affinity capture or an automated heparin titration (23–34). Such methods have had variable success in fully achieving the required objectives: selectivity, sensitivity, robustness, and reusability. Moreover, because the heparin capture is based on activity-independent electrostatic binding, these measurements are of limited utility because they can determine only total rather than clinically active heparin (12).
Here we use electronic field-effect sensors based on the electrolyte insulator silicon (EIS) structure (35, 36) to directly monitor the binding of heparin by detecting its intrinsic negative charge. EIS structures enable a simple and highly sensitive measurement of surface potential at the electrolyte insulator interface, (37, 38), and they have been previously used to measure pH and the adsorption of highly charged molecules such as DNA (39, 40). To address the need for LMWH monitoring, we demonstrate that a protamine-functionalized EIS can measure the concentration of enoxaparin and that an AT-III-functionalized EIS can selectively detect the physiologically active pentasaccharide domain in unfractionated heparin and fondaparinux. To validate the potential for clinical applications, we demonstrate the correlation to a standard assay of heparin's anti-Xa activity.
Results and Discussion
Operation of Silicon Field-Effect Detection.
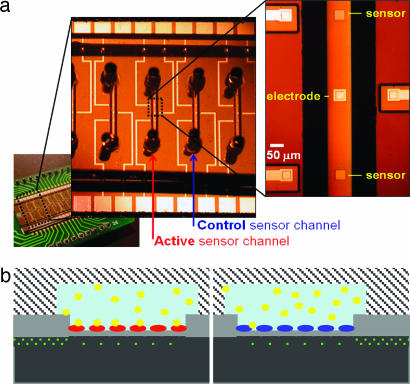
Fig. 1a shows an optical micrograph of two EIS structures with 50 × 50-μm2 sensing surfaces in a single microfluidic channel. Twenty sensors (two in each channel for redundancy) were fabricated on a single chip and subsequently encapsulated with either poly(dimethylsiloxane) (PDMS) or glass microchannels. Glass microchannels were more robust to stringent cleaning procedures and eliminated defects and tediousness associated with hand packaging individual devices with PDMS slabs. A cross-section of the structures (Fig. 1b) illustrates the use of silicon implantation (dotted green line in Fig. 1b) for establishing electrical connections to each sensor and their reference electrode. The surface potential of the insulator-electrolyte interface is determined by measuring the capacitance between the implanted silicon and the reference electrode (35, 36, 39).
Fig. 1.
Design and operation of silicon field-efffect device. (a) Optical micrograph showing an array of parallel anodically bonded glass microfluidic channels, each containing two 50 × 50-μm field-effect sensors and a gold signal electrode. Differential measurements involve two channels, one for the active sensor and another for the control sensor. (b) Schematic illustration of device operation showing the depleted region (dotted area) in p-doped Si (black) under the sensor oxide surface (gray). Highly doped buried conductive traces (dotted area) connect the signal electrode and the sensors to their respective gold traces away from the channels. Heparin (yellow) binds to the surface of the sensor containing the protamine receptor (red), whereas this binding is absent for the control sensor passivated by BSA (blue).
Specific detection of biomolecules requires prior sensor surface functionalization with receptors that exhibit high specificity toward the target analyte. To reduce unwanted interference from bulk properties of the solution (e.g., ionic strength and pH) and, to some extent, the interference from nonspecific binding, we measure the difference in surface potential between two sensors in adjacent channels. The active sensor is modified with a heparin receptor, protamine or AT-III, and the control sensor is passivated with BSA.
Protamine-Based Sensing of Total Concentration of Heparin and Enoxaparin.
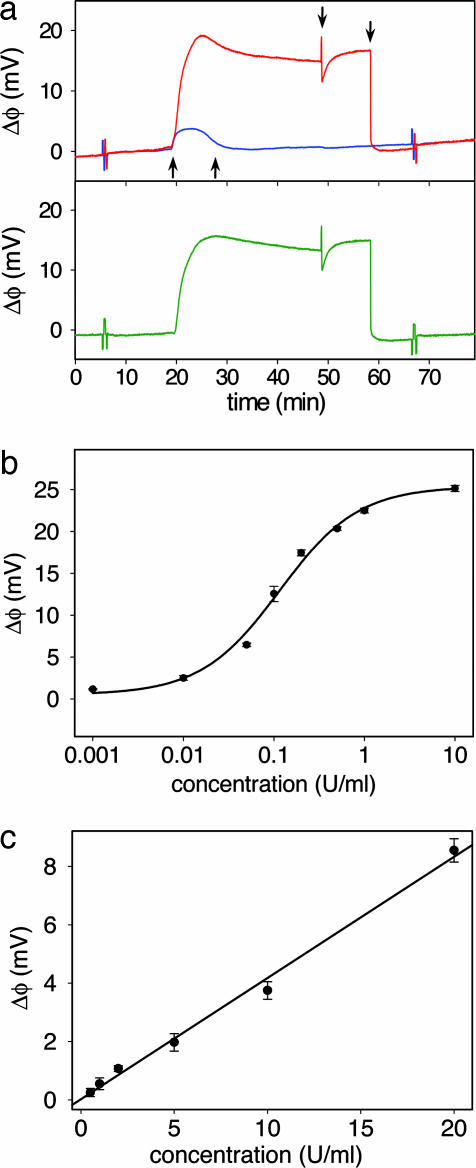
Total heparin concentration is measured by modifying the active sensor with protamine, a cationic protein used as a high affinity (Kd < 10−7 M) (41) heparin antagonist. Fig. 2a shows the absolute and the differential surface potential response of the protamine sensor to 0.3 units/ml of heparin solution and the subsequent recovery of the protamine surface. During the injection the active and control sensor respond to surface adsorption and the slight difference between ionic strength and pH of the sample and the running buffer. The resulting differential response, however, eliminates the bulk effects, and the signal primarily represents heparin binding to the active sensor. Arrows (from left to right) in Fig. 2a indicate the injection of heparin solution, buffer, a 20.0 μM protamine solution, and the final buffer rinse. The increased baseline upon injection of heparin solution, expected from its negative charge, (39) gradually decreases during the buffer rinse, which suggests a slow dissociation of sensor-bound heparin in the nonequilibrium conditions of the flow-through setup. The transient baseline change during protamine injection over the active sensor originates from the variations in ionic strength and pH between the 20-μM protamine solution and the running buffer.
Fig. 2.
Protamine-based sensing of total heparin concentration. (a) The response to 0.3 units/ml of heparin solution in 10% PBS of the active sensor (red) and the control sensor (blue). The differential response (green) reveals the surface potential change caused by heparin binding by eliminating bulk solution effects. The arrows from left to right correspond to the injection of heparin solution, rinse with running buffer, injection of protamine solution, and the second buffer rinse. The spikes at 6 and 67 min correspond to externally applied positive and negative 2.5-mV calibration signal. (b) Dose–response curve for heparin in 10% PBS from a protamine functionalized sensor. (c) Clinically relevant range of the dose–response curves from the protamine sensor for heparin in 10% human serum. Each data point is an average of two measurements ± 1 SD.
The baseline recovery to the original level before heparin injection is consistent with the surface deposition of a fresh protamine layer on top of the existing heparin layer. Such layer-by-layer assembly of protamine and heparin, commonly observed with alternating electrostatic adsorption of oppositely charged polyelectrolytes (42), was confirmed by ellipsometry. The first deposition of a protamine-heparin pair layer yielded a 0.8 ± 0.3-nm-thick film, whereas 10 deposition cycles produced a film with thickness of 7.4 ± 0.6 nm, consistent with the expected 10 protamine-heparin layers. Importantly, as in our previous studies involving DNA and polylysine multilayers (39, 40), the deposition of multiple layers does not decay the signal amplitude over several measurements, suggesting that the overcompensated surface charge at the top layer is effectively propagated to the sensor surface. The regeneration of the sensor surface and the recovery of the initial baseline allows for multiple measurements on the same device, a feature necessary for clinical applications. However, after prolonged multilayer deposition (typically >20), we observe that the signal degrades, and cleaning with piranha solution is necessary to restore the sensor to its initial state.
To evaluate the performance of the protamine sensor, we obtained the dose–response curve for heparin in buffer (Fig. 2b). The data were successfully fitted to a Langmuir isotherm with Kd = 44 nM (0.12 units/ml), with the sensitive region ranging over two orders of magnitude, from ≈0.01 to 1 units/ml. Heparin doses given to patients typically range from 2 to 8 units/ml during bypass surgery and an order of magnitude lower for postsurgical therapy (1). The protamine sensor is therefore capable of detecting heparin at and below clinically relevant concentrations. In this way, the most sensitive range of the dose–response curve can be matched to a desired range by an appropriate sample dilution.
To demonstrate the clinical utility of the protamine sensor, we analyzed samples of diluted human serum spiked with known heparin concentrations. The resulting calibration curve, shown in Fig. 2c, corresponds to the range of 0.5 to 20 units/ml for the original undiluted serum. The observed decreased sensitivity (detection limit of 0.05 units/ml in 10% serum) compared with the buffer samples can be attributed to partial heparin neutralization by serum proteins such as platelet factor 4 (20) and to surface fouling by interfering molecular species present in the serum sample. Importantly, the device response remained linear in the clinically relevant range, providing simple device calibration and easy readout and data interpretation.
There is a growing view that monitoring LMWH is necessary in certain clinical cases, although the demand for laboratory monitoring of LMWH is not as frequent as for heparin because the interpatient variability in dosage requirements is much lower. The guidelines of the College of American Pathologists recommend laboratory monitoring in pediatric patients and suggest laboratory monitoring in patients with renal insufficiency, those receiving prolonged therapy including pregnancy, those at high risk for bleeding or thrombotic recurrence, and patients with obesity or low body weight (20). The current inability to monitor LMWH levels particularly limits its usage in a catheterization laboratory, and a simple and rapid point-of-care monitoring system would therefore improve the safety and efficacy of LMWH administration (18).
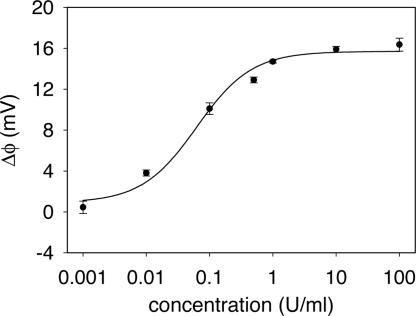
Fig. 3 shows the dose–response curves of enoxaparin binding to the protamine sensor. As with unfractionated heparin, the sensitive region of the dose–response curve, successfully fitted to a Langmuir isotherm with Kd = 150 nM (0.06 units/ml), includes the clinically relevant concentrations. Although protamine is not effective at completely neutralizing the activity of LMWHs in vivo (it neutralizes the antithrombin activity but not the anti-Xa activity) (43), the interaction is sufficient to detect enoxaparin with the protamine sensor. The somewhat lower signal response compared with heparin can be attributed to less overall negative charge introduced to the surface of the relatively shorter polysaccharide chains.
Fig. 3.
Dose–response curve of the protamine sensor for enoxaparin in 10% PBS. Each data point is shown as the average of two measurements ± 1 SD.
AT-III-Based Sensing of Active Heparin and Fondaparinux.
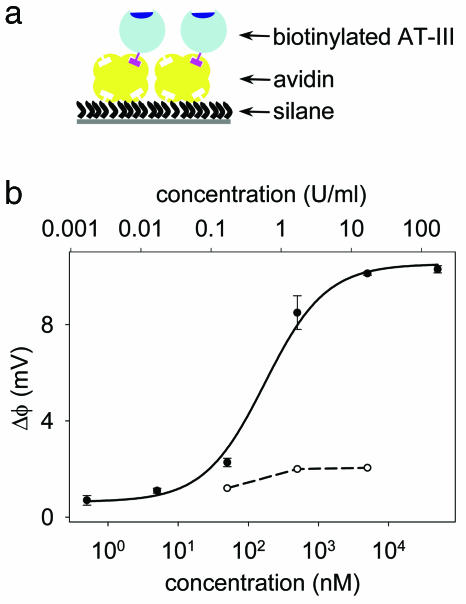
The highly specific interaction between AT-III and heparin involves clinically active pentasaccharide domains, which are randomly distributed along the heparin chains, and a single binding site on the AT-III surface (16). The preparation of the AT-III-based sensor (Fig. 4a) involves covalent immobilization of avidin via aldehyde-modified silane, followed by the capture of biotinylated AT-III. Because the heparin-binding site was protected during the biotinylation process (44), the immobilized AT-III remains active and properly oriented away from the surface.
Fig. 4.
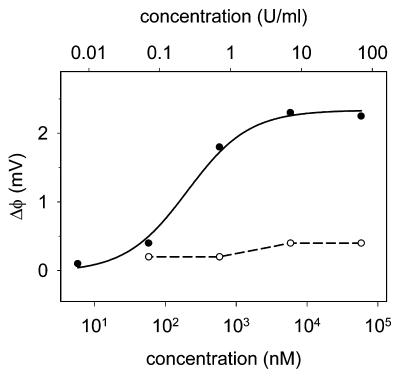
AT-III-based sensing of active heparin concentration. (a) Procedure for immobilizing AT-III to the sensor surface. (b) Dose–response curve for the AT-III sensor with heparin (●) and chondroitin sulfate (○), a carbohydrate that is structurally related to heparin but known not to interact with AT-III. Chondroitin sulfate data points are connected with a dashed line and heparin data points (shown as the average of two measurements ± 1 SD) are fitted to a Langmuir isotherm (solid line).
The dose–response curve for heparin from the AT-III sensor (Fig. 4b) was fitted to a Langmuir isotherm with a Kd of 180 nM (0.49 units/ml), which is ≈2.5 to 5 times higher than the reported values in solution (45, 46). To evaluate the selectivity of the AT-III sensor for heparin, we measured its response to a negatively charged GAG, chondroitin sulfate, which is structurally related to heparin but known not to interact with AT-III (Fig. 4b). The response is negligible and consistent with the expected low binding affinity, thus confirming the selectivity of the AT-III sensor.
Next, we tested the capability of the AT-III sensor to selectively detect fondaparinux, a synthetic drug based on the AT-III-binding pentasaccharide domain of heparin. The sensitive region of the dose–response curve (Fig. 5) includes the clinically relevant range of concentrations. The data were successfully fitted to a Langmuir isotherm with a Kd of 200 nM (0.24 units/ml), a value eight times higher than that obtained for fondaparinux binding to AT-III in solution (16, 47). The amplitude of the sensor response of 2.3 mV is lower than that of unfractionated heparin, presumably because of less overall surface charge per molecule that is introduced upon fondaparinux binding.
Fig. 5.
Dose–response curve of the AT-III sensor for the heparin-based pentasaccharide drug fondaparinux (●) and 6-O-desulfated fondaparinux (○), which is known to exhibit low binding affinity for AT-III. Data points for fondaparinux are fit with a Langmuir isotherm (solid line), and those for 6-O-desulfated fondaparinux are connected with a dashed line.
To further investigate the selectivity of the AT-III sensor to the active sequence of heparin, we also analyzed a pentasaccharide with a single 6-O-sulfate moiety removed from the nonreducing end of the fondaparinux, a modification that renders the pentasaccharide completely inactive (44). Unlike with fondaparinux, there was a negligible response from the inactive pentasaccharide, confirming the expected selectivity of the AT-III sensor. Such sequence-specific detection demonstrates that this sensor could be used to study interactions of heparin, HS, and other GAGs with proteins (such as cytokines or growth factors) and for sequence-specific quantification of scarce HSGAG samples.
Comparison of the Field-Effect Sensor with the Anti-Xa Assay.
As a validation for clinical use, we compared our measurements with an assay of heparin's anti-Xa activity (Coatest), a standard method for clinical assessment of heparin levels. Although activated clotting time and activated partial thromboplastin time (APTT) remain the dominant tests for monitoring anticoagulation, it is widely known that they may poorly correlate to the actual heparin level because of the lack of specificity and interference of other factors (20, 21). Enzymatic assays such as this anti-Xa assay, which has a reported correlation coefficient of ≥0.90 with the APTT, are more accurate in reporting heparin levels, but they are complex, reagent-intense, and require laboratory settings, which makes them impractical for routine near-patient testing. Moreover, the anti-Xa assay relies on unstable reagents, is sensitive to the presence of other molecules that can affect stability of chromogenic substrate and activity of Xa, and is sensitive to Xa levels in test plasma.
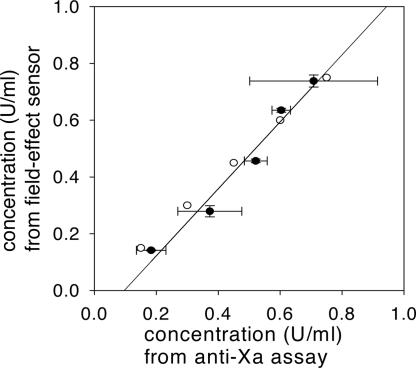
To compare the performance of the protamine sensor with that of the anti-Xa assay and the actual heparin concentrations, we obtained a standard curve for each method by using 0.1, 0.3, 0.5, 0.7 and 0.9 units/ml solutions of heparin, and we used them to determine five “unknown” concentrations in this range by both methods. Because the sensitivity of the protamine sensor exceeds the range of anti-Xa assay (broadly 0.1–1.0 units/ml) by an order of magnitude, the samples were adequately diluted. Fig. 6 shows a good correlation (correlation coefficient r2 = 0.97) between the two methods. Importantly, the comparison of the standard deviations and the divergence from the expected values show that field-effect sensor exhibited both better precision and accuracy compared with the anti-Xa assay, while consuming only nanogram sample quantities.
Fig. 6.
Linear correlation (r2 = 0.97) between the values for different heparin concentrations in 10% PBS obtained by field-effect measurements and the colorimetric anti-Xa assay (●). The values were obtained by using a five-point standard curve in the range of 0.1 to 0.9 units/ml. The actual values (○) were 0.1, 0.3, 0.45, 0.6, and 0.75 units/ml. The samples were diluted 10 times in the case of field-effect measurements. The horizontal error bars represent the SD from three distinct anti-Xa assays and the vertical error bars represent the SD from two field-effect measurements.
Future Directions and Conclusions.
We have demonstrated the potential of the field-effect sensor to detect and quantify clinically relevant concentrations of heparin and its low-molecular- weight analogs. To meet this potential in the clinical setting, certain obstacles common to many types of electronic sensors and medical devices may need to be overcome. First, the sensors often require long initial equilibration time. We have found that careful cleaning of the sensor surface and differential detection improves performance but does not completely eliminate these effects. Second, we occasionally observe device-to-device variations in both the amplitude of the signal and the sensitivity for heparin binding. Third, although the sensor is capable of detecting heparin in plasma samples (data not shown), the device exhibited a gradual decrease in sensitivity over successive sample runs, presumably because of nonspecific deposition of plasma components in the sensor channel, a frequent problem of plasma-contacting medical devices. We anticipate the majority of these issues could be addressed by improving the quality of the sensor surface through pregrown oxide layers during the fabrication process and more rigorous procedures for surface preparation and regeneration.
In its present state, this device could be useful for the analysis of heparin, HS, and other similar GAGs in the laboratory setting. The sensitivity and low volume sample requirements allow total or specific heparin quantification with nanogram quantities of material, with the ability to recover most of the analyzed sample. In contrast, the current standard methods for nonactivity-based quantification of GAGs, such as the m-hydroxydiphenyl method, consume micrograms of material and are highly affected by the presence of other GAGs, neutral carbohydrates, or proteins (48, 49). The specificity of AT-III-based sensing suggests the possibility of immobilizing other heparin-binding proteins to the surface of the device and quantifying other epitopes within a diverse HSGAG population. When combined, these two capabilities of sensitive and specific detection have the potential to allow novel studies of heparin-binding epitopes from scarce preparations of cell surface HSGAGs.
In summary, we have demonstrated the capability of silicon field-effect sensors to measure clinically relevant concentrations of heparin, the LMWH enoxaparin, and the synthetic pentasaccharide drug fondaparinux. We obtained dose–response curves and achieved detection limits that are sufficient for clinically relevant concentrations, and we demonstrated good correlation to a standard laboratory-based anti-Xa assay of heparin activity. We envision that the ability to make direct and routine measurements of heparin, LMWHs, and heparin-based drugs such as fondaparinux could increase the safety and efficacy of these drugs in the clinical setting. Moreover, in the research laboratory, the quantitation of absolute amounts and specific active sequences of HSGAGs could enable in-depth investigations of their interactions with other biomolecules.
Materials and Methods
Device Design and Packaging.
Devices were fabricated at the Massachusetts Institute of Technology Microsystems Technology Laboratory. Field-sensitive regions (50 × 50 μm or 80 × 80 μm) were defined by p-type doping and electrically isolated by the n-type substrate. Metal contact pads were connected to the field-sensitive regions by heavily doped p-type traces. The n-type and heavily doped p-type regions were passivated with 0.8 μm of silicon nitride deposited by low-pressure chemical vapor deposition. The silicon nitride was removed over the field-sensitive region, and native silicon oxide was used as the gate oxide. Reference electrodes were defined by evaporating 20 nm of chromium and 1 μm of gold or platinum directly on the heavily doped p-type trace. Devices were encapsulated by either glass or poly(dimethylsiloxane) microfluidic channels by using previously developed procedures (40, 50). The silicon oxide above the field-sensitive region was regenerated by a 30-s etch with buffered oxide etching solution [ammonium fluoride/hydrogen fluoride 7:1 (vol/vol)] and a thorough rinse with water. The device was then allowed to equilibrate overnight until the baseline signal was stable and long-range drift was insignificant. Although each channel contained two field-sensitive regions only one region was used.
Surface Chemistry.
Protamine was physisorbed to the sensor surface by flowing a 20 μM solution of protamine in 10% PBS for 10 min, followed by rinsing with the buffer. A control sensor was prepared in separate flow channel by the same procedure except that BSA was used in place of protamine. The layer-by-layer deposition of protamine and heparin was examined with a Sentech (Berlin, Germany) SE400 ellipsometer, with the assumed refractive index of organic film of 1.5. The experiments were done by the alternating 5-min exposure of a 1-cm2 piece of silicon wafer to a 20 μM protamine solution and 1 unit/ml of heparin solution, separated by a buffer rinse. AT-III was covalently attached to the sensor surface by the following procedure: “Piranha”-cleaned devices were rinsed with ethanol, incubated with a 1% (vol/vol) ethanolic solution of propyltrimethoxysilane aldehyde for 20 min, rinsed with ethanol, incubated in an oven for 30 min at 80°C, and rinsed with water. The active sensor was treated with a 1.0 mg/ml solution of avidin in 100 mM phosphate buffer, pH 8.0 containing 50 mM NaCNBH3 for 3 h. Upon rinsing with buffer, the unreacted aldehyde groups were quenched by a similar treatment using 0.5 M ethanolamine instead of avidin. The device was then treated with a 1.0 mg/ml solution of biotinylated AT-III for 6 h, rinsed three times with buffer, and allowed to equilibrate. The control sensor was covalently passivated by BSA by using the same procedure.
Instrumentation.
The surface potential of the field-sensitive region was determined by applying an AC signal (50-mV sine wave at 4 kHz) to the reference electrode and measuring the resulting current through the EIS structure with a current preamp (model 428, Keithley, Cleveland, OH) and a lock-in amplifier. The p-type field-sensitive region was biased into partial depletion to maximize sensitivity to changes in surface potential. The n-type substrate was biased to 1 V. Capacitance-voltage curves of the EIS structure were acquired to determine the optimal p-type bias point (51). The surface potential resolution was ≈10 μV in a 1-Hz bandwidth and the linear range was ≈100 mV. The solution was electrically grounded by using a pair of Ag/AgCl wires as reference electrodes incorporated in the microfluidic setup. The data were acquired with LabView software at 16-bit accuracy with a sampling rate of 5–10 Hz. All signals for the active and control sensor were calibrated to the applied 2.5-mV change in p-type bias potential, and the resulting normalized signals were subtracted. The readout of the baseline shift from the differential measurement was chosen at a consistent point of time when the signal reached steady state after the injection of the analyte sample. The data were processed with SigmaPlot software.
Chemicals.
Porcine heparin (activity 180 units/mg) was purchased from Celsus, Cincinnati, OH; protamine sulfate from salmon, avidin, biotinylated BSA, chondroitin sulfate, and human serum were from Sigma-Aldrich, St. Louis, MO. Trimethoxypropylsilane aldehyde was from United Chemical Technologies, Bristol, PA. Fondaparinux (activity, 700 units/mg; Organon, Roseland, NJ) and enoxaparin (activity, 100 units/mg; Aventis Pharmaceuticals, Bridgewater, NJ) were from a local pharmacy, and human AT-III was from Bayer, Elkhart, IN. Biotinylated AT-III was prepared by using a previously established method (44). The reagents for the Coatest Heparin anti-Xa chromogenic assay were from Diapharma Group, West Chester, OH. Serum samples were filtered through a 0.2-μm membrane and diluted to 10% (vol/vol) with distilled water. The running buffer was a 3.0 mM phosphate-citrate buffer containing 7.0 mM NaCl pH 7.0 (total ionic strength 10.0 mM) for AT-III sensor measurements and 10% PBS for protamine sensor measurements.
Anti-Xa Assay.
The Coatest Heparin assay. (Diapharma Group, West Chester, OH) was performed as instructed by the product insert for a semimicro cuvette, except one-quarter of the instructed volumes was used to adapt the assay for a 96-well plate format. Plates were read on a SpectraMax 96-well plate spectrophotometer (Molecular Devices, Sunnyvale, CA). Absorbances were compared with a linearly fit standard curve as instructed.
Experimental Setup.
For all measurements, solutions were introduced to the device with a constant-flow fluid delivery system involving an in-line degasser, an HPLC pump, and a refrigerated autosampler at 4°C. The analyte exposure times were controlled by adjusting the flow rate (usually 2.0–10.0 μl/min) and the injection volume of the analyte (usually 5.0–40.0 μl). A valve upstream from the device was used for switching between flowing different solution over the sensors during differential sensor modifications and simultaneously flowing identical solutions to both sensors during the measurements. Before and after each analyte injection, the sensor was rinsed thoroughly by using “running” buffer identical to that of the analyte solution. After each measurement, the surface of the active sensor was regenerated by 10-min incubation with 20 μM protamine solution for the protamine sensor and 2.0 M NaCl solution for the AT-III sensor.
Acknowledgments
We thank Ken Babcock for useful suggestions and helpful discussions. This work was supported by Hewlett Packard, National Institute of Health Grant GM57073 (to R.S.), and the Air Force Office of Scientific Research. C.-S.J.H. was supported by a Massachusetts Institute of Technology fellowship and the National Science Foundation Center for Bits and Atoms. J.B. was supported by a Howard Hughes Medical Institute predoctoral fellowship. M.G. was supported by a Natural Sciences and Engineering Research Council of Canada postdoctoral fellowship.
Abbreviations
- AT-III
antithrombin III
- EIS
electrolyte insulator silicon
- GAG
glycosaminoglycan
- HS
heparan sulfate
- LMWH
low-molecular-weight heparin.
Footnotes
Conflict of interest statement: No conflicts declared.
This paper was submitted directly (Track II) to the PNAS office.
References
- 1.Despotis G. J., Gravlee G., Filos K., Levy J. Anesthesiology. 1999;91:1122–1151. doi: 10.1097/00000542-199910000-00031. [DOI] [PubMed] [Google Scholar]
- 2.Hirsh J., Lee A. Y. Y. Blood. 2002;99:3102–3110. doi: 10.1182/blood.v99.9.3102. [DOI] [PubMed] [Google Scholar]
- 3.Rabenstein D. L. Nat. Prod. Rep. 2002;19:312–331. doi: 10.1039/b100916h. [DOI] [PubMed] [Google Scholar]
- 4.Roden L. In: Heparin: Chemical and Biological Properties, Clinical Applications. Lane D. A., Lindahl U., editors. Boca Raton, FL: CRC; 1989. pp. 81–96. [Google Scholar]
- 5.Desai U. R., Petitou M., Bjork I., Olson S. T. J. Biol. Chem. 1998;273:7478–7487. doi: 10.1074/jbc.273.13.7478. [DOI] [PubMed] [Google Scholar]
- 6.Jin L., Abrahams J. P., Skinner R., Petitou M., Pike R. N., Carrell R. W. Proc. Natl. Acad. Sci. USA. 1997;94:14683–14688. doi: 10.1073/pnas.94.26.14683. [DOI] [PMC free article] [PubMed] [Google Scholar]
- 7.Shriver Z., Raman R., Venkataraman G., Drummond K., Turnbull J., Toida T., Linhardt R., Biemann K., Sasisekharan R. Proc. Natl. Acad. Sci. USA. 2000;97:10359–10364. doi: 10.1073/pnas.97.19.10359. [DOI] [PMC free article] [PubMed] [Google Scholar]
- 8.Sasisekharan R., Shriver Z., Venkataraman G., Narayanasami U. Nat. Rev. Cancer. 2002;2:521–528. doi: 10.1038/nrc842. [DOI] [PubMed] [Google Scholar]
- 9.Hacker U., Nybakken K., Perrimon N. Nat. Rev. Mol. Cell Biol. 2005;6:530–541. doi: 10.1038/nrm1681. [DOI] [PubMed] [Google Scholar]
- 10.Gallay P. Microbes Infect. 2004;6:617–622. doi: 10.1016/j.micinf.2004.02.004. [DOI] [PubMed] [Google Scholar]
- 11.Sundaram M., Qi Y., Shriver Z., Liu D., Zhao G., Venkataraman G., Langer R., Sasisekharan R. Proc. Natl. Acad. Sci. USA. 2003;100:651–656. doi: 10.1073/pnas.252643299. [DOI] [PMC free article] [PubMed] [Google Scholar]
- 12.Casu B., Torri G. Semin. Thromb. Hemostasis. 1999;25(Suppl.):17–25. [PubMed] [Google Scholar]
- 13.Ando T., Yamsaki M., Suzuki K. In: Molecular Biology Biochemistry and Biophysics. Kleinzeller A., editor. New York: Springer; 1973. pp. 1–109. [Google Scholar]
- 14.Kaiser B., Hoppensteadt D. A., Fareed J. Exp. Opin. Invest. Drugs. 2001;10:1925–1935. doi: 10.1517/13543784.10.11.1925. [DOI] [PubMed] [Google Scholar]
- 15.Hull R. D., Pineo G. F. Prog. Cardiovasc. Dis. 1994;37:71–78. doi: 10.1016/s0033-0620(05)80043-x. [DOI] [PubMed] [Google Scholar]
- 16.Petitou M., van Boeckel C. A. A. Angew Chem. Int. Ed. Engl. 2004;43:3118–3133. doi: 10.1002/anie.200300640. [DOI] [PubMed] [Google Scholar]
- 17.Makris M., Hough R. E., Kitchen S. Br. J. Haematol. 2000;108:884–885. doi: 10.1111/j.1365-2141.2000.1902_2.x. [DOI] [PubMed] [Google Scholar]
- 18.Kadakia R. A., Baimeedi S. R., Ferguson J. J. Tex. Heart Inst. J. 2004;31:72–83. [PMC free article] [PubMed] [Google Scholar]
- 19.Raymond P. D., Ray M. J., Callen S. N., Marsh N. A. Perfusion. 2003;18:269–276. doi: 10.1191/0267659103pf672oa. [DOI] [PubMed] [Google Scholar]
- 20.Kitchen S. Br. J. Haematol. 2000;111:397–406. doi: 10.1046/j.1365-2141.2000.02308.x. [DOI] [PubMed] [Google Scholar]
- 21.Levine M. N., Hirsh J., Gent M., Turpie A. G., Cruickshank M., Weitz J., Anderson D., Johnson M. Arch. Intern. Med. 1994;154:49–56. [PubMed] [Google Scholar]
- 22.Jobes D. R., Schaffer G. W., Aitken G. L. J. Thorac. Cardiovasc. Surg. 1995;110:36–45. doi: 10.1016/S0022-5223(05)80007-8. [DOI] [PubMed] [Google Scholar]
- 23.Jelinek R., Kolusheva S. Chem. Rev. 2004;104:5987–6015. doi: 10.1021/cr0300284. [DOI] [PubMed] [Google Scholar]
- 24.van Kerkhof J. C., Bergveld P., Schasfoort R. B. M. Biosens. Bioelectron. 1995;10:269–282. doi: 10.1016/0956-5663(95)96846-q. [DOI] [PubMed] [Google Scholar]
- 25.Borza D.-B., Morgan W. T. J. Biol. Chem. 1998;273:5493–5499. doi: 10.1074/jbc.273.10.5493. [DOI] [PubMed] [Google Scholar]
- 26.Gaus K., Hall E. A. H. J. Colloid. Interface Sci. 1997;194:364–372. doi: 10.1006/jcis.1997.5097. [DOI] [PubMed] [Google Scholar]
- 27.Ramamurthy N., Baliga N., Wahr J. A., Schaller U., Yang V. C., Meyerhoff M. E. Clin. Chem. 1998;44:606–613. [PubMed] [Google Scholar]
- 28.Fu B., Bakker E., Yang V. C., Meyerhoff M. E. Macromolecules. 1995;28:5834–5840. [Google Scholar]
- 29.Zhu X., Wang X., Jiang C. Anal. Biochem. 2005;341:299–307. doi: 10.1016/j.ab.2005.03.014. [DOI] [PubMed] [Google Scholar]
- 30.van Kerkhof J. C., Bergveld P., Schasfoort R. B. M. Biosens. Bioelectron. 1993;8:463–472. doi: 10.1016/0956-5663(95)96846-q. [DOI] [PubMed] [Google Scholar]
- 31.Mathison S., Bakker E. Anal. Chem. 1999;71:4614–4621. doi: 10.1021/ac990387s. [DOI] [PubMed] [Google Scholar]
- 32.Gadzekpo V. P. Y., Buhlmann P., Xiao K. P., Aoki H., Umezawa Y. Anal. Chim. Acta. 2000;411:163–173. [Google Scholar]
- 33.Cheng T.-J., Lin T.-M., Chang H.-C. Anal. Chim. Acta. 2002;462:261–273. [Google Scholar]
- 34.Guo J., Yuan Y., Amemiya S. Anal. Chem. 2005;77:5711–5719. doi: 10.1021/ac050833d. [DOI] [PubMed] [Google Scholar]
- 35.Parce J. W., Owicki J. C., Kercso K. M., Sigal G. B., Wada H. G., Muir V. C., Bousse L. J., Ross K. L., Sikic B. I., McConnell H. M. Science. 1989;246:243–247. doi: 10.1126/science.2799384. [DOI] [PubMed] [Google Scholar]
- 36.Hafeman D. G., Parce J. W., McConnell H. M. Science. 1988;240:1182–1185. doi: 10.1126/science.3375810. [DOI] [PubMed] [Google Scholar]
- 37.Bousse L., Bergveld P. J. Electroanal. Chem. 1983;152:25–39. [Google Scholar]
- 38.Cooper E. B., Fritz J., Wiegand G., Wagner P., Manalis S. R. Appl. Phys. Lett. 2001;79:3875–3877. [Google Scholar]
- 39.Fritz J, Cooper E. B., Gaudet S., Sorger P. K., Manalis S. R. Proc. Natl. Acad. Sci. USA. 2002;99:14142–14146. doi: 10.1073/pnas.232276699. [DOI] [PMC free article] [PubMed] [Google Scholar]
- 40.Hou C.-S. J., Milović N. M., Godin M., Russo P. R., Chakrabarti R., Manalis S. R. Anal. Chem. 2006;78:2526–2531. doi: 10.1021/ac0520689. [DOI] [PubMed] [Google Scholar]
- 41.Yun J. H., Ma S., Fu B., Yang V. C., Meyerhoff M. E. Electroanalysis. 1993;5:719–724. [Google Scholar]
- 42.Decher G. Science. 1997;277:1232–1237. [Google Scholar]
- 43.Weitz J. I. N. Engl. J. Med. 1997;337:688–699. doi: 10.1056/NEJM199709043371007. [DOI] [PubMed] [Google Scholar]
- 44.Keiser N., Venkataraman G., Shriver Z., Sasisekharan R. Nat. Med. 2001;7:123–128. doi: 10.1038/83263. [DOI] [PubMed] [Google Scholar]
- 45.Watton J., Longstaff C., Lane D. A., Barrowcliffe T. W. Biochemistry. 1993;32:7286–7293. doi: 10.1021/bi00079a027. [DOI] [PubMed] [Google Scholar]
- 46.Olson S. T., Srinivasan K. R., Bjork I., Shore J. D. J. Biol. Chem. 1981;256:11073–11079. [PubMed] [Google Scholar]
- 47.Bauer K. A., Hawkins D. W., Peters P. C., Petitou M., Herbert J.-M., van Boeckel C. A. A., Meuleman D. G. Cardiovasc. Drug Rev. 2002;20:37–52. doi: 10.1111/j.1527-3466.2002.tb00081.x. [DOI] [PubMed] [Google Scholar]
- 48.Van Den Hoogen B. M., Van Weeren P. R., Lopes-Cardozo M., Van Golde L. M. G., Barneveld A., Van De Lest C. H. A. Anal. Biochem. 1998;257:107–111. doi: 10.1006/abio.1997.2538. [DOI] [PubMed] [Google Scholar]
- 49.Murado M. A., Vazquez J. A., Montemayor M. I., Cabo M. L., Gonzalez M. D. P. Biotechnol. Appl. Biochem. 2005;41:209–216. doi: 10.1042/BA20040127. [DOI] [PubMed] [Google Scholar]
- 50.Xia Y., Whitesides G. M. Angew Chem. Int. Ed. Engl. 1998;37:550–575. doi: 10.1002/(SICI)1521-3773(19980316)37:5<550::AID-ANIE550>3.0.CO;2-G. [DOI] [PubMed] [Google Scholar]
- 51.Cooper E. B., Fritz J., Wiegand G., Wagner P., Manalis S. R. Appl. Phys. Lett. 2001;79:3875–3877. [Google Scholar]


