Abstract
The Living Planet Index was developed to measure the changing state of the world's biodiversity over time. It uses time-series data to calculate average rates of change in a large number of populations of terrestrial, freshwater and marine vertebrate species. The dataset contains about 3000 population time series for over 1100 species. Two methods of calculating the index are outlined: the chain method and a method based on linear modelling of log-transformed data. The dataset is analysed to compare the relative representation of biogeographic realms, ecoregional biomes, threat status and taxonomic groups among species contributing to the index.
The two methods show very similar results: terrestrial species declined on average by 25% from 1970 to 2000. Birds and mammals are over-represented in comparison with other vertebrate classes, and temperate species are over-represented compared with tropical species, but there is little difference in representation between threatened and non-threatened species. Some of the problems arising from over-representation are reduced by the way in which the index is calculated. It may be possible to reduce this further by post-stratification and weighting, but new information would first need to be collected for data-poor classes, realms and biomes.
Keywords: Living Planet Index, biodiversity indicator, species population trends, representation, 2010 target
1. Introduction
In its plan of implementation, the 2002 World Summit on Sustainable Development endorsed the Hague Ministerial Declaration of the Sixth Conference of the Parties to the Convention on Biological Diversity (CBD) that committed them ‘to achieve by 2010 a significant reduction of the current rate of biodiversity loss at the global, regional and national level as a contribution to poverty alleviation and to the benefit of all life on earth’ (CBD 2000, p. 319). At present, there is no system in place to measure the progress towards this objective by standardized, regularly repeated measurements of the state of all important biomes and their biota both at global and regional levels (Green et al. 2005; Kapos et al. 2004), although good biodiversity indicator programmes exist in some countries, particularly in the UK and the Netherlands, and significant advances have been made at the pan-European level (Gregory et al. 2005; de Heer et al. 2005). Instead, there is an effort to use existing information, often collected for other purposes, to gain a rough idea of how the state of nature is changing. While we contend that there is an urgent need to initiate well-designed programmes to measure changes in biodiversity, we accept that less satisfactory approaches should be employed in the short term. In this paper, we describe an existing programme for measuring biodiversity change, the Living Planet Index (LPI).
The LPI began in 1997 as a WWF project to develop a measure of the changing state of the world's biodiversity over time, and this remains its objective. Work on the LPI started in collaboration with the World Conservation Monitoring Centre in 1997. The first index was published in the WWF Living Planet Report 1998 (Loh et al. 1998) and has been updated subsequently (Loh et al. 1999; Loh 2000, 2002; Loh & Wackernagel 2004).
The LPI aims to measure average trends in populations of vertebrate species from around the world since 1970. Each iteration of the Living Planet Report has involved a new round of data collection, so the sample sizes of species populations in the index have grown with each successive edition. The index is currently based on nearly 3000 population time series for over 1100 species. All species in the index are vertebrates. The restriction of the index to vertebrate animals, and to years from 1970 onwards, is for reasons of data availability: relatively few time-series data for invertebrate or plant populations exist, and those come from geographically restricted locations. Therefore, the LPI is a measure of global biodiversity only as far as trends in vertebrate species populations are representative of wider trends in all species, genes and ecosystems.
The initial aim was to make the LPI as comprehensive and representative as possible with respect to vertebrate class, geography and biome. We felt that it should be based on the largest possible sample size to give the index the greatest precision possible. Representativeness of the species included could not be guaranteed by accepting as many eligible time series as possible, but efforts were made to allow for unrepresentativeness in the way that the index was calculated (see § 2b). A short time‐interval between index values was also a goal. Here, we describe the compilation of data and the methods used to calculate the LPI; present index values at five-year intervals from 1970 to 2000; examine the representativeness of LPI data with respect to class, biogeographic realm, biome and threat status; and propose further development of the index.
2. Methods
(a) Collection of time-series and ancillary data
Published scientific literature and unpublished reports were searched for eligible time-series data on vertebrate populations, as were online databases such as the NERC Imperial College Global Population Dynamics Database (see http://www.sw.ic.ac.uk/cpb/cpb/gpdd.html) and Ransom Myers' Stock Recruitment Database (see http://www.mscs.dal.ca/∼mgers/welcome.html). Series were included if they met the following criteria:
Estimates available for at least two years from 1970 onwards.
Estimates of population size (global or regional), population density (e.g. numbers per unit area of survey plots, density from transects or point counts and numbers recorded per unit length of transects), biomass (e.g. spawning stock biomass from fisheries statistics) or numbers of nests (e.g. marine turtles). Numbers or densities of animals harvested by hunting or fisheries, though sometimes taken to be indicative of population size or density, were not used.
Survey methods and area covered were comparable throughout each survey of the series, as far as could be ascertained. Estimates for the same species from different workers or research teams published in different papers were not considered to be comparable unless a special effort had been made to ensure this.
Time series with little or no indication of how, where or when the data were collected were not used.
Whether a species was native or non-native was not used as a criterion in the data collection. Our analysis includes data from over one thousand species (table 1).
Table 1.
Numbers of species included in the LPI by class and biome.
| terrestrial | freshwater | marine | total | |
|---|---|---|---|---|
| fish | 91 | 110 | 201 | |
| amphibians | 49 | 49 | ||
| reptiles | 8 | 16 | 16 | 40 |
| birds | 381 | 132 | 95 | 608 |
| mammals | 172 | 11 | 46 | 229 |
| total | 561 | 299 | 267 | 1127 |
(b) Preliminary processing of time-series data
Because any population time-series data that met the above criteria were used in the calculations, the species included in the index were not necessarily representative of all vertebrate classes, biogeographic realms and ecological biomes. Therefore, before carrying out any calculations, the data were first divided up by biome—terrestrial, freshwater or marine—depending on the principal habitat of the species. Where a species commonly occurs in more than one biome, its breeding habitat was designated as its biome. Then, within each biome, species were divided up either according to the biogeographic realm they inhabit—Afrotropical, Australasian, Indo-Malayan, Nearctic, Neotropical or Palaearctic—for terrestrial and freshwater species, or to the ocean they inhabit—Atlantic/Arctic, Pacific, Indian or Southern Ocean—for marine species. For many species, there were time-series data for two or more populations within a single realm or ocean. For some species, one population occurred within one realm or ocean while another population would inhabit another, in which case the populations would be divided accordingly and those species would occur in more than one realm or ocean. Population time-series were assigned to biogeographic realms, following the system used for WWF ecoregions (WWF 2000), ocean basins and biomes based on expert knowledge of habitat requirements and information in standard reference works.
Separate indices were first calculated for each biogeographic realm and ocean. Multiple time-series for a single species within a realm or ocean would be treated as a single time-series, using the method described below, so that each species carried equal weight within each realm or ocean. Only estimates for the standard set of years 1970, 1975, 1980, 1985, 1990, 1995 and 2000 were used to calculate the index. Wherever an estimate was available for one of the standard set it was used. If there was no estimate for a standard year, but estimates were available before and after it, a value for the standard year was calculated by log-linear interpolation. Values for standard years were not obtained by extrapolation. For example, if counts were available for 1981 and 1984, values for the standard years 1980 and 1985 were not calculated. However, if counts were available for 1979 and 1986, values for 1980 and 1985 would be interpolated. Only series for which there were real or interpolated data for at least two standard years were included in further analyses. We recognize that it would be preferable to use only actual observations, to use data for all years and to avoid interpolation, but updating of the database for the early years is necessary before this can be done.
(c) Calculation of the index by the chain method
For each successive pair of standard years in each series we calculated the logarithm of the ratio of the population measure in one standard year to that of the standard year immediately preceding it. That is,
where the N are the two population measures. If a series contained one or more standard years in which N=0, the mean of N for all standard years with data was calculated and 1% of this mean was added to every observed N before calculating dt. Where there was more than one population series for a species for a given pair of standard years we calculated the mean value of dt across all series. Then, given species-specific values of dt for nt species, we calculated
The index for a terrestrial or freshwater realm or an ocean basin in standard year t was calculated as
Setting I1970 to 1, successive values of I1975, I1980, etc. were calculated.
Indices for terrestrial, freshwater and marine biomes were obtained by calculating the mean of the realm or ocean-specific values, and then calculating I as described. The overall LPI was calculated from the mean of terrestrial, freshwater and marine values (see figure 1).
Figure 1.
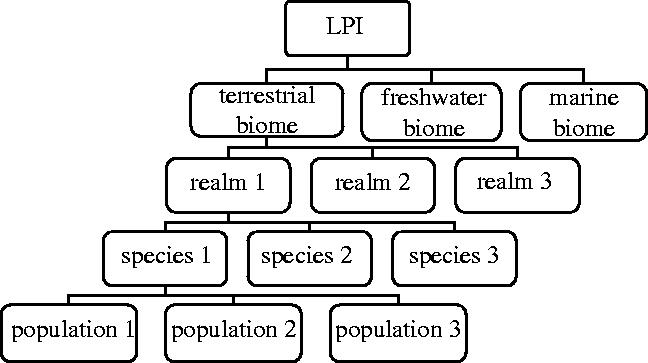
Hierarchy of indices within the LPI.
Confidence intervals for I were obtained by a bootstrap method. Each bootstrap replicate was calculated by the following procedure. For each interval, t−5 to t, a sample of nt species-specific values of dt were selected at random from the nt observed values with replacement. For a given realm or ocean, this was done for each interval, and and It values were calculated as described in § 2c. The bootstrap procedure was carried out 1000 times and the bounds of the central 950 I values for each standard year were taken to represent the 95% confidence interval for the index in that year for that realm. An extension of this procedure was also used to calculate confidence intervals for terrestrial, freshwater and marine biomes and for the overall index. To do this, bootstrap index values for each realm within a biome were used to calculate bootstrap biome-level index values as described above for a given realm or ocean. Bootstrap biome-level index values were then used to calculate bootstrap overall index values.
(d) Calculation of the index by a linear modelling method
In the future it is intended to make better use of all of the annual data collected and to circumvent the need to use data for standard years at five-year intervals by using a linear model to calculate the index. This method was tested on the existing standard year dataset to check the comparability of results with the chain method on the same data. N values were transformed to Xt=log(Nt). Series in which any N was zero were first modified by adding 1% of the mean, as described in § 2c. For a given realm or basin, a least-squares linear model was fitted with Xt as the dependent variable, and series and year as independent factors acting as main effects. The analysis was weighted by giving all values for species i in standard year of t a weight of wit=1/vit, where vit is the number of series for that species with data available in year t. The analysis yielded coefficients bt for the main effect of year, representing differences in the dependent variable between each standard year and the reference year (1970). Index values It for a given realm or basin were calculated by raising 10 to the power bt. Indices for terrestrial, freshwater and marine biomes were obtained by calculating the mean of the realm- or basin-specific bt values and then calculating I as described. The overall index for all biomes was calculated from the mean of biome-specific bt values.
(e) Analysis of the representativeness of LPI species
To quantify the taxonomic representativeness of the species included in the LPI, the numbers of species in each vertebrate class in the LPI dataset were compared with known species totals taken from Groombridge & Jenkins (2000).
To compare the LPI species' representativeness in terms of biogeographic realm and biome, the LPI species were compared with species lists compiled for each of the WWF ecoregions. The 825 WWF ecoregions covering the earth's terrestrial surface are classified according to biome and biogeographic realm. Importantly, all vertebrate species except fish that have been recorded as occurring in each ecoregion have been listed, so the total numbers of non-fish vertebrates living in each realm and biome have been calculated. These lists were used to compare the numbers of species in each realm and each biome in the LPI dataset with the numbers of species recorded as occurring in each realm and biome. To simplify the analysis, the 14 terrestrial ecoregion biomes were reduced to four (table 2), and the non-marine species in the LPI dataset were reclassified into these four simplified ecoregion biomes. It was not possible to carry out this analysis separately for freshwater and terrestrial species and it could not be attempted at all for marine species because species lists have not yet been completed for marine ecoregions.
Table 2.
Simplified ecoregion biomes used to analyse LPI species representativeness.
| simplified ecoregion biome | ecoregion biome |
|---|---|
| tropical and subtropical forest | tropical and subtropical moist broadleaf forest |
| tropical and subtropical dry broadleaf forest | |
| tropical and subtropical coniferous forest | |
| mangroves | |
| temperate and boreal forest | temperate broadleaf and mixed forest |
| temperate coniferous forest | |
| mediterranean forest, woodland and scrub | |
| boreal forest/taiga | |
| tropical grasslands, savannas and deserts | tropical and subtropical grasslands, savannas and shrublands |
| deserts and xeric shrublands | |
| flooded grasslands and savannas | |
| temperate grasslands, savannas and tundra | temperate grasslands, savannas and shrublands |
| montane grasslands and savannas | |
| tundra |
Finally, the representativeness in terms of threat status of the species in the LPI dataset was evaluated by comparing the number of LPI species in each threat category with the totals given in the 2000 IUCN Red List (Hilton-Taylor 2000). This was done for birds and mammals only because these were the only classes for which threat status had been assessed for all species.
3. Results
(a) Index values obtained by the chain method
The first step in the calculation of a terrestrial, freshwater or marine index is to calculate indices for each biogeographic realm. Examples for terrestrial species from the Nearctic and Afrotropical realms, based on data for 269 and 71 species, respectively, are shown in figure 2. The Nearctic realm index shows a −13% change from 1970 to 2000, with upper and lower 95% confidence limits at +1% and −27%, respectively, whereas the Afrotropical realm index shows a change of −62% over the same period, within confidence limits at −31% and −82%. The confidence intervals for the Afrotropical realm index are probably wider because it is based on a smaller sample of species.
Figure 2.
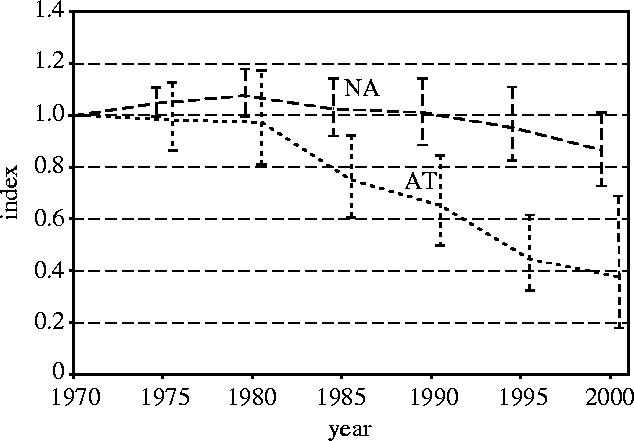
Nearctic terrestrial realm (NA) and Afrotropical terrestrial realm (AT) indices with 95% confidence intervals.
The next step is to calculate the index for terrestrial species from all the realm-level indices (figure 3). It should be noted here that each realm-level index contributes equally to the calculation of the terrestrial index, regardless of the size of the sample of species and the series upon which they are based. The terrestrial species index declined by 25% from 1970 to 2000, with upper and lower 95% confidence limits at +4% and −48%, respectively (figure 4), which reflects the low precision of the component realm-level indices based upon small samples.
Figure 3.
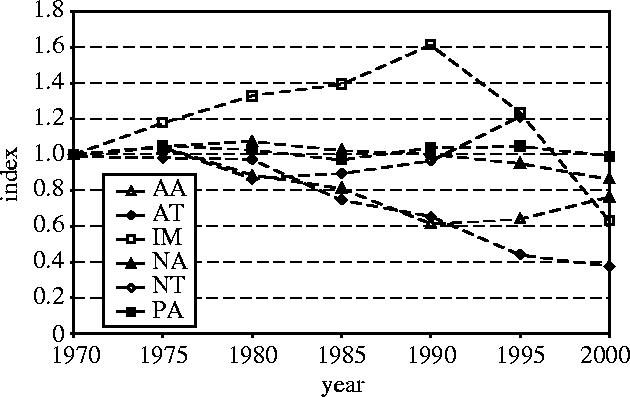
Indices for the six terrestrial realms (AA, Australasian; AT, Afrotropical; IM, Indo-Malayan; NA, Nearctic; NT, Neotropical; PA, Palaearctic).
Figure 4.
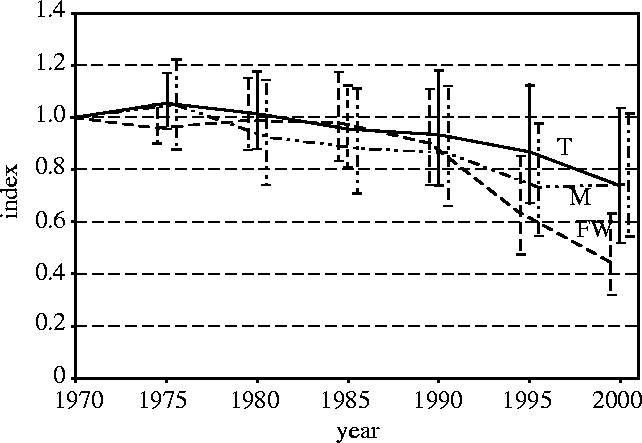
Terrestrial (T), freshwater (FW) and marine (M) indices, with 95% confidence intervals.
By following the same procedure, we calculated indices for freshwater and marine species from their realm-level components (figure 4). These indices are based on data for 299 species in six realms and 267 species in four oceans respectively. The freshwater species index fell by approximately 55% between 1970 and 2000, within 95% confidence limits ranging from −37% to −68%. The marine species index declined by about 25% over the same period, with upper and lower confidence limits at +2% and −46%.
As the last step in the procedure we calculated the overall LPI from the terrestrial, freshwater and marine indices (figure 5). It should again be noted that these three components are given equal weight in the calculation of the overall index, regardless of the number of species on which they are based. The overall LPI declined by 38% from 1970 to 2000, with upper and lower 95% confidence limits at −24% and −48%, respectively.
Figure 5.
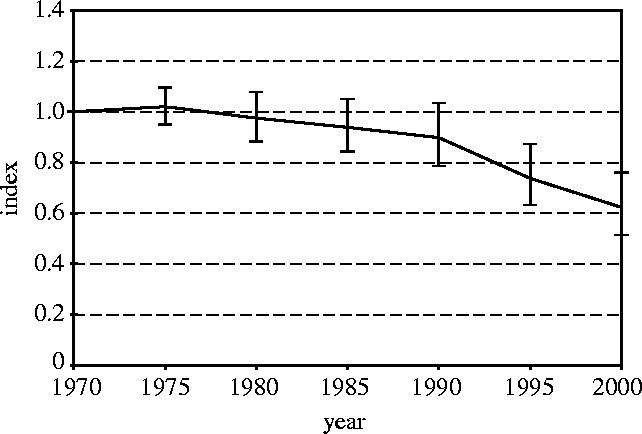
LPI with 95% confidence intervals.
(b) Comparison of indices calculated by the chain method and the linear modelling method
We used the chain and linear modelling methods to calculate the terrestrial index (figure 6). The two methods give very similar results. The linear modelling index declined slightly (about three percentage points) more over the 30-year period than the chain index. Confidence intervals have not been calculated for the linear modelling index. A bootstrapping procedure could be implemented to do this, but this is not straightforward because bootstrapping on series would lead to substantial variation among bootstrap samples in the number of series contributing to the calculation of changes across different time‐intervals.
Figure 6.
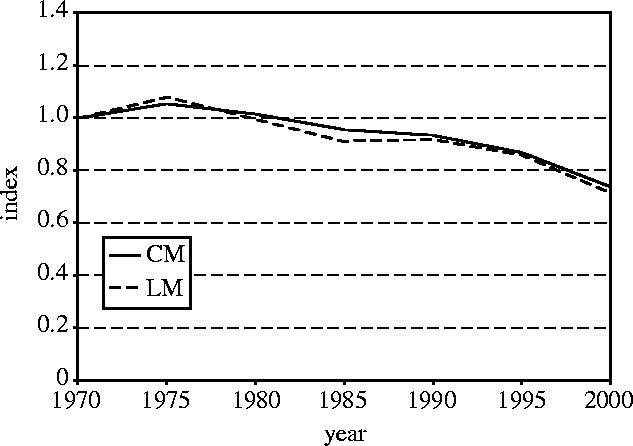
Terrestrial index calculated by both the chain method (CM) and the linear modelling (LM) method.
(c) Representativeness of species used to calculate the LPI
Birds and mammals are better represented in the LPI than fish, amphibians or reptiles. Population time series for approximately 6% of known bird species and nearly 5% of known mammal species are included in the LPI dataset, whereas the figures for fish, amphibians and reptiles are about 1% or less (figure 7).
Figure 7.
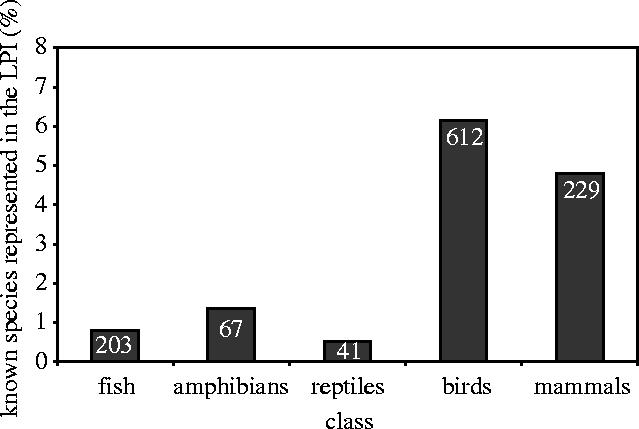
Percentage of known species in each vertebrate class that are represented in the LPI (figures in columns are total numbers of species included in the LPI).
Nearctic and Palaearctic species are over-represented in the LPI by comparison with species from the Australasian, Afrotropical, Indo-Malayan or Neotropical realms. Approximately 20% of all Nearctic vertebrate species (excluding fish) are included in the LPI, and about 6% of Palaearctic vertebrate species (excluding fish), whereas the statistics for the other realms are only around 1% or less (table 3). This imbalance reflects the facts that, while many more species population data have been collected in temperate North America and Europe, species diversity is far higher in tropical than in temperate regions. The expected distribution of species among classes and realms is compared with the actual numbers of species in each class and realm in table 4. A negative number indicates that a class is under-represented in a given realm and a positive number indicates that a class is over-represented in a given realm.
Table 3.
Number of non-marine vertebrate species in the LPI dataset, excluding fish, by vertebrate class and biogeographic realm. (Terrestrial and freshwater biomes only.)
| Australasian | Afrotropical | Indo-Malayan | Nearctic | Neotropical | Palaearctic | total | |
|---|---|---|---|---|---|---|---|
| amphibians | 5 | 0 | 9 | 46 | 2 | 5 | 67 |
| reptiles | 3 | 7 | 6 | 2 | 5 | 2 | 25 |
| birds | 12 | 21 | 4 | 293 | 17 | 172 | 519 |
| mammals | 6 | 54 | 28 | 41 | 7 | 45 | 181 |
| total | 26 | 82 | 47 | 382 | 31 | 224 | 792 |
| percentage of all recorded species | 0.6 | 1.4 | 0.9 | 20.0 | 0.3 | 6.3 | 2.6 |
Table 4.
Actual minus expected number of species in the LPI dataset, excluding fish, in each realm and vertebrate class. (Terrestrial and freshwater biomes only.)
| Australasian | Afrotropical | Indo-Malayan | Nearctic | Neotropical | Palaearctic | total | |
|---|---|---|---|---|---|---|---|
| amphibians | −9 | −20 | −11 | 39 | −58 | −5 | −63 |
| reptiles | −31 | −37 | −30 | −10 | −60 | −18 | −186 |
| birds | −36 | −36 | −47 | 275 | −81 | 133 | 208 |
| mammals | −12 | 24 | 4 | 29 | −26 | 22 | 41 |
| total | −87 | −69 | −84 | 333 | −225 | 132 | 0 |
Species of temperate and boreal forest classes are over-represented in the LPI compared with species of tropical and subtropical forest (6% versus 1%, respectively; figure 8). There is a similar over-representation of temperate grassland and tundra species compared with tropical grassland and desert species (3% versus <1%). This disparity again reflects the reality that data availability is lowest where species diversity is highest.
Figure 8.
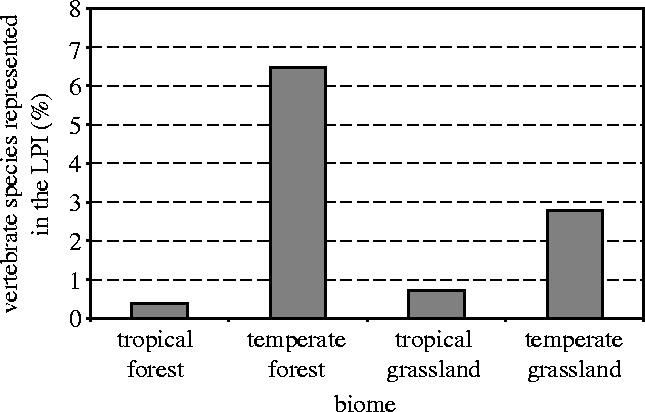
Percentage of all vertebrate species (excluding freshwater fish) recorded in each simplified ecoregion biome that are represented in the LPI.
Threatened bird and mammal species are slightly better represented in the LPI than non-threatened birds and mammals, but the difference is small. Approximately 6% of both threatened and non-threatened bird and mammal species' populations are included in the LPI (figure 9). Within the broad category of threatened species, critically endangered species are slightly better represented (about 10% of LPI bird and mammal species) than endangered species (about 7%), which are slightly better represented than vulnerable species (about 5%).
Figure 9.
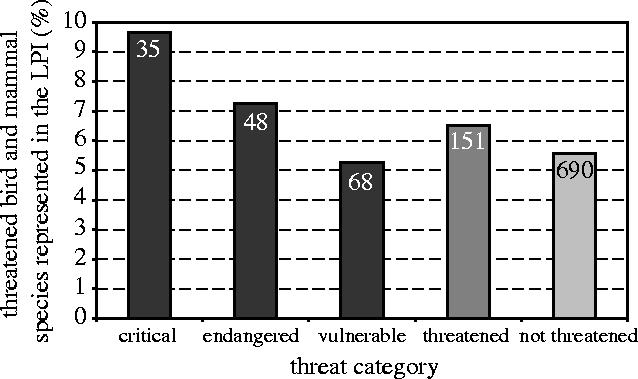
Percentage of all threatened bird and mammal species in each IUCN threat category that are represented in the LPI (figures in columns are total number of species included in the LPI).
4. Conclusions and future developments
The LPI indicates that populations of wild species of vertebrates have declined overall from 1970 to 2000. The extent to which this is a reflection of trends in global biodiversity as a whole has not been determined. In situations where habitat loss is the primary cause of population declines, it is reasonable to assume that there is a positive correlation between declines in vertebrate and non-vertebrate populations. Where hunting, fishing or indirect exploitation is the cause of a decline in a particular vertebrate species, the decline will not necessarily be indicative of population trends in other species in the same ecosystem. At large scales of entire realms, oceans, regions or biomes, overall declines in vertebrate populations are significant in their own right and may also be seen as indicative of changes in underlying ecosystem processes.
The LPI has a number of strengths as an indicator in the context of the CBD 2010 target. First, it is easy to understand and easy to communicate. It resonates with a non-scientific audience because it is analogous to well-known indicators like the Dow Jones Index, which seek to measure the mood of the financial community. Second, and importantly, data exist going back to the 1970s for many species, and even earlier for some. The existence of reasonably long time series is crucial for monitoring progress towards the 2010 target. Third, species population trends can be used as a proxy indicator of the state of the ecosystem that the species inhabit. Finally, species population trend indices can be constructed as indicators of biodiversity at any level: nationally, regionally, globally, or by biome or biogeographic realm, provided that sufficient data exist.
There are also a number of weaknesses with the LPI as a global biodiversity index. These weaknesses all relate to the representativeness of the population data. Data were taken from the literature according to availability and are often not the results of a designed programme of sampling of representative sites within a given species' range, nor of representative species within a biogeographic realm and vertebrate class. For some species, estimates of total population size were available, but more frequently the data were for small parts of a much larger range. These surveys were sometimes for randomly selected sites designed to cover the range, but more often they were not. Hence, it is possible that trends indicated by the series that were available for some species were not representative of those for the species as a whole. It is also possible that trends for the species for which we have data were not typical of species of that class in the biogeographic realm as a whole.
We have not yet attempted to quantify the extent of possible biases. It might be possible to obtain information regarding the motivation of researchers in setting up or publishing their work. It is certainly possible that some monitoring programmes have been carried out because a species or population was thought to be declining, or to monitor a response to beneficial management, either of which could lead to bias. It is difficult to see how these potential sources of bias could be fully quantified and even more difficult to see how they could be allowed for.
Even if the trends of species included in the LPI are taken to be representative of those for the whole of the particular class and realm to which they belong, there remains the problem of how to allow for the fact that a higher proportion of species from some classes and realms is included than from others. The over-representation in the dataset of species from certain realms and ocean basins is already partially allowed for in the method chosen to calculate the index, which gives equal weight to data-poor and data-rich realms. However, there is no equivalent allowance for the over-representation of some classes relative to others within a realm. In principle, it would be possible to post-stratify the data by class and realm and then to calculate the overall index for, say, terrestrial species by using weights of 1/pij, where pij is the proportion of species of class i present in the jth realm that are covered by the LPI database. This would reconstruct the expected index obtained if all class–realm combinations were subject to the same sampling rate. However, this is not possible in practice because the numbers of species for which data are available are too small in many class–realm combinations. Expansion of the database, especially for class–realms with data on few species, might eventually allow this approach to be implemented. The representation analysis (table 4) provides an indication of the realms and classes of species most needed.
Over-representation in the data of threatened species might also be a source of bias although our analysis indicates that this does not occur to any marked extent in the current datasets for birds and mammals. If present, this bias could be corrected by an extension of the method described in § 2b for class and realm, but this would require the expansion of the numbers of species contributing information to data-poor class–realm–threat category combinations.
Other problems caused by the scarcity of data are that (i) not all realms have data for the last time interval 1995–2000, so the aggregated index across all realms is unbalanced for this period, and (ii) the numbers of species in the sample for some years in some realms in some biomes are too small to use the bootstrap method to calculate confidence intervals reliably.
Indices consisting of a chain of estimates of year-to-year change may show drift if series begin and end in different years and do not cover the whole time period (Geissler & Noon 1981). Though our data are of this kind, there was little difference between indices calculated by the chain method and by the least-squares linear model, which allows for staggered entry and termination and missing data in intervening years. Even so, we propose that linear model calculations should replace the chain method because it would then be possible to use the full dataset of annual data without interpolating missing values.
At present the index includes populations of indigenous and non-native species. This may be regarded as undesirable for many purposes because declines in populations of indigenous species represent a decline in the biodiversity value in a region, whereas many would consider declines in alien species to increase biodiversity value. Data for non-native species could be deleted from the LPI in future. The option of producing separate indices for native and non-native species is not feasible at present because the data available for non-native species are insufficient.
In conclusion, although the LPI has faults that cannot easily be remedied, we suggest that, even in its present form, some of the problems arising from the over-representation of some classes and realms are reduced by the way that the index is calculated. It would be possible to carry this reduction further by post-stratification and weighting if sufficient new information can be collected for data-poor classes, realms and biomes. Putting all the LPI population time-series into a searchable interactive database that is accessible on the Internet and allowing remote data input from anywhere in the world might allow the necessary expansion of data holdings, though special efforts such as regional workshops to stimulate the collection and donation of data would probably also be needed. Rigorous and transparent systems for checking the quality of data are also required and might be organized by groups of experts on each vertebrate class.
Footnotes
One contribution of 19 to a Discussion Meeting Issue ‘Beyond extinction rates: monitoring wild nature for the 2010 target’.
Author for correspondence
References
- de Heer, M., Kapos, V. & ten Brink, B. 2005 Building a policy relevant species trend index for Pan-Europe from disparate data sources. Phil. Trans. R. Soc. B360
- CBD 2000 Decision VI/26. UNEP/CBD/COP/6/20.
- Geissler P.H, Noon B.R. Estimates of avian population trends from the North American breeding bird survey. Stud. Avian Biol. 1981;6:42–51. [Google Scholar]
- Green, R. E., Balmford, A. P., Crane, P. R., Mace, G. M., Reynolds, J. D. & Turner, R. K. 2005 A framework for improved monitoring of biodiversity: responses to the World Summit on Sustainable Development. Conserv. Biol.19, 56–65.
- Gregory, R. D., van Strien, A. & Vorisek, P. 2005 Developing indicators for European birds. Phil. Trans. R. Soc. B360 [DOI] [PMC free article] [PubMed]
- Groombridge B, Jenkins M.D. World Conservation Press; Cambridge: 2000. Global biodiversity: Earth's living resources in the 21st century. [Google Scholar]
- Hilton-Taylor C. IUCN; Gland, Switzerland: 2000. 2000 IUCN Red List of threatened species. [Google Scholar]
- Kapos V, Jenkins M, Loh J. World Bank; Washington, DC: 2004. Rising to the biodiversity challenge. The role of species population trend indices like the Living Planet Index in tracking progress towards global and national biodiversity targets. [Google Scholar]
- Loh J, editor. Living Planet Report 2000. WWF; Gland, Switzerland: 2000. [Google Scholar]
- Loh J, editor. Living Planet Report 2002. WWF; Gland, Switzerland: 2002. [Google Scholar]
- Loh, J. & Wackernagel, M. (eds) 2004 Living Planet Report 2004 Gland, Switzerland: WWF.
- Loh J, Randers J, MacGillivray A, Kapos V, Jenkins M, Groombridge B, Cox N. WWF; Gland, Switzerland: 1998. Living Planet Report 1998. [Google Scholar]
- Loh J, Randers J, MacGillivray A, Kapos V, Jenkins M, Groombridge B, Cox N, Warren B. WWF; Gland, Switzerland: 1999. Living Planet Report 1999. [Google Scholar]
- WWF 2000 The global 200 ecoregions. A user's guide Washington, DC: WWF.


