

Abstract
The Southern African Millennium Ecosystem Assessment (SAfMA) evaluated the relationships between ecosystem services and human well-being at multiple scales, ranging from local through to sub-continental. Trends in ecosystem services (fresh water, food, fuel-wood, cultural and biodiversity) over the period 1990–2000 were mixed across scales. Freshwater resources appear strained across the continent with large numbers of people not securing adequate supplies, especially of good quality water. This translates to high infant mortality patterns across the region. In some areas, the use of water resources for irrigated agriculture and urban–industrial expansion is taking place at considerable cost to the quality and quantity of freshwater available to ecosystems and for domestic use. Staple cereal production across the region has increased but was outstripped by population growth while protein malnutrition is on the rise. The much-anticipated wood-fuel crisis on the subcontinent has not materialized but some areas are experiencing shortages while numerous others remain vulnerable. Cultural benefits of biodiversity are considerable, though hard to quantify or track over time. Biodiversity resources remain at reasonable levels, but are declining faster than reflected in species extinction rates and appear highly sensitive to land-use decisions. The SAfMA sub-global assessment provided an opportunity to experiment with innovative ways to assess ecosystem services including the use of supply–demand surfaces, service sources and sink areas, priority areas for service provision, service ‘hotspots’ and trade-off assessments.
Keywords: ecosystem services, assessment, Southern African Millennium Ecosystem Assessment, human well-being, multi-scale
1. Introduction
A comprehensive view of biodiversity includes all levels of biological organization, from genes through ecosystems, and embraces the three main aspects of diversity: composition, structure and function (Noss 1990). Although this is accepted in principle by bodies such as the Convention on Biological Diversity; to date, indicators of biodiversity have overwhelmingly focused on species composition (Biggs et al. 2004). This paper argues that the notion of ‘ecosystem services’, i.e. the benefits that people derive from ecosystems, is a logical and feasible way of addressing the neglected area of ecosystem functional diversity.
Ecosystems provide people with a variety of important services, ranging from ‘goods’ such as food, water, fuel and timber to indirect benefits such as flood mitigation and climate regulation, and less tangible things such as spiritual and aesthetic well-being (MA 2003). Ensuring the continued flow of benefits derived from ecosystems to both people and ecosystems in the future requires the effective conservation and management of critical ecosystem processes. The remarkable ability of humankind to appropriate ecosystem processes and products for its own benefit without considering their appropriate and long-term management (Heywood et al. 1995; Pimm 2001) lies at the heart of the present global biodiversity crisis. Ecosystem simplification, or loss of heterogeneity in exchange for an increase in common or weedy species, is a well documented outcome of this human dominance, and it has significant implications for biodiversity (Pimm 2001; Fabricius et al. 2003). The end result is that the abundance of a few species such as human domesticates and some opportunistic species that thrive in human-altered landscapes increases dramatically, while the populations of the vast majority of species decline, sometimes to the point of local or global extinction. There is a parallel simplification of structure, at all scales, and a dominance of ecosystem function by narrower groups of species. In highly transformed landscapes, whole aspects of ecosystem service provision may be taken over by human activities: the substitution of natural soil fertility based on nutrient cycling with the provision of artificial fertilizers is an example. The degree of simplification that ecosystems can tolerate before ecosystem services of consequence to human well-being are compromised is in general unknown, but is anticipated to vary between ecosystems and services (Royal Society 2003). The intimate relationship between human well-being and ecosystem condition led to the growing recognition that the World Summit on Sustainable Development (WSSD) objective of reducing the rate of biodiversity loss by 2010 cannot be achieved without taking cognisance of the dependence of people around the world on ecosystem services. Thus, in the modern world, the notion of ecosystem function has limited relevance if assessed in isolation from human needs and aspirations.
As for many other components of biodiversity, our lack of knowledge about many ecosystem services and their management is a major impediment to adequate planning and management. In the present paper, we review some of the major findings of the multi-scale Southern African Millennium Ecosystem Assessment (SAfMA) about the state of the region's ecosystem services and the implications for human well-being. We also focus on some innovative approaches that emerged from SAfMA for developing a better scientific basis to monitor progress towards the WSSD target of a reduction in the rate of biodiversity functional losses (see Noss 1990).
2. The Southern African Millennium Ecosystem Assessment
The Millennium Ecosystem Assessment (MA) set out to systematically assess the present condition and trends of global ecosystems, drivers of ecosystem change, the state of their governing processes, and the ability of ecosystems to continue providing services in support of maintaining ecosystem integrity and human well-being. The MA is a 4-year international initiative designed to meet the needs of decision-makers for scientific information about the links between changes in ecosystem ‘goods and services’ (food, timber, water purification, biodiversity, etc.) and how these affect human well-being (health security, livelihood security, cultural security, etc.; MA 2003). The MA, in collaboration with its user groups (such as NGOs, government ministries, the scientific research community), set itself the goals of assessing the current conditions and trends in the supply of and demands for ecosystem services; developing scenarios of plausible future changes in the supply and demand for ecosystem services; and exploring suitable responses that would improve ecosystem management and human well-being (MA 2003).
SAfMA is linked to the MA and is one of approximately 30 sub-global assessments linked to the MA. The SAfMA sub-global assessment provides southern African decision-makers with critical information about the state of important ecosystem services, emphasizing the types of policy interventions, trade-offs and management responses required for pursuing sustainable ecosystem service provisioning and for improving human well-being across the region. The multi-scale SAfMA design recognizes that ecosystem services are highly differentiated in space and time, and that sound management of these systems requires careful local planning and action (MA 2003).
The objectives of SAfMA are to provide reliable and useful information on the relationships between ecosystem services and human well-being in southern Africa; to enhance the capacity in the southern African region to conduct integrated assessments; and thereby to promote sustainable development at local to regional scales. The southern African sub-global assessment (SAfMA) was conducted at three scales in a fully nested design (figure 1). The regional assessment covered 19 countries in mainland Africa that lie south of the Equator. Nested within the regional assessment, were basin-scale assessments of two major drainage basins (the Zambezi and Gariep). Within the basins were several ‘community-based studies’, which were typically at the scale of a village, city or even a broader eco-region. The different scales were chosen to make it possible to investigate processes at the scales at which they take place, to take into account feedbacks between scales, to help ensure that perspectives at any given scale are reflected in the analysis and conclusions at other scales, to allow evaluation of the scale-dependence of various actions and policies, and to meet the needs of different users (see Biggs et al. 2004).
Figure 1.

The location of assessment sites in the Southern African Millennium Ecosystem Assessment (SAfMA) which approximates the greater South African Development Community (SADC) region. The inset (upper right) shows the nested assessment design (Biggs et al. 2004).
3. Trends in key southern African ecosystem services
The approach adopted by the MA was to view ecosystem ‘services’ as a collective term for both ‘goods’ and ‘services’, as the distinction between the two was often unclear (MA 2003). At least four categories of services can be distinguished: provisioning services (mostly ‘goods’), supporting services (prerequisites for the delivery of other services), regulating services (those responsible for keeping ecosystem functioning bounded) and cultural services (those which enrich human existence). This human-centred approach to ecosystem services adopted by the MA (table 1) provides several benefits including explicitly defining the importance of ecosystem services in terms of its contribution to human well-being, circumventing the ‘infinite value’ problem by valuing services in terms of their contributions to altering human well-being measure(s), and providing clear linkages to possible policy interventions (e.g. desertification, degradation, biodiversity loss).
Table 1.
The Millennium Ecosystem Assessment classification of ecosystem services (MA 2003).
| provisioning | regulating | cultural | supporting |
|---|---|---|---|
| goods produced or provided by ecosystems: | benefits obtained from regulation of ecosystem processes: | non-material benefits obtained from ecosystems: | services necessary for production of other ecosystem services: |
| food | climate regulation | spiritual | soil formation |
| fresh water | disease regulation | recreational | nutrient cycling |
| fuel-wood | flood regulation | aesthetic | primary production |
| fibre | detoxification | inspirational | |
| biochemicals | educational | ||
| genetic resources | communal | ||
| symbolic |
The key services that were selected for analysis by SAfMA were water, food, biodiversity and wood-fuel. Individual assessments were also encouraged to include additional services such as cultural services in their assessment.
(a) Freshwater
The provision of freshwater constitutes a non-substitutable and critical ecosystem service in contrast with freshwater ecosystems that provide a range of services. Vital for human survival and sanitation, freshwater is also crucial for the maintenance of other important ecosystem processes and the viability of many economic sectors, such as agriculture, industry and tourism. In addition, freshwater ecosystems provide a range of regulating services such as natural flood control, water filtering, water storage, erosion control and a whole range of food and material products such as fishes, shellfish, timber and fibre. Growing human populations, increasing levels of household and industrial consumption, water policies and climate change are some of the factors that will affect future water availability in the southern African region (Biggs et al. 2004).
Access to an adequate supply of safe water is a fundamental need and human right. The United Nations set a minimum target of 1000 m3 of water per person per year to satisfy human needs. If supply drops below this level, it can lead to problems with food production and economic development, unless the region is wealthy enough to apply technologies for regulating water use and promoting conservation or re-use. Adequate access to water also means that the considerable amount of time women and children spend fetching water can be spent on more productive tasks that improve livelihoods and economic productivity, a key component of poverty alleviation. A summary of water use and availability across southern Africa is provided in table 2. On average, agriculture is responsible for 74% of the region's water use; domestic and industrial uses, respectively, comprise 17 and 9% of total water use.
Table 2.
Water availability and use in southern Africa for the year 2000, as compiled in the SAfMA regional scale study (Scholes & Biggs 2004). (Water availabilities below 1000 m3/person/year (bold) can lead to serious problems with food production and economic development. Lack of access to safe water is a major cause of illness and death, especially among children in rural areas, where access is usually poorer than in urban areas.)
| country | renewable water resourcesa (km3 per year) | total water use (km3 per year) | water per personb (m3/person/year) | access to improved water (% tot. pop.) | access to improved sanitation (% tot. pop.) | under-five mortality (per 1000 births) |
|---|---|---|---|---|---|---|
| Angola | 184.00 | 0.34 | 13 620 | 38 | 44 | 260 |
| Botswana | 14.40 | 0.14 | 8471 | 95 | 66 | 110 |
| Burundi | 3.60 | 0.23 | 519 | 78 | 88 | 190 |
| Congo | 832.00 | 0.04 | 268 387 | 51 | — | 108 |
| Dem. Rep. Congo | 1283.00 | 0.36 | 24 508 | 45 | 21 | 205 |
| Equat. Guinea | 26.00 | 0.11 | 55 319 | 44 | 53 | 153 |
| Gabon | 164.00 | 0.13 | 130 159 | 86 | 53 | 90 |
| Kenya | 30.20 | 1.58 | 982 | 57 | 87 | 122 |
| Lesotho | 3.02 | 0.05 | 1467 | 78 | 49 | 132 |
| Malawi | 17.28 | 0.11 | 1641 | 57 | 76 | 183 |
| Mozambique | 216.11 | 0.64 | 11 960 | 57 | 43 | 197 |
| Namibia | 17.94 | 0.27 | 10 022 | 77 | 41 | 67 |
| Rwanda | 5.20 | 0.08 | 656 | 41 | 8 | 183 |
| South Africa | 50.00 | 15.31 | 1156 | 86 | 87 | 71 |
| Swaziland | 4.51 | 0.83 | 4215 | 48 | 44 | 149 |
| Tanzania | 91.00 | 2.00 | 2642 | 68 | 90 | 165 |
| Uganda | 66.00 | 0.30 | 2896 | 52 | 79 | 124 |
| Zambia | 105.20 | 1.74 | 10 233 | 64 | 78 | 202 |
| Zimbabwe | 20.00 | 2.61 | 1560 | 83 | 62 | 123 |
| regionb | 26.87c | 11 390 | 61 | 63 | 155 |
Total surface and groundwater resources (corrected for partial overlap) within a country's borders, plus or minus the natural flows entering and leaving the country, as well as flows secured through treaties and agreements with other countries. Aggregation cannot be done for the region as it would result in double counting of shared water resources.
Population-weighted means.
Weighted by total renewable resources of each country.
While the absolute quantity of available water is an important issue, the key problems of water access, including economic access, usually relate to obtaining water of an adequate quality at an affordable rate. Lack of access to safe water is a major cause of illness and death, especially among children in rural areas, where access is usually poorer than in urban areas. The most common water-related diseases include diarrhoea, intestinal worms, cholera, trachoma and schistosomiasis (bilharzia). Frequent exposure to parasitic and diarrhoeal illnesses associated with poor water quality and sanitation can speed the progress of HIV infection to full-blown AIDS. Deteriorating water quality resulting from pollution can also be a barrier to the use of water for irrigation and even industrial development. Treating water that has been polluted by mining and industrial activities, fertilizer application or poor waste disposal is difficult and expensive (Biggs et al. 2004).
Degradation of freshwater ecosystems (e.g. siltation) has further important impacts on human well-being. In parts of the region such as the Zambezi River basin, fishes from rivers, lakes and wetlands are a major source of protein in low-income families. Habitat degradation and pollution of freshwater ecosystems, resulting in the decline of fishes stocks, can therefore have important impacts on both food and water security. Land clearance in river catchments and the degradation of wetlands may increase the risk of episodic flooding with its associated losses of infrastructure. Degradation also reduces the water storage capacity and, consequently, the seasonal water availability across the ecosystem (Biggs et al. 2004). Longer-term degradation is evident in some parts of the highly transformed Gariep basin, a finding that was reiterated in the local-scale assessments. For example, in the Machibi community Great Fish River Valley of South Africa, water quality varies with land ownership. Between 1960 and 2000, the local community has experienced a decrease in the quality of water on communal land, but believes that water quality on state land has remained constant (see figure 2; Shackleton et al. 2004). This impacts on their livelihoods in several different ways: they have to spend more time collecting clean water; the small percentage that have access to tap water have no alternatives when reticulated water systems fall into disrepair; culturally and medicinally important trees and shrubs that used to grow next to perennial streams are disappearing; and people invest larger proportions of their meagre incomes in improving their water security by, for example, buying expensive rain water tanks (Shackleton et al. 2004). In the Richtersveld National Park, pastoralists and their small stock would not be able to exist without reliable access to water from the Gariep River, especially during the hot dry summer months (Shackleton et al. 2004). The Gariep and its narrow flood-plain form the lifeline for these pastoralists, providing them with a sustainable supply of fuel-wood and browse as well as shade during the hot summer period. Without the buffering effect of the Gariep's water on the moisture content of the alluvial soils, these services would not be available. In winter, springs further inland enable pastoralists to use pastures that would otherwise be inaccessible.
Figure 2.
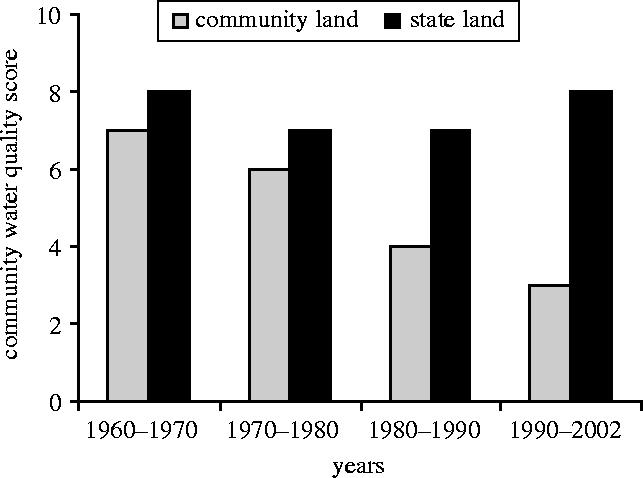
In the Great Fish River Valley in South Africa, the perception of a local community about water quality varies with land ownership. The local community has experienced a decrease in the quality of water on community land, but believes that water quality on state land has remained constant. Scores 0–10 (y-axis) reflect the relative weights placed on water quality declines by the community in a participatory process (see Shackleton et al. 2004).
(i) Trends in water resources
Freshwater services in southern Africa were found to be under increasing pressure across the subcontinent. The average water availability per capita is expected to decline from 11 390 to 6836 m3 per year between 2001 and 2030 (Scholes & Biggs 2004). Areas such as Burundi, Kenya, Malawi and Rwanda are expected to remain or drop below the 1000 m3/person/year ‘scarcity’ level which is indicative of shortages in food production and economic hardship. Water availability in South Africa, Tanzania and Uganda are expected to decline below the 1700 m3/person/year mark, making these regions vulnerable to serious water shortages by 2030 (Scholes & Biggs 2004).
(b) Food
The southern African region as a whole has the agricultural potential, with respect to climate, soil and terrain slope constraints, to grow enough food for its population, even in the face of climate change and population growth and with a generous margin to spare for export or non-food cash crops (Scholes & Biggs 2004). Projecting current trends forward, however, indicates that in the absence of major interventions, tens of millions more people will be vulnerable to food shortages in 2020 compared with the present, and many of the Millennium Development Goals for hunger reduction, set by the United Nations General Assembly during the Millennium Summit in September 2000, will not be met. The principal reasons that distribution does not simply translate to adequate nutrition levels are related to access. In southern Africa, economic access to adequate food supplies by the poor is restricted by low incomes and global market asymmetries that drive export commodities to prices that cannot be met by local consumers (Bohensky et al. 2004).
Estimates of the percentage contributions of carbohydrate- and protein-supplying crops in southern Africa to total dietary intake are provided in table 3 (Scholes & Biggs 2004). Domestic-animal based products provide, on average, 14% of the recorded protein consumption in the region, fishes provide 4%, and the remaining 81% comes almost entirely from plant sources, primarily cereals. Several countries fall significantly short of the recommended minimum daily intake of 2100 kcal per person. The region as a whole falls below the recommended minimum daily intake of protein of 52 g per person. On average, the supply is below 50 g/person/day (table 3), with the Democratic Republic of Congo (DRC) and Mozambique falling substantially below this requirement. There are clear within-region differences: south of the Zambezi, the average is 75 g/person/day and stable, north of this line it is 42 g/person/day and declining. The countries with the most severe protein deficiencies are those on the relatively moist but infertile interior plateau of Africa, where the carbohydrate diets are dominated by root crops rather than maize and pulses. The limited nitrogen-supplying capacity of the soil is the underlying factor, and the decline in protein coincides with a levelling off of the (low) levels of fertilizer input in these regions (Biggs et al. 2004).
Table 3.
Estimated percentage contributions of carbohydrate- and protein-supplying crops in southern Africa to total dietary intake (Scholes & Biggs 2004). (Several countries fall below the recommended minimum daily intake of calories (2100 kcal/person/day) and protein (52 g/person/day. Note: these figures are national averages: within-country disparities in food availability and consumption is often larger than those between countries; — represents no data.)
| carbohydrate nutrition | protein nutrition | |||||||||
|---|---|---|---|---|---|---|---|---|---|---|
| grand total (kcal/person/day) | percentage contributiona | grand total (g) | percentage contributiona | |||||||
| cereals | roots | pulses | fruit and veg. | cerealsb | roots | pulses | animal products | |||
| Angola | 1885 | 33 | 35 | 4 | 3 | 41.3 | 39 | 15 | 11 | 23 |
| Botswana | 2264 | 47 | 2 | 5 | 3 | 71.2 | 40 | 1 | 12 | 31 |
| Burundi | 1632 | 16 | 33 | 24 | 11 | 44.1 | 15 | 14 | 51 | 5 |
| Congo | 2159 | 25 | 38 | 1 | 6 | 42.8 | 36 | 13 | 4 | 24 |
| Dem. Rep. Congo | 1616 | 19 | 58 | 2 | 4 | 24.1 | 32 | 23 | 9 | 9 |
| Eq. Guinea | — | — | — | — | — | — | — | — | — | 0 |
| Gabon | 2569 | 28 | 18 | 0 | 16 | 73.7 | 24 | 8 | 0 | 32 |
| Kenya | 2020 | 50 | 7 | 3 | 6 | 53.2 | 51 | 3 | 8 | 27 |
| Lesotho | 2298 | 78 | 3 | 3 | 1 | 63.7 | 77 | 3 | 6 | 9 |
| Malawi | 2133 | 60 | 16 | 5 | 4 | 53.4 | 62 | 11 | 13 | 6 |
| Mozambique | 1919 | 41 | 35 | 4 | 1 | 38.0 | 56 | 14 | 15 | 8 |
| Namibia | 2650 | 55 | 12 | 2 | 2 | 77.6 | 48 | 7 | 4 | 28 |
| Rwanda | 1919 | 15 | 33 | 14 | 25 | 48.1 | 21 | 18 | 40 | 6 |
| South Africa | 2875 | 54 | 2 | 1 | 3 | 76.6 | 57 | 2 | 2 | 28 |
| Swaziland | 2529 | 47 | 2 | 2 | 2 | 63.7 | 47 | 1 | 4 | 33 |
| Tanzania | 1942 | 50 | 21 | 5 | 4 | 47.6 | 49 | 10 | 13 | 16 |
| Uganda | 2324 | 22 | 22 | 8 | 23 | 56.2 | 20 | 11 | 22 | 17 |
| Zambia | 1888 | 65 | 13 | 1 | 1 | 47.1 | 68 | 4 | 2 | 11 |
| Zimbabwe | 2080 | 57 | 2 | 2 | 1 | 49.9 | 65 | 1 | 4 | 12 |
| regionc | 2088 | 42 | 21 | 4 | 6 | 48.8 | 45 | 11 | 11 | 17 |
Percentages do not add to 100, as not all sources are listed.
Excluding beer.
Population-weighted totals.
Forty-three per cent of the fish-catch in southern Africa is supplied from the Benguela current fishery of the west coast of South Africa, Namibia and Angola (DEAT 2000; Scholes & Biggs 2004); 36% from the freshwater fisheries, primarily in the Great Lakes region; and 21% from the warm water marine fisheries off the east coast of South Africa, Mozambique, Tanzania and Kenya (FAO 2003; Scholes & Biggs 2004). The Benguela fishery shows no overall trend in its total stocks, despite significant inter-annual variability, shifts in species, and a sustained offtake of over a million tons per year for several decades. The lakes fisheries show classical signs of overfishing. Data on the east coast fisheries are sparse and it is probable that in many respects they are overfished (Scholes & Biggs 2004).
Wild plants and animals play a critical but under-reported role in food security and nutrition across southern Africa, particularly during times of drought or food insecurity, and in arid and semi-arid areas. Wild species (‘bushmeat’) including antelope, monkeys, rodents and reptiles, as well as a range of invertebrates such as snails, termites and beetles, are consumed on a regular basis as part of the diets of rural southern Africans. Estimates of the contribution of bushmeat to the total daily dietary intake of protein range from 0.1% in South Africa to 8.5% in the DRC. Estimates are, however, based on very limited data and are not considered to reflect the true intake for many rural communities. The absence of reliable records is in part owing to bushmeat being largely consumed within the household or sold through local markets, so that the volumes are not easily captured in formal information systems. Furthermore, bushmeat harvesting is often illegal. When asked to rank nine possible food sources in order of consumption, pastoralists in Richtersveld National Park ranked game second from last (in eighth place). This is difficult to believe, given that they live in a large and under-staffed protected area. One pastoralist remarked: ‘One can only kill game secretly, if it becomes known, jail is your future’ (De Klerk 2003). Subsistence hunting and gathering of bushmeat is estimated to account for 90% of bushmeat offtake on the African continent and for many communities it increasingly constitutes a major informal industry critical to livelihoods (Biggs et al. 2004).
The formal legal wild meat market is estimated to total 8500 metric tons annually, with a value of over US$7.5 million, in Botswana, Mozambique, Zimbabwe, Zambia, Malawi, Tanzania and Kenya. In Botswana, 46% of rural households consume bushmeat, at an average of 18.2 kg per month in some areas. It is estimated that 50 tonnes is traded in Maputo province of Mozambique every year. Bushmeat is 30–50% cheaper than domestic meat in the rural areas of Zimbabwe and Botswana, but affluent urbanites are willing to pay 43% more for bushmeat than for domestic meat in Zambia and 157% more in Mozambique (Barnett 2000). Formal game meat production has, however, been largely hamstrung by policy and legislative constraints. Illegal bushmeat utilization, meanwhile, is increasing, but the same policy constraints and lack of support for programmes aimed at the sustainable use of wildlife, are leading to unsustainable off-take and a depletion of the wildlife resource base (Scholes & Biggs 2004). Improved access to fire-arms, which became more easily available after the advent of democracy in the sub-region, is also playing a role.
(i) Food security in southern Africa
Food security may be defined as access, at all times, to sufficient food for a healthy and active lifestyle. Food insecurity compromises human well-being in a number of ways, and in its extreme form leads to an inadequate intake of macronutrients (protein, carbohydrates and fats) and/or micronutrients (vitamins and minerals), which in turn causes hunger, under-nourishment and malnutrition. Sub-Saharan Africa is considered the most food-insecure region of the world, having the highest prevalence of malnutrition (FAO 2002). Between 1992 and 2001, the average prevalence of population-weighted weight stunting in the region among children under five was 25% (Biggs et al. 2004).
The SAfMA assessment also highlighted how food security was not only attributable to patterns of food production, but was a multi-dimensional condition compounded by numerous social, health-related and economic drivers such as household income, access to markets, distribution issues, globalization and especially HIV/AIDS prevalence in a community (Bohensky et al. 2004). Rural households in the remote mountains of Lesotho attributed food insecurity to a lack of land for cultivation, the extreme climate and reduced access to manure fertilizers owing to unmanageable stock theft. In the Great Fish River, access to reticulated water meant that people could cultivate smaller, more productive gardens instead of large, unproductive dry lands before water became available (Shackleton et al. 2004).
(ii) Trends in food consumption
Trends in average total calorie consumption and associated production factors from southern Africa (1960–2000) indicate that countries that rely primarily on root crops have maintained consumption levels just below minimum requirements (2100 kcal/person/day) while cereal-reliant countries have managed to maintain average intakes slightly above the recommended minimum (FAO 2002). Total cereal production doubled since 1960 and the area under cultivation increased by 30% while the population tripled. Fertilizer usage increased sevenfold from 1960 to 1980 and then levelled off (Scholes & Biggs 2004). Over the same period, protein consumption per person per day peaked in the 1980s, marginally above the minimum requirement of 56 g for men and 48 g for women. This figure has subsequently declined to pre-1960 levels, below minimum requirements (FAO 2002), possibly reflecting chronic nitrogen shortages in ecosystems from the northern half of the region and the fact that increases in livestock numbers were outstripped by human population growth between 1960 and 2000 (Scholes & Biggs 2004).
(c) Wood-fuel
Southern Africa has been predicted to be on the brink of a wood-fuel crisis for decades (Eckholm 1975; FAO 1983). The problem has not gone away, but neither has it resulted in general, national-scale catastrophes. One of the reasons is that the early analyses of the ‘wood-fuel gap’ were crude and unsophisticated. Although widespread, wood scarcity is a relatively local-scale phenomenon and does not lend itself to large-scale averages. The SAfMA approach has the advantage that it undertook wood-fuel analyses at a variety of scales, from regional to local.
As wood is a renewable resource, the correct technical analysis is to compare the local production rate with the local harvest rate, and to take spatial anomalies in production and consumption into account. Where harvest exceeds production, the stock will inevitably decline, and despite some regrowth in the depleted area, the zone in which harvesting occurs will expand until the effort required to transport the wood or charcoal exceeds its value. Initially only large, dead, fallen branches are taken, focusing on the most preferred species. As wood becomes scarce, all species are targeted, and living trees first pruned and then felled. The price of fuel rises (either the actual market price, or the opportunity cost of the wood-gatherers, who are typically women) and per household consumption declines. Eventually all twigs, leaf litter, agricultural residues and dung are collected, with negative impacts on soil structure and fertility, and the household is forced to switch partly or completely to alternative energy sources (Biggs et al. 2004).
Averaged over the entire region, much more wood is grown than is consumed as fuel (figure 3). Nevertheless, several clearly defined areas of local insufficiency (i.e. inferred locally unsustainable use) emerged from the SAfMA regional scale analysis: (i) western Kenya, southeast Uganda, Rwanda and Burundi; (ii) southern Malawi; (iii) The area around Harare in Zimbabwe, Ndola and Lusaka in Zambia; (iv) Lesotho and (v) locations in the former homelands of South Africa in the KwaZulu, Eastern Cape and Limpopo provinces and around Gauteng—Johannesburg (Scholes & Biggs 2004).
Figure 3.
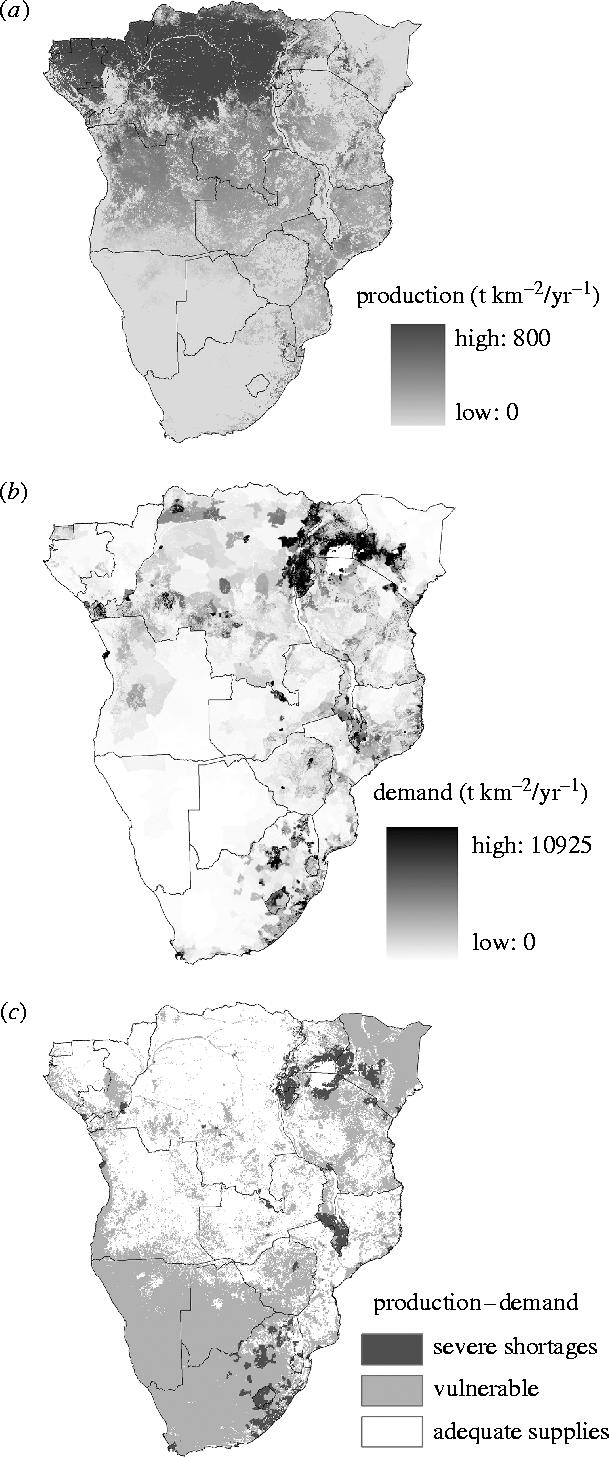
Wood-fuel harvesting is sustainable when (a) the rate of wood growth exceeds (b) the rate of wood use. The predicted areas with adequate supplies and shortage for the year 1995 are shown in (c) (Scholes & Biggs 2004).
At the community level, key resource areas may produce an adequate supply of wood in areas which, at face value, should show a wood-fuel deficit. At Richtersveld National park, for example, preferred wood-fuel trees on the alluvial flood-plain of the Gariep contain significant amounts of dead wood, leading to the conclusion that the supply of fuel exceeds the demand (Shackleton et al. 2003; table 4).
Table 4.
Mean percentage dead wood per stem (±s.d.) on preferred fuel-wood species on the Gariep floodplain, Richtersveld National Park (Shackleton et al. 2003).
| species | mean % deadwood per stem |
|---|---|
| Ziziphus mucronata | 27.8±5.4 |
| Euclea pseudobenus | 8.8±2.4 |
| Tamarix usneoides | 12.2±2.9 |
| Prosopis spp. | 0.3±0.2 |
(i) Trends in wood-fuel use
Wood-fuel is likely to remain an important energy source in Africa in the coming decades (Arnold et al. 2003). Although its relative contribution to national energy supplies is likely to decline, the absolute number of people needing wood-fuel by 2030 is expected to increase by 50% and an estimated three quarters of the household energy will still be supplied by biomass fuels (IEA 2002). The FAO expects a 25% increase in wood consumption and a doubling of charcoal consumption in Africa over the next three decades (Broadhead et al. 2001).
(d) Spiritual, aesthetic and recreational services
The SAfMA studies revealed that the less-tangible ecosystem services (spiritual, aesthetic and recreational) are nevertheless highly valued, by all populations, and at all scales. The cultural capital of a local group, i.e. the ‘means and adaptations to deal with its local environment’ (Berkes & Folke 2002), have co-evolved over centuries of interaction with the natural environment through learning, innovation and experimenting. Local people attach high values to these cultural and spiritual species. Communities in the Kat River valley, South Africa, for example, ranked ‘cultural species’ as the second most important ecosystem service, after ‘water’ and before fuel-wood, livestock, medicinal plants, building materials and wild food (Shackleton et al. 2004). Examples of management practices based on this cultural capital include sacred groves, which protect certain species and habitats, while at the same time playing a role in managing disturbance and creating buffers against unexpected events by creating refuge for species that can recolonize heavily disturbed landscapes. Sacred areas are a good example of cultures responding to feedback: people respond to the feedbacks of resource scarcity by completely restricting access to certain resources to allow the ecosystem to recover, identical to formal conservation strategies advocated by ecologists. Sacred pools, for example, contain more species, with different functional attributes, than stretches of river that are not sacred (Shackleton et al. 2004). A second ecological function of sacred pools is to conserve water, but the main reason for conserving them is because they are believed to provide shelter for ancestral spirits and spirit mediums (Biggs et al. 2004).
At the regional scale, nature-based tourism (by both southern African residents and foreigners, but largely by urban-dwellers) contributes 9% of the South African Development Community-country economies overall, and is growing several times faster than the traditional ecosystem-based extractive sectors, such as forestry, agriculture and fisheries (Krug et al. 2002; Scholes & Biggs 2004). The implication is that traditional power-relations with respect to natural resource policy are likely to shift in the future, with much more influence accruing to the ‘conservation’ lobby. Much of this tourism focuses on protected areas, and our projections suggest that the area of protected destinations may limit the future growth of this sector before the tourist demand is satisfied (Scholes & Biggs 2004).
(i) Trends in spiritual, aesthetic and recreational services
Our ability to adequately measure trends in these services is still poorly developed. However, some categories of services, such as nature-based tourism, are now becoming quantifiable. Tourism arrivals and revenues in countries from southern Africa have been growing more rapidly (5–15% per annum) than the slower growth rates recorded in other natural resource sectors (1–3% per annum) over the 1990s and appear to be limited by infrastructure rather than demand. This positive prognosis is expected to continue at least to 2025 under a number of socio-economic scenarios (Scholes & Biggs 2004).
(e) Biodiversity: a necessary precondition for ecosystem service delivery
Biodiversity, the variety of life on Earth (Noss 1990), is in some instances considered an ecosystem service, and in other instances a driver (i.e. a necessary condition for ecosystems to function). While the delivery of all ecosystem services requires, to some degree, the presence of living organisms to be delivered, in some cases it is not the variety of the living organisms that matters, but that only a few particular organisms are present (MA 2003). Most human food and fibre comes from a rather small and homogenous group of crop plants, and biodiversity is arguably not necessary in supporting the quantity of these services. Many people would counter that the reliability of these services is indeed dependent on biodiversity since a more diverse range of food plants, grown in a more diverse environment, is less likely to fail to produce food in the event of a drought or an outbreak of pests (Miller et al. 1995). Thus, in this instance biodiversity is a regulating service. In the area of enriching services, nature-based tourism (which is an important source of income in southern Africa) depends directly on the spectacular diversity of life on display. In this case, biodiversity is considered a cultural service owing to its recreational, aesthetic or even spiritual value.
Deciding on the best land-use practices in region (Biggs & Scholes 2002) to maintain ecosystem services frequently requires complex trade-off decisions. This tension is illustrated with reference to biodiversity resources in southern Africa. Southern Africa has an impressive wealth of biodiversity; this is particularly so for plant species where 10% of the world's plants occur in 1% of the world's area. Although there is less information on animal biodiversity, this biodiversity wealth is also reflected in the vertebrate and invertebrate taxa. Several biodiversity hotspots (Ribbink et al. 1983; Van Wyk 1994; Myers et al. 2000), containing high numbers of endemic species facing large threats, also fall within the region, including the Cape floral kingdom (Fynbos), the Succulent Karoo, the Pondoland-Inhabane and the Great Lakes (for fishes).
The MA considers biodiversity to be not only an ecosystem service in its own right but also the basis for other important services including nature-based tourism, rural diets and traditional medicines. Biodiversity also underlies supporting and regulating services such as nutrient cycling and carbon sequestration.
One conventional measure of biodiversity condition is the number of extinct species in southern Africa: 41 plant and 12 animal species have become extinct during the past two centuries (Golding 2002; IUCN 2002). This measure is, however, not very useful owing to the difficulty of documenting extinctions and its limited value as a management indicator—once an extinction has been recorded, it is too late to intervene (see Balmford et al. 2003). A more useful indicator, which can be used to indicate relative threats within different regions as well as providing an early warning system, is the number of threatened species. For example, the Gariep basin assessment highlighted 112, 102 and 73 (table 5) threatened species in the grassland, savannah and Nama karoo biomes of the basin, respectively.
Table 5.
Biodiversity status in the three major Gariep basin biomes.
| biome | area (km2) | species richnessa | endemic spp.b | endangered spp.c | protected aread (%) | transformed areae (%) |
|---|---|---|---|---|---|---|
| Grasslands | 215 508 | 1377 | 144 | 112 | 2.7 | 28.8 |
| Savannah | 190 646 | 1424 | 106 | 102 | 10.6 | 6.7 |
| Nama Karoo | 237 147 | 979 | 99 | 73 | 1.3 | 1.5 |
Species data for birds, butterflies, mammals, reptiles and scarabs from SA-ISIS (http://spatial.csir.co.za/website/).
Endemic to South Africa.
Endangered if listed in the Red Data Books for birds and mammals. Other taxa assessed by expert opinion.
Based on data from Department of water Affairs and Forestry (DWAF), Pretoria, South Africa.
Based on National Land-Cover Database (Thompson 1996).
Other groups of species often used to assess biodiversity include endemic species, i.e. species restricted to a particular region (table 5). This is a useful measure of how valuable or unique a region's biodiversity is. Another conventional measure of biodiversity status is protected area coverage, which shows that 15% of the land area in southern Africa is classified as formally protected or under sustainable use; the region therefore well exceeds the international guideline of 10% coverage. It is important however to understand the spread of protected areas across biome types. For example, while 16% of the Gariep basin is protected, most of this area lies within the savannah biome (table 5). It is unlikely that protected areas in the region will expand much further owing to conflicting land uses.
However, most of these indicators are not ideal as indicators of biodiversity condition and loss. The SAfMA regional team developed a measure which addresses some of the shortcomings of the above indicators, called the Biodiversity Intactness Index (BII; Scholes & Biggs 2004) that estimates the average fraction of original population sizes of plant and vertebrate groups remaining in major biomes in southern Africa. Based on the BII, approximately 84% of the pre-colonial number of wild organisms are estimated to persist in southern Africa, despite greatly increased human demands on ecosystems that have occurred over the past 300 years (Scholes & Biggs 2004). In contrast, over 99% of the species persist, illustrating the insensitivity of species extinction indices. The impact of humans on biodiversity is expressed very selectively. The small number of mammal, bird and reptile species that are large-bodied, and thus easy to hunt or harvest, are most highly impacted. This is especially so if (as in the case of large predators or very large herbivores) they are either valuable or in direct conflict with aspects of human well-being. However, the vast majority of species are instead affected mainly through loss of habitat to cultivated lands or urban areas, both of which are relatively small fractions of the landscape in southern Africa. The greatest impact on biodiversity in southern Africa has occurred in the grassland biome, followed closely by the fynbos biome. In both cases, the major cause is conversion to cultivated land, followed by urban sprawl and plantation forestry (figure 4), while the degradation of rangelands predominates in the more arid regions of southern Africa.
Figure 4.
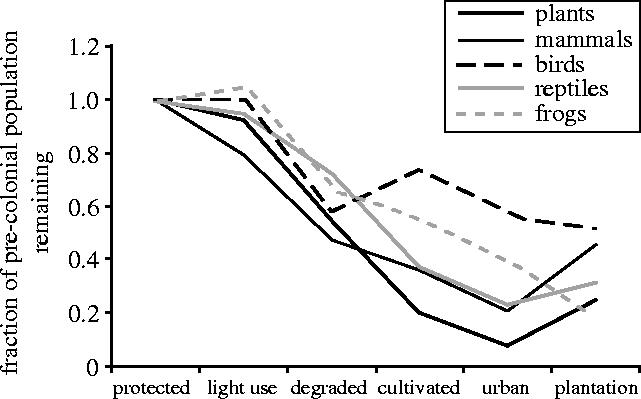
The effect of increasing land use intensity on the fraction of the inferred original population (300 years ago: pre-colonial) of different taxa that remains. The x-axis percentages refer to the percentage of southern Africa under the respective land uses (see Scholes & Biggs 2004). Human landscape modifications can also lead to increases of populations under conditions of light use (see amphibians).
At a local scale, species richness is not a useful biodiversity indicator because certain species increase under degraded conditions (Fabricius et al. 2003). Changes in the abundance of the less resilient species that tend to decrease under heavy disturbance such as over-grazing are much easier and more useful to monitor. In the Great Fish River area, the declining species were frugivorous birds, bird-dispersed trees and shrubs, and phytophagous insects such as weevils (Fabricius et al. 2003). There were more bird species in the degraded communal area than in protected areas. Frugivorous birds were, however, more diverse and abundant in the protected areas, whereas insectivorous and granivorous birds were more abundant and diverse on communal land (table 6; Hagen & Fabricius 2003). In the Richtersveld National Park, on the other hand, the declining plants were habitat-specific succulents with narrower temperature tolerance ranges than the other, more dominant succulents (Shackleton et al. 2003).
Table 6.
Comparison between a protected and communal area for generalist, insectivorous, frugivorous and granivorous birds in the Great Fish River area, South Africa (Fabricius et al. 2003). (Mean values and standard deviations are generated from comparisons across n sampling sites. NS indicates a non-significant difference as determined using a Mann–Whitney test.)
| protected (n=35) | communal (n=35) | significance | ||||
|---|---|---|---|---|---|---|
| mean | s.d. | mean | s.d. | |||
| generalists | abundance | 1.51 | ±3.27 | 0.83 | ±1.82 | NS |
| spp. richness | 0.57 | ±0.74 | 0.34 | ±0.54 | NS | |
| frugivorous | abundance | 3.69 | ±4.63 | 3.11 | ±4.09 | NS |
| spp. richness | 1.66 | ±1.47 | 1.11 | ±1.16 | p<0.1 | |
| insectivorous | abundance | 5.43 | ±4.58 | 7.74 | ±5.37 | p<0.05 |
| spp. richness | 2.94 | ±1.71 | 3.14 | ±1.46 | NS | |
| granivorous | abundance | 1.34 | ±2.13 | 1.86 | ±2.63 | NS |
| spp. richness | 0.74 | ±0.78 | 0.77 | ±0.84 | NS | |
(i) Trends in biodiversity services
While some 84% of the original numbers of wild organisms still persist in the region (BII), more than 99% of the species that were present 300 years ago are still present in southern Africa today. This BII value does vary substantially across biomes from the region, ranging from 74% (grasslands) to 91% (wetlands). As a primary driver of biodiversity losses, estimates of land-cover change also vary substantially and are highly dependent on ecosystem classification systems employed. Nevertheless, the FAO suggests that cultivated land in the region increased by 0.6% per annum during the 1990s (Scholes & Biggs 2004). Trend data for other drivers of biodiversity loss such as invasive species and degradation are not yet available, but response patterns, in the form of expanding protected area networks, are well documented. For example, the protected area network in South Africa expanded from 5 to 14% of land area between 1980 and 2003, primarily owing to private-sector driven wildlife and nature-based tourism initiatives (Scholes & Biggs 2004).
4. Approaches for assessing ecosystem services and biodiversity at multiple scales
The quantification, measurement and monitoring of ecosystem services, particularly for the purpose of biodiversity assessments, is a reasonably novel enterprise. The MA is making significant progress in quantifying ecosystem services at the global scale and across scales. However, many innovative approaches for measuring ecosystem services emerged from the sub-global assessments of the MA. Here, we present some important illustrative developments from SAfMA.
(a) Supply and demand surfaces
The SAfMA sub-global assessment demonstrated the value of using supply and demand surfaces across scales. This approach has significant value in quantifying areas of concern for ecosystem service provision and its relationship with human well-being. This is especially useful when a large area needs to be assessed. For example, freshwater supply and demand ratios for southern Africa (figure 5a) and the Gariep region (figure 5b) were calculated. Note the discrepancy in the assessment of water supply and demand differences between the modelled regional dataset, which outlines a more positive prognosis, and the Gariep assessment that was based on national hydrological data for the basin. The latter reveals a more pronounced difference between water supply and demand, which is compensated for in the Gariep by an intensive system of impoundments and diversions. Another figure of modelled regional water supply and demand differences for the driest month across southern Africa is provided in figure 5c. This pattern is marginally more similar to the finer scale Gariep basin-level assessment data (figure 5b), but significant discrepancies remain. These data emphasize how scale-dependent assessments are, that broad scale assessment results may differ from fine scale realities for a variety of reasons (data disparities or local adaptations), and that human livelihoods and ecosystem functioning can be constrained by ecosystem ‘bottlenecks’ rather than average service levels (Biggs et al. 2004). Supply–demand surfaces are particularly useful for identifying areas where supply–demand tensions exist across landscapes.
Figure 5.
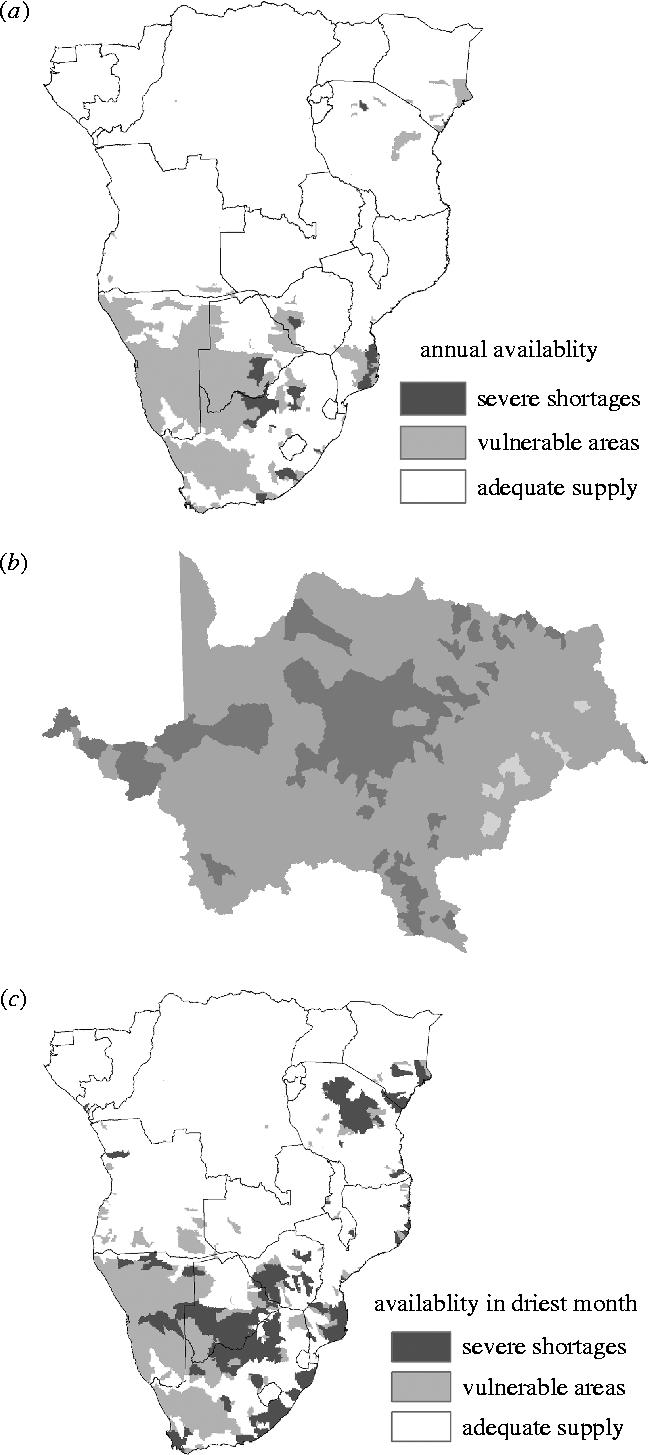
Role of scale in the assessments of water supply and demand differences in Africa (a) regional scale, (b) Gariep basin scale and (c) regional scale in the driest month of the year (m3/ person/year). Water is unevenly distributed in the southern African region, and this ‘lumpiness’ is apparent at multiple scales. When one zooms in on an area that appears uniform at the regional scale, localized areas of excess and deficit appear. Assessments at more detailed scales, such as the Gariep basin assessment, tend to use localized datasets (e.g. national statistics), and often give results that differ significantly from those derived from larger scale studies that use global or continental datasets (Biggs et al. 2004).
(b) Ecosystem service ‘sources’ and ‘sinks’
Ecosystem services are not always produced or available in the same area where they are used. Arid regions that receive little precipitation are a case in point, as these rely on storage or transfers of surface water or groundwater resources. This trend is also typical of urban areas that generally use services that are produced elsewhere (and which therefore have a large ecological footprint). For example, Gauteng Province, which includes South Africa's major urban-industrial complex and which contains the cities of Johannesburg and Pretoria, has an urbanization rate of 94% and a population density of 375 people per km2. This region provides only 0.3% of South Africa's total agricultural income and profit but is a major agricultural market (see figure 6). An analysis was conducted of the food volumes produced and consumed in Gauteng Province compared with South Africa as a whole. For most food types, Gauteng's annual production is well below 4% of the national production, while it comprises between 17 and 20% of the national consumption (Bohensky et al. 2004). The example of the Gauteng complex illustrates the dependence of the people that live there on ecosystem services imported from the surrounding landscape. Such transfers of ecosystem services can effectively decouple local populations and the land stewardship that is usually associated with the provision of services to these populations, resulting in ecosystem degradation and declines in regulating services. Identifying regions that are crucial for the continued provision of ecosystem services is an important component of any ecosystem service assessment, especially as their ability to continue producing services is typically spatially variable.
Figure 6.

(a) The important crop production areas of the Gariep basin in South Africa expressed in terms of the recommended daily allowance (RDA) of cereal consumption (220 kg/person/yr) and the location of Gauteng urban industrial complex. (b) The ratio between food consumption and production in the Gauteng Province of South Africa, where only intensive chicken production marginally outstrips the local demand (Bohensky et al. 2004).
(c) Target-driven priority areas for the maintenance of ecosystem services
When ecosystem services are produced and supplied in a spatially variable fashion it is important to identify those areas that contribute disproportionately to service provision, or are important for achieving threshold or target levels of service provision. These areas need to be prioritized and managed accordingly. One approach that is successfully used to prioritize biodiversity planning regions is the notion of irreplaceability (Pressey 1998). Irreplaceability scores essentially define the contributions specific areas make towards achieving specified regional biodiversity conservation targets. In the Gariep basin of South Africa, Bohensky et al. (2004) used the notion of irreplaceability to assign importance values to areas across the landscape for achieving specified ecosystem service target levels (figure 7). For example, food and water provisioning targets were determined by multiplying basin cereal (calories produced) and livestock (protein) production figures (mean runoff) with the United States Recommended Daily Allowances of calories and protein with the number of people dependent on that ecosystem service across the basin. The contribution of each site in the basin towards this target value was determined by measuring the number of calories and grams of protein produced in that area through cultivation and livestock farming. Irreplaceable or important sites are those sites whose contributions are vital to achieve the specified regional ecosystem service target levels (Bohensky et al. 2004) using a minimum of land. This process would selectively target the most productive areas first in order to minimize the required land allocation. Using this analysis for several ecosystem services across the Gariep basin emphasized the spatial congruence of areas important for food production and biodiversity conservation in the Gariep Basin and emphasizes the importance of making vital land-use trade-off decisions to secure multiple ecosystem services in some areas. The Gariep analysis demonstrates that using all arable land for food production would significantly compromise the ability to achieve biodiversity conservation targets in the region and vice versa. Such assessments are essentially supply-side assessments of areas important for service delivery, and do not incorporate demands. Moreover, offsets achieved through food or resource imports are not accounted for in this irreplaceability model as it focuses exclusively on area specific and internal service supplies.
Figure 7.

Irreplaceability maps for the Gariep basin based on (a) recommended daily allowance targets for proteins: 60 kg/person/year×population size, (b) recommended daily allowance targets for cereal consumption: 220 kg/person/year×population size and (c) combined mammal and bird species (one representation each) and vegetation targets (10% of each vegetation type). The algorithm selected the minimum area required to achieve the respective targets and would therefore initially select high productivity areas. Irreplaceability values range from 0 (very low importance for achieving target and many options for substituting cells with other cells to achieve target) to 1 (totally irreplaceable: if this cell were not included in the provision of services, the goals for those services could not be met; Bohensky et al. 2004).
(d) Ecosystem service ‘hotspots’
Ecosystem service ‘hotspots’ incorporate both supply-side and demand-side components. These are areas where there is an apparent tension between ecosystem service delivery and human needs and aspirations, or where ecosystem supply falls short of demand or is periodically vulnerable to excessive demands. Such ecosystem service hotspots were identified for various regions in the Gariep basin of South Africa (figure 8). The eastern and northeastern regions of the basin, for example, have high irreplaceability values for the provision of food (figure 7a,b). This also largely coincides with regions of high biodiversity value (figure 7c), and with areas with a highly skewed income pattern (figure 8c). These regions of socio-ecological tension must therefore be subjected to careful planning in order to maximize ecosystem services (figure 8) without compromising ecosystem integrity. The high levels of agriculture and urbanization are well known concerns in the basin and have already impacted the ecological integrity of this region (Fairbanks et al. 2000; Reyers et al. 2001), with most of the indigenous grasslands of the region under severe threat.
Figure 8.

Ecosystem service and human well-being ‘hotspots’ in the Gariep basin are areas where service provision or human well-being may be of concern. These ‘hotspots’ incorporate supply-side and demand-side considerations. Shaded areas indicate areas (from top to bottom) (a) where surface water requirements are 60% or more of availability (m3/person/year) per quaternary catchment, (b) where electricity is supplied by a local authority to 25% or fewer of households per municipal district (Lesotho=national figures) and (c) of high income inequality per municipal district (Gini index above 0.85; Bohensky et al. 2004). The Gini index quantifies the relationship between the income generated by different proportions of the human population. A value of 0 would indicate an equal income distribution and a value of 1, a highly skewed income distribution with few people procuring most of the income.
In addition, the arid western region of the basin could be a potential area of conflict (figure 8). This is important to highlight as it is not an area that receives a lot of attention in land use and biodiversity planning initiatives (with the exception of the Succulent Karoo, a global biodiversity hotspot). This area is a source of mineral wealth and contains several irreplaceable biodiversity sites owing to the concentration of endemic species. However, it is also vulnerable to water scarcity, surface and groundwater quality problems, and desertification, all of which are predicted to be amplified by climate change. The region is further hampered by its low level of development, exemplified by the low percentage of households connected to the electricity grid (figure 8b). This means that people from this region must obtain energy from other sources such as biofuels. Although the low human densities make this arid region less vulnerable to excessive development, the coincidence of the above features suggest that, if this area is not sensitively managed, the implications for biodiversity, ecosystem services and human well-being could be severe (Bohensky et al. 2004). These are areas where trade-off analyses may be of particular importance to decision makers.
(e) Assessing trade-offs
Making the necessary trade-off decisions between (i) the provision of different types of ecosystem services; (ii) current and future benefits to society; (iii) societal needs and ecosystem requirements and (iv) placing emphasis on providing access to services in one region over another, are some of the difficult decisions that frequently need to be made when managing ecosystem services (Biggs et al. 2004). These decisions are further complicated as they invariably revolve around a trade-off between different value systems, needs and desires among communities. In the Gauteng Province of South Africa, some communities may cherish the job opportunities created by air-polluting industries in the area. Others may be more concerned about the escalating medical costs associated with air pollution, while still others may remain largely ignorant of its consequences for respiratory disease and infant mortality patterns. Developing appropriate and sensitive responses to such challenges lies at the heart of managing ecosystem services for humankind and nature alike.
Ecosystem trade-off decisions are also scale sensitive. Congruence between different ecosystem services, particularly between provisioning and regulating services, is often assessed at a field or plot scale, the general interpretation being that when you harvest an area for food, fuel, or fibre you lose the other services. In fact, many ecosystem services, particularly the regulating services, only manifest themselves at a landscape scale. While some parts of the landscape may provide food or fuel other ecosystem services, such as hydrology, pollination or pest control, may remain more or less intact. The issues then become: what features of the landscape are needed to maintain those regulating services (biodiversity, water filtration)? What percentage of the landscape must contain those features, and how must they be distributed across the landscape? Such questions pertain to the conversion of natural systems but also to the design and diversification of human dominated landscapes. These types of questions are relevant to integrated pest management (Landis et al. 2000; Thies et al. 2003), pollination ecology, soil erosion control and water quality management among others.
A fundamental requirement for conducting sensible trade-off assessments and developing appropriate policy responses is to balance human needs and aspirations with the maintenance of ecosystem services. This process is not mechanical and is highly value laden. The most appropriate way to achieve this balance is to secure an appropriate social contract with civil society. This is feasible in southern Africa as illustrated in §5 below.
(f) Incorporating and validating informal local knowledge
A wide range of participatory research techniques was used to collect and integrate local knowledge into the assessment process (Babbie et al. 2001). Among the techniques used to collect local knowledge were focus group workshops and interviews (Borrini-Feyerabend 1997), semi-structured interviews with key informants (Pretty et al. 1995), a range of Participatory Rural Appraisal techniques (Chambers 1994; Borrini-Feyerabend 1997) and forum theatre. The resulting data were supplemented with free-hand mapping by community members and incorporated into Geographic Information Systems. The need to integrate this information into the assessment findings proved to be a bigger challenge than merely collecting it. This was overcome by combining informal knowledge with formal knowledge and technology. Field data were combined with digitally enhanced charts, graphs and reports by the specific researchers involved. In this way, tacit knowledge was made accessible to other scientists. To prevent an extractive process with a one-way transfer of knowledge (i.e. solely from local people to scientists), scientific knowledge was equally translated into a form that local participants could relate to. Storylines and drama, for example, were used to translate complex issues such as scenarios to local participants who were often illiterate. Reactions were then recorded on video and delivered to scientists working at coarser spatial scales.
Combining formal and local knowledge can lead to a great deal of uncertainty. Validation is therefore essential. This can be achieved through the cross-validation of both formal and informal knowledge with local experts validating scientific knowledge, and scientists validating informal knowledge. ‘Triangulation’ through comparing different sources of knowledge (e.g. maps, transect walks and semi-structured interviews) was another approach used to assess the validity of datasets. Report-back meetings, where participants relayed their findings to other local people in an open forum, were used to further validate information. The integrity of local knowledge can never be guaranteed, but using the various techniques in a complementary way greatly enhanced the credibility of informal knowledge.
5. Policy interventions to secure ecosystem services and human well-being
The policy challenges that emanate from ecosystem service management issues are particularly challenging and require innovative responses and approaches. Examples of emerging progressive policies aimed at securing national ecosystem services and human well-being include the South African Water Act of 1998 and the Working for Water programme.
The Water Act of 1998 is founded on the principles of equity, sustainability and efficiency (as reflected in the national water department's slogan of ‘some, for all, forever’). Created out of an urgent need in the new democracy to redress the results of past discrimination in the country as well as provide for future generations, the law promotes equity by defining access to water as a basic human right and guaranteeing provision of 25 l of safe water within 200 m of the home to all South Africans, sustainability by protecting aquatic ecosystems through ecological reserve requirements and resource protection measures and efficiency through water allocation and pricing strategies (DWAF 1998; Eberhardtt & Pegram 2000; Mackay 2003). As a social contract, the Act allowed South African water authorities to define an ecological reserve (the quantity, pattern and assurance of water required to remain in a natural body of water in order to ensure its ecological functioning) for each catchment across the country by weighing the trade-offs between human needs and aspirations and ecological integrity (Bohensky et al. 2004).
Alien invasive plants are a significant problem in South Africa, with particularly negative impacts on water: they reduce total stream-flow by approximately 7% (Versveld et al. 1998), consuming an amount of water on par with that used by the urban and industrial sectors in major urban areas (Basson et al. 1997). The Working for Water programme in South Africa is an integrated multi-agency intervention to address the alien plant problem. By hiring previously unemployed individuals to clear and eradicate invasive alien plants, Working for Water addresses the multiple objectives of ecosystem rehabilitation, water conservation and poverty relief through job creation, as well as environmental education and awareness-raising about alien plants and water conservation across sectors of society. It is also encouraging the development of secondary industries to generate additional income and employment through the creation and marketing of products made from the cleared alien species (e.g. handcrafts, charcoal production). As such, this socio-economic work-programme is enhancing sustainable ecosystem service provision.
6. Perspectives on measuring and modelling ecosystem services
The approaches outlined above place strong emphasis on the measurement of ecosystem processes and services. As indicated, our ability to measure and quantify trends in ecosystems services is still a developing enterprise that is at different stages of development and understanding. Although this is an important aspect of ecosystem assessment and one that should be encouraged and further developed, it is not sufficient. Considering the present state of knowledge about biodiversity resources, especially the nature of our gaps in understanding (Royal Society 2003), some drastic measures are required. The overwhelming emphasis of biodiversity science on the observation of biodiversity patterns and trends probably stems from the roots of the discipline in natural history and the systematic recording of distributions, taxonomy and abundances of species. Considering the challenges faced by biodiversity science as a discipline (Royal Society 2003), there is an urgent need to elevate the discipline to a higher tier. The five key uncertainties faced by the discipline include (i) the documentation of unknown species; (ii) the likely distributions of known and unknown species; (iii) the degree of investment required to establish the systematic and bio-survey capacities; (iv) integrating the compositional, structural and functional components of biodiversity into assessments (Noss 1990) and (v) the long time lags between ecosystem interventions and ecosystem responses. Coupled with the urgency with which these hurdles have to be overcome to make a meaningful contribution to biodiversity conservation, it suggests that placing our entire emphasis on the observation and measurement of biodiversity patterns and processes is unlikely to be sufficient or convincing to civil society and policy makers.
The science of biodiversity has developed to a point where it must now be feasible to start modelling biodiversity patterns and processes from first principles, and to gain an understanding of global biodiversity resources based on our best available information of macro-ecological patterns and processes. This fundamental understanding can then subsequently be combined with important drivers of biodiversity change and used to explore alternative futures. This modelling approach should be considered as a second string in the bow of biodiversity scientists. Combining observation and exploratory modelling approaches should help move the discipline forward in an iterative fashion and more, importantly, provide relevant answers more rapidly.
Acknowledgments
Funding for this work came via UNEP and through the MA from the government of Norway, with in-kind contributions from various agencies (governmental, non-governmental, private donors and academic institutions). Partnerships were formed with a range of different agencies in southern Africa and this facilitated the exchange of data, information and expertise. Institutional contributions also came from the National Research Foundation the CSIR and Stellenbosch University.
Footnotes
One contribution of 19 to a Discussion Meeting Issue ‘Beyond extinction rates: monitoring wild nature for the 2010 target’.
References
- Arnold M, Köhlin G, Persson R, Shepherd G. Centre for International Forestry Research; Jakarta, Indonesia: 2003. Fuelwood revisited: what has changed in the last decade? [Google Scholar]
- Babbie E, Mouton J, Vorster P, Prozesky . Oxford University Press; Oxford: 2001. The practice of social research. [Google Scholar]
- Balmford A, Green R.E, Jenkins M. Measuring the changing state of nature. Trends Ecol. Evol. 2003;18:326–330. [Google Scholar]
- Barnett R, editor. Food for thought: the utilization of wild meat in Eastern and Southern Africa. TRAFFIC East and Southern Africa; Nairobi: 2000. [Google Scholar]
- Basson M.S, van Niekerk P.H, van Rooyen J.A. DWAF report P RSA/00/0197. Department of Water Affairs and Forestry; Pretoria, South Africa: 1997. Overview of water resources and utilization in South Africa. [Google Scholar]
- Berkes F, Folke C. Back to the future: ecosystem dynamics and local knowledge. In: Gunderson L, Holling C.S, editors. Panarchy: understanding transformations in human and natural systems. Island Press; Washington, DC: 2002. pp. 121–146. [Google Scholar]
- Biggs R, Scholes R.J. Land-cover changes in South Africa 1911–1993. S. Afr. J. Sci. 2002;98:420–424. [Google Scholar]
- Biggs R, et al. CSIR; Pretoria, South Africa: 2004. Nature supporting people: The Southern African Millennium Ecosystem Assessment. p. 65. [Google Scholar]
- Bohensky E, et al. Millennium Ecosystem Assessment. Stellenbosch University; Stellenbosch, South Africa: 2004. Ecosystem services in the Gariep basin: a component of the Southern African Millennium Ecosystem Assessment (SAfMA) p. 140. [Google Scholar]
- Borrini-Feyerabend G. IUCN, Kasparek Verlag; Gland, Switzerland: 1997. Beyond fences: seeking social sustainability in conservation. [Google Scholar]
- Broadhead J, Bahdon J, Whiteman A. Food and Agricultural Organisation of the United Nations; Rome, Italy: 2001. Woodfuel consumption modelling and results. [Google Scholar]
- Chambers R. Participatory Rural Appraisal (PRA): analysis and experience. World Dev. 1994;22:1253–1268. [Google Scholar]
- De Klerk H. Unpublished SAfMA report. Rhodes University; Grahamstown: 2003. Food consumption patterns of shepherds in Richtersveld National Park. [Google Scholar]
- DEAT. Department of Environmental Affairs and Tourism; Pretoria, South Africa: 2000. National state of the environment report. [Google Scholar]
- Department of Water Affairs and Forestry (DWAF) DWAF; Pretoria: 1998. The National Water Act, No. 36 of 1998. [Google Scholar]
- Eberhardtt R, Pegram G. Development Bank of South Africa; Midrand, South Africa: 2000. The water sector: a position paper. Macroeconomics and sustainable development in Southern Africa. [Google Scholar]
- Eckholm E. Worldwatch Institute; Washington, DC: 1975. The other energy crisis: firewood. [Google Scholar]
- Fabricius C, Burger M, Hockey P.A.R. Comparing biodiversity between protected areas and adjacent rangeland in xeric succulent thicket, South Africa: arthropods and reptiles. J. Appl. Ecol. 2003;40:392–403. [Google Scholar]
- Fairbanks D.H.K, Thomson M.W, Vink D.E, Newby T.S, van den Berg H.M, Everard D.A. The South African land-cover characteristics database: a synopsis of the landscape. S. Afr. J. Sci. 2000;96:69–82. [Google Scholar]
- FAO. Food and Agricultural Organisation of the United Nations; Rome, Italy: 1983. Fuelwood supplies in the developing countries. [Google Scholar]
- FAO. Food and Agricultural Organisation of the United Nations; Rome, Italy: 2002. The state of food security in the world. [Google Scholar]
- FAO. FAO Fisheries Technical Paper 435. 2003. Trends in oceanic captures and clustering of large marine ecosystems. Two studies based on the FAO capture database. [Google Scholar]
- Golding J.S, editor. Southern African plant red data lists. SABONET Report Series No. 14. SABONET; Pretoria, South Africa: 2002. [Google Scholar]
- Hagen B, Fabricius C. Unpublished manuscript. Rhodes University; Grahamstown: 2003. Birds as biodiversity indicators for comparing communal and protected areas in the Great Fish River, South Africa. [Google Scholar]
- Heywood, et al. UNEP/Cambridge University Press; Cambridge, UK: 1995. Global biodiversity assessment. [Google Scholar]
- IEA. World Energy Outlook 2002. IEA; Paris, France: 2002. Energy and poverty. [Google Scholar]
- IUCN. World Conservation Union; Gland, Switzerland: 2002. 2002 IUCN Red List of threatened species. [Google Scholar]
- Krug W, Suich H, Haimbodi N. Park pricing and economic efficiency in Namibia. DEA Res. Discuss. Pap. 2002;45:4–31. [Google Scholar]
- Landis D, Wratten S.D, Gurr G. Habitat manipulation to conserve natural enemies of arthropod pest in agriculture. Annu. Rev. Entomol. 2000;45:173–199. doi: 10.1146/annurev.ento.45.1.175. [DOI] [PubMed] [Google Scholar]
- MA. Millennium ecosystem assessment. Island Press; Washington, DC: 2003. Ecosystems and human well-being: a framework for assessment. [Google Scholar]
- Mackay H. Water policies and practises. In: Reed D, de Wit M, editors. Towards a just South Africa: the political economy of natural resource wealth. WWF Macroeconomics Programme Office/CSIR; Washington, DC/Pretoria: 2003. pp. 49–83. [Google Scholar]
- Miller K, Allegretti M.H, Johnson N, Jonsson B. Measures for conservation of biodiversity and sustainable use of its components. In: Heywood V.H, editor. Global biodiversity assessment. Cambridge University Press; Cambridge: 1995. pp. 915–1061. [Google Scholar]
- Myers N, Mittermeier R.A, Mittermeier C.G, da Fonseca G.A.B, Kent J. Biodiversity hotspots for conservation priorities. Nature. 2000;403:853–858. doi: 10.1038/35002501. [DOI] [PubMed] [Google Scholar]
- Noss R.F. Indicators for monitoring biodiversity: a hierarchical approach. Conserv. Biol. 1990;4:355–364. [Google Scholar]
- Pimm S.L. McGraw-Hill; New York: 2001. The world according to Pimm: a scientist audits the earth. [Google Scholar]
- Pressey R.L. Application of irreplaceability analysis to planning and management problems. Parks. 1998;9:42–51. [Google Scholar]
- Pretty J, Guijt I, Scoones I, Thompson J. Sustainable Agriculture Programme. IIED participatory methodology series. International Institute for Environment and Development; London: 1995. A trainer's guide for participatory learning and action. [Google Scholar]
- Reyers B, Fairbanks D.H.K, van Jaarsveld A.S, Thomson M. Priority areas for conserving South African vegetation: a coarse filter approach. Divers. Distrib. 2001;7:77–96. [Google Scholar]
- Ribbink A.J, Marsh B.A, Marsh A.C, Ribbink A.C, Sharp B.J. A preliminary survey of the cichlid fishes of rocky habitats in Lake Malawi. S. Afr. J. Zool. 1983;18:149–310. [Google Scholar]
- Royal Society. Policy document 11/03. The Royal Society; London: 2003. Measuring biodiversity for conservation. p. 56. [Google Scholar]
- Scholes R.J, Biggs R, editors. Ecosystem services in southern Africa: a regional assessment. Council for Scientific and Industrial Research; Pretoria, South Africa: 2004. [Google Scholar]
- Shackleton C.M, Guthrie G, Keriungi J, Stewart J. Fuelwood availability and selection in the Richtersveld National Park, South Africa. Koedoe. 2003;46:1–8. [Google Scholar]
- Shackleton C, Fabricius C, et al. Rhodes University; Grahamstown, South Africa: 2004. Southern African Millennium Assessment: Gariep basin local scale assessments. [Google Scholar]
- Thies C, Steffan-Dewenter I, Tscharntke T. Effects of landscape context on herbivory and parasitism at different spatial scales. Oikos. 2003;101:18–25. [Google Scholar]
- Thompson M. A standard land-cover classification scheme for remote sensing applications in South Africa. S. Afr. J. Sci. 1996;92:34–42. [Google Scholar]
- Van Wyk A.E. Maputaland–Pondoland region. In: Davis S.D, Heywood V.H, Hamilton A.C, editors. Centres of plant diversity: a guide and strategy for their conservation. Oxford University Press; Oxford: 1994. pp. 227–235. [Google Scholar]
- Versveld D, Le Maitre D.C, Chapman R.A. Water Research Commission; Pretoria, South Africa: 1998. Alien invading plants and water resources in South Africa: a preliminary assessment. [Google Scholar]