

Abstract
Transcranial magnetic stimulation (TMS) is a technique whereby parts of the cerebral cortex and underlying white matter can be excited by a brief electrical current induced by a similarly brief, rapidly fluctuating magnetic field which is itself produced by rapidly discharging a current through an insulated coil held against the scalp. When combined with magnetic resonance structural and functional images of the subject's brain, the stimulation can be directed at specific cortical areas. Over a period of only 15 years, TMS has revealed hitherto unsuspected aspects of brain function, such as the role of distant parts of the brain in recovery from stroke, and has helped to resolve several previously intractable disputes, such as the neuronal basis of conscious awareness. This article describes and discusses the origins and nature of TMS, its applications and limitations, and its especial usefulness in conjunction with other techniques of evaluating or imaging brain activity.
Keywords: transcranial magnetic stimulation, visual cognition, visual awareness, localization of function
1. Introduction
Very few people have a Royal Society Prize lecture named after them: Faraday, Leeuwenhoek, Croone, Wilkins, Bernal, Medawar. It is a measure of the enormous standing of David Ferrier that following his death in 1928 The Royal Society promptly introduced a Prize lecture in his name and that it has been delivered triennially, and without interruption, ever since. Despite this echo of the past, there are now so many behavioural neuroscientists who know little or nothing about Ferrier that it is timely to recall why he was so distinguished and why he would have delighted in the development of transcranial magnetic stimulation (TMS) to study the brain. As the playwright Arthur Miller said recently (Sunday Times, 2 October 2004), ‘I'll probably be forgotten completely. Most of the work in the world is forgotten completely—99.99 per cent of all art work is forgotten’. David Ferrier is approaching this fate and it is a pleasure to attempt to delay it.
Ferrier was a Scotsman from Aberdeen where, in 1863, he graduated in classics and philosophy. He then went to Edinburgh to study medicine (he would probably not be admitted now with such irrelevant qualifications) and qualified in 1868. After several small jobs he migrated south and became assistant to a Suffolk GP called—delightfully in view of this article—Dr Image, who was broad-minded enough to give him spare time to study the anatomy of the superior colliculi. Ferrier submitted his findings as an MD thesis and obtained a gold medal. London beckoned, and in 1872, aged 29, he became, first, Professsor of Forensic Medicine, and then, in 1889, Professor of Neuropathology, both at King's College. He championed the idea that even busy hospital doctors should be encouraged to do basic research, a belief he shared with his friend Crichton-Browne, then Director of the West Riding Lunatic Asylum at Wakefield, who invited Ferrier to use his laboratory in the asylum. In that, nowadays, almost unbelievably unlikely setting, Ferrier carried out some of the most pioneering investigations of localization of brain function by stimulating the exposed brain of anaesthetized animals, including monkeys. At that time the prevailing view, much promoted by Pierre Flourens (1842) and by Friedrich Goltz (1888), was that there was no such localization and that the cortex acted as a whole. By stimulating different parts of what is now known as the motor cortex, and thereby producing discrete movements of different parts of the body, Ferrier (1873) swiftly provided incontrovertible evidence for functional localization and paved the way for intracranial surgery of a kind previously thought to be useless, especially for focal epilepsy. Ferrier did more than map the motor cortex. He noted that stimulation of parts of the parietal and temporal lobes caused animals to orient, apparently purposefully, to one part of space as if they had been touched or had heard something. He also described how an animal would sniff, as if exploring a smell. He conjectured that the stimulation was exciting sensory cortex concerned with touch, hearing or smell. And he was right. He also noted that stimulation of the prefrontal cortex produced no motor responses, and only intellectual dullness and inattentiveness if that cortex was removed. How he would have liked the present-day functional neuroimaging investigations of the role of prefrontal areas in attention and thought.
In his first paper presented before The Royal Society he made the, at that time, astonishing statement that ‘a scientific phrenology is regarded as possible’. As an additional bonus, his insistence on using the then novel sterile surgical techniques on animals produced so few problems with infections of wounds that they were rapidly and widely incorporated into human neurosurgical operating theatres. Ferrier was so sure that his findings applied to the human brain that he marked his functional areas on to the anatomically corresponding areas of the human cerebral cortex (figure 1) and this imaginative but controversial diagram was subsequently used as a guide in human neurosurgery.
Figure 1.

On the left is Ferrier's (1886) drawing of the lateral surface of the left hemisphere of a macaque monkey with 15 numbered areas where stimulation produced particular movements. On the right is his drawing of the human brain showing where the ‘same’ functional areas would be. He proved to be close to the mark with most of them.
As said by Charles Sherrington (1937), ‘to Ferrier…the origin of modern brain surgery is primarily due’. It is deeply ironic that his scientific and practical achievements were attacked by anti-vivisectionists in the 1880s and he was publicly pilloried and then sensationally prosecuted for his allegedly cruel experiments. The allegations were dismissed and Ferrier continued to carry out, defend and promote biomedical research on animals. A splendid and scholarly account of these events and Ferrier's life is provided by Taylor & Gross (2003).
Why was Ferrier so successful, given that a few years before him Fritsch & Hitzig (1870) had already shown that electrically stimulating parts of the cerebral cortex in dogs produced movement? The reason is simple, although now often overlooked. Fritsch & Hitzig used voltaic current, i.e. direct current. This polarizes nerve cells, easily damages them, and produces undifferentiated twitches. Ferrier used Faradic stimulation, i.e. alternating current, which mimics the natural intermittent excitation of nerve cells. It was a fortuitous but stunningly effective choice, thereafter used by all investigators and, although Ferrier could not have foreseen it, became the basis for TMS.
2. What is TMS?
The light-hearted answer is that it is a misnomer. It would be more accurately called transcranial magnetically induced electrical stimulation, or TMIES, but the misnomer is unlikely to be dislodged. TMS is the electrical current induced in the brain by a brief magnetic field that is itself created by discharging a current through the insulated stimulating coil held on the scalp. It stems from the discovery of Michael Faraday, in 1831 (but not fully described until 1839), that when an electric current is turned on or off in a (primary) coil of wire, another electric current is induced in a nearby (secondary) coil by the fluctuating magnetic field around the primary coil. With respect to TMS the secondary coil is the brain, although other tissue in the vicinity is also and sometimes inconveniently stimulated. It is the sudden change in current, and thence magnetic field, that is responsible for electrical induction. This is why the pulses are as brief as possible so that the change in magnetic gradient is steep. It also explains why we do not experience TMS when we lie still in a powerful magnetic field like that of a modern magnetic brain scanner. As the magnetic field is unchanging there is no induced current.
Although the induced current is both weak and brief, it can depolarize nerve cell membranes when the direction of the current is across the membrane. If the depolarization exceeds some level, the nerve cell will discharge and, as the propagated action potential greatly outlives the electrical pulse, the effect of one TMS pulse can last tens of milliseconds (see below). The effectiveness of the stimulation depends on the strength of the magnetic field produced by the stimulating coil (typically 1–2 T), the shape of the pulse (monophasic or biphasic), its rate of change, and the frequency of the pulses (often a single pulse but increasingly repetitive or rapid pulses and typically around 10 Hz). By altering the configuration of the TMS coil on the scalp, the direction of the induced electrical field can be changed, and this is particularly important when stimulating white matter tracts, for current flowing parallel to the tract and therefore not crossing the cell membrane has negligible effects. The effect of coil orientation can even be seen when stimulating cortical grey matter, where the excitable membranes are less ordered.
Transcranial magnetic stimulation works by a brief magnetic field that induces an electric field, which in turn causes ionic current flow, whereas electrical stimulation directly produces a flow of ions between the stimulating electrodes. Not surprisingly, electrical stimulation can be more precisely localized because there is no doubt about the position of the electrodes, whereas pinpointing the effective locus of action of TMS is far more difficult, as discussed below. However, TMS has major advantages in that indwelling electrodes are avoided and, with minor exceptions, the discomfort or pain produced by electrical stimulation from electrodes on the scalp is absent.
(a) Historical background
In theory, Ferrier could have used magnetically induced stimulating currents in human subjects rather than direct electrical stimulation of the exposed brain of anaesthetized animals because Faradic induction was well understood by the late nineteenth century. What prevented him? It was not lack of imagination but inadequate technology. It was impractical to store and swiftly discharge the necessary high currents with existing capacitors. However, it was possible to create less intense fluctuating magnetic fields by driving a sufficiently large coil with alternating current, and this was done by d'Arsonval (1896) while a volunteer placed his head inside a coil pulsed at 42 Hz. The subject experienced flashing lights (magnetophosphenes) and dizziness and the findings were confirmed several times, notably by Thompson (1910), who attributed the phosphenes to direct stimulation of the visual centres of the brain. Given the size and disposition of the stimulating coil and what we now know to be the sensitivity of the retina to induced current, it is probable that the early investigators had hold of the wrong end of the stick and were stimulating the eyes and not the visual cortex at the opposite end of the head. Lest we think that such mislocalization could no longer happen, it is worth noting that stimulation of visual cortex can also affect the eyes (see below).
It took a further 60 years or so before technical developments made it possible to make stimulating coils that were compact yet could produce a magnetic field of up to 2 T and a pulse with a rise time of about 100 μs and a total duration about 400 μs. With such a simple round coil, Barker et al. (1985) stimulated motor cortex and elicit hand movements. Shortly afterwards, investigators discovered that they could selectively stimulate visual, somatosensory and auditory cortex and produce illusory sensory perceptions. By applying TMS above other than classical sensory or motor cortex, they could alter the performance of subjects on a wide range of perceptual and cognitive abilities, such as visual search, visual neglect, motion perception and memory (for reviews see Amassian et al. 1993; Walsh & Cowey 1998; Walsh & Pascual-Leone 2003).
(b) The nuts and bolts of TMS: coils, currents, limitations and safety
A commercially available TMS machine (figure 2) operates by charging one or more capacitors, which takes a few seconds, then discharging the stored energy at a high voltage into the coil as a single pulse or as several pulses (rTMS). The simpler machines discharge the current through the coil to produce a monophasic magnetic field peaking at approximately 100 μs and decaying within 1.0 ms. The induced electric field is almost monophasic and is effectively over within 200 μs. In other words, everything that matters occurs within 1.0 ms (figure 2). A drawback of single pulse stimulators is that although their biophysical effects on neurons can last for tens of milliseconds, several seconds are needed before the next pulse can be delivered, yet for many purposes it is necessary to disable neurons for longer than a few tens of milliseconds when studying the effect of TMS on tasks that require perceptual display times of up to a second. Rapid pulse TMS, where pulses can be presented at a frequency of up to 30 Hz for durations of up to a second, require a variation of the circuit shown in figure 2. By omitting the resistor and positioning the diode across the thyristor, the magnetic field and the induced electrical field are biphasic (figure 2). This has the welcome advantage of restoring approximately half of the original stored energy to the capacitors, which can therefore be swiftly recharged. As importantly, the biphasic waveform of the induced electrical field is more effective physiologically, allowing lower currents to be used and further shortening the recharging time. It is therefore not surprising that most investigations of visual perception, which commonly require displays with multiple frames of a raster display, are carried out with rTMS.
Figure 2.

(a) Diagram of the circuit of a simple magnetic stimulator. (b) Outline of a simple round stimulating coil. The arrows indicate the direction of current flow in the coil. To its right is shown a schematic of the induced electric field in the tissue directly beneath the coil, which has been moved sideways for clarity. The arrows show the direction of flow of induced current, which is opposite to that in the stimulating coil. The length of the arrows crudely indicates the magnitude of the induced current, which declines towards the centre of the coil and away from its perimeter. (c) Schematic of the induced current in the brain beneath a figure-of-eight coil. The maximum current is in the vicinity of the ‘virtual cathode’, shown by the asterisk. (d) The time-course of the magnetic field and induced electric field waveforms (solid and dotted lines, respectively) beneath the centre of a simple round coil simulating coil driven by a standard rate Magstim 200 machine. (e) The same when driven by a Magstim Rapid stimulator. (a), (d) and (e) from Barker (1999). (b), (c) from Cowey & Walsh (2001).
A simple round TMS coil is an insulated circular winding, with a handle, as portrayed in figure 2. The arrows show the circular direction of current flow during each pulse. This current creates a magnetic field around the coil, which in turn induces an electric field in the tissue beneath the coil. The latter is shown schematically in figure 2 by the curved arrows, whose length crudely signifies the field strength. Three important features are, first, that the induced current flow in the brain is opposite to that in the coil and, second, that the electric field is weakest in the centre of the coil and at progressively eccentric points from the rim and, third, that there is no single ‘point’ where the field is stronger than anywhere else. It is therefore misleading to refer to TMS as focal; it cannot be brought to a focus. However, it can properly be described as local in that the induced field is not everywhere strong enough to stimulate neurons and appropriate placement of the coil on the scalp can lead to selective effects beneath it, for example, shifts in position of as little as 1 cm over visual cortex can lead to a perceived change in position, intensity and quality of a visual phosphene (Cowey & Walsh 2000).
The orientation of even a simple round coil is also important (Barker 1999). As fibres can only be depolarized with TMS by a change in electric field across cell membranes, even slight changes in the positioning of the coil on the head can alter the locus of effective stimulation. An even greater effect is produced by turning the coil over and thereby reversing the direction of current flow. These considerations are probably of minor importance when stimulating cortex tangential to the coil. However, there are some long and relatively unconvoluted white matter tracts beneath superficial cortex, yet sufficiently close to the surface to be affected by the TMS, for example, the visual radiations from the dorsal lateral geniculate nucleus (dLGN) to the striate cortex and the shorter but compact projections from striate cortex (V1) to several surrounding extrastriate areas. Here, the problem of coil orientation is non-trivial, yet is often overlooked.
It is occasionally thought that the problem of identifying the most effective part of the circular coil in a given investigation could be overcome by positioning the coil at right angles to the skull, so that only its rim rests on the skull and only a little of its magnetic field can influence the brain directly beneath it. To do so is to misunderstand how TMS works. When the coil is so positioned, most of the magnetic field is outside the brain, and the induced electrical field is minimal and ineffective, even at the point of contact.
Several of the problems just described can be reduced by using different types of coil, notably the figure-of-eight coil introduced by Ueno et al. (1988) and illustrated in figure 2. When two round coils are mounted side by side and the current rotates in opposite directions in the two coils, the strongest electric field in the tissue beneath them is induced at the centre, where they are contiguous, and is roughly twice as strong as beneath any other part of the coils (Barker 1999). However, this is true only as long as the component coils are roughly symmetrically placed with respect to the skull. If tilted so that one is close to the skull and the other tilts away from it, the latter's magnetic field will be too far from the brain to induce a sufficiently high electric field in the tissue; the strongest electrical field will now be below one of the coils and not below its junction with the other coil. Angling the two component coils towards each other so that they approximate the contours of the skull helps to avoid this problem. Much smaller coils would produce better localization, but they have weaker magnetic fields and are likely to be inadequate for exciting a sufficiently large volume of cortex.
As usual, life is a compromise. A simple coil will serve well enough for many purposes, especially if there is some independent indication of localization, such as which part of the body is made to move or where in the visual field a phosphene appears. Simple coils might even be better when one wishes to stimulate a large body of cortex, e.g. area 46 of the frontal lobe. A figure-of-eight coil of about 8 cm across gives concentrated stimulation that is effective down to approximately 2 cm below its centre, and this is good enough for most purposes (Barker 1999).
(c) How deep into the brain can one stimulate with TMS?
A ‘rough and ready’ answer to this question is approximately 2 cm (Barker 1999), depending on the size of the commercially available coils. For a simple coil, approximately 8 cm across and with a maximum field strength of 2 T, the induced field where the current would stimulate a given and acceptable proportion of nerve cells is more or less hemispherical and the pole is about 2.5 cm from the surface of the skull. Given the thickness of the skull, this means that most brain tissue is not directly excitable by TMS, although it might be indirectly excited by propagated activity from the region beneath the coil. With present TMS technology it is not feasible to stimulate cortex on the ventral surface of the brain, or deep structures such as the amygdala or the thalamus. Even if much larger and more powerful coils were used in order to reach currently inaccessible areas, parts of the brain between them and the surface would be even more intensely excited and the excitation would become progressively less local, which must have happened in some of the very early investigations mentioned above. The electrical field beneath a figure-of-eight coil is more complex in shape but the region of most concentrated stimulation penetrates a little further as well as ending more abruptly. However, it is easy to forget that the areas of secondary stimulation beneath each of the component coils can be as intense at shallower depths, such as 1 cm, and that these could be providing the effective locus of stimulation in a particular investigation using TMS. These issues are discussed in detail by Barker (1999) and Ruohonen & Ilmoniemi (1999).
(d) How safe is TMS?
Any artificial stimulation of the brain is potentially dangerous and the aim is to make the risk negligible. There is no evidence that single-pulse TMS delivered by the stimulators presently available leads to undesirable short-term or long-term effects (Wassermann 1996; 1998; Lorberbaum & Wasserman 2000). It has been used on thousands of subjects, and some, usually the experimenters themselves, have served as subjects in experiments for several years and received thousands of single, i.e. widely separated, pulses. Possible short-term effects could be epilepsy and alterations of mood, while long-term effects could involve memory. So far, single-pulse TMS has a clean bill of health. Rapid-pulse TMS has occasionally led to seizures in a few subjects, although without any evident long-term effects. However, in these subjects, the rTMS was delivered at an intensity close to the threshold for eliciting movements of the limbs. The best practice is never to use subjects with a personal or family history of epilepsy or who have an existing neurological condition, unless the TMS is being used to investigate that condition, and always to use a stimulating intensity that does not exceed a fixed percentage of the threshold intensity for eliciting movement in that subject (see Wassermann (1998) for details of internationally accepted guidelines). However, there may be no close relationship between motor-threshold and threshold for excitability of other regions of cortex (Stewart et al. 2001a). A better measure for visual cortex would be the threshold for eliciting phosphenes. Following such guidelines, subjects have received 0.5 s trains of rTMS at frequencies of up to 10 Hz for thousands of pulses without undesirable effects. Safety addresses discomfort as well as physical harm. TMS can stimulate superficial nerves on the scalp and produce uncomfortable tingling or even pain. The problem is much greater with stimulation at the side of the skull, level with the ears, and especially close to the nape of the neck. It is best to avoid these regions or to choose a coil orientation that minimizes the discomfort, or only to use oneself as a subject. The noise—a sharp crack—from the coil with each pulse can also be unpleasant and possibly dangerous. Even if it does not sound particularly loud, ear plugs should be used because for a brief moment the sound pressure level can reach well over 100 dB and subjective loudness of such brief pulses is not a good guide to their potentially dangerous effects on the inner ear. The answer to the general question about safety is that, sensibly used, TMS is as safe as many other investigative techniques.
(e) How focal is TMS?
This frequently asked question can be likened to another: ‘How long is a piece of string?’ In the absence of any quantitative measure of functional effectiveness—as opposed to strength of magnetic field—the qualitative answer is ‘it depends what you mean by focal’. One rule of thumb is the following: if TMS applied above a particular part of the brain produces a consistent measurable effect, whereas identical stimulation applied above any neighbouring point around it produces much less effect or a qualitatively different effect or no effect at all, this is good evidence that TMS is not exerting its effects by global cortical stimulation. This is illustrated in figure 3, taken from Walsh & Cowey (1998). A real example is shown in figure 4. When rTMS (in this case 10 Hz for 0.5 s) is applied just to one side of the midline at increasing distances from the occipital pole, the subject perceives a flash of light (phosphene), the size and position of which from the fixation point increase systematically and in a highly reproducible fashion as the coil is moved away from the occiput. The most detailed investigation of this phenomenon is provided by Kammer (1999) and Kammer et al. (2005a,b) and our prior knowledge of the representation of the retina in the striate cortex explains the result; as the coil is moved forwards it stimulates striate cortex (and presumably areas V2 and V3) concerned with progressively eccentric representations of the retina (Holmes 1918). The map of the TMS phosphenes is similar to that provided by Brindley & Lewin (1968), who stimulated medial occipital cortex via implanted surface electrodes in a patient blinded by bilateral glaucoma, with one important exception: although the map produced by TMS is different from that provided by Brindley & Lewin in that the TMS phosphenes are much larger, this difference can be reduced by decreasing the strength of the magnetic pulses. TMS can never reproduce the focal stimulation of an implanted electrode, but it does not fall far short. The increase in size of the phosphene with eccentricity is explained by the fact that cortical magnification—the linear extent of cortex concerned with each degree of visual field—falls with retinal eccentricity. As a given strength of TMS affects the same amount of cortex it will stimulate more of the retina representation with distance, and therefore eccentricity, from the representation of the fovea at the occipital pole. Had the cortical representation of the retina in human subjects and its variation with eccentricity never been painstakingly determined over decades by a combination of neuroanatomy, the investigation of neurological patients with occipital brain damage, and the study of phosphenes induced via indwelling electrodes, it could have been done non-invasively with TMS.
Figure 3.
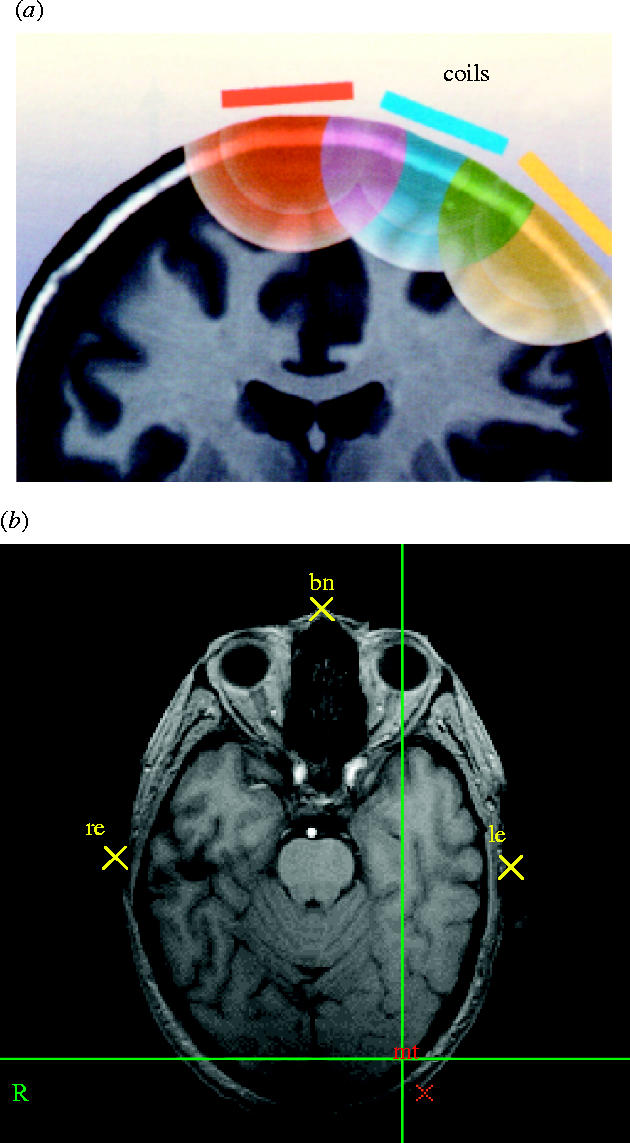
(a) From models of TMS-induced electrical fields, one can infer the region of stimulation by studying the behavioural effects of closely spaced coil positions. In the schematic illustrated, if only the central position yields a particular effect, despite the fact that the induced fields must overlap, the effective locus must be beneath the centre (from Walsh & Cowey 2000, with permission). (b) An axial image through the head on which the positions of the bridge of the nose and the entrance to the ear canals are marked and can be tracked by the Polaris/Brainsight system if the head moves. The TMS coil is simultaneously tracked, allowing the stimulation to be delivered to a known anatomical region, for example, visual area V5/MT, which is marked on the image at the bottom right.
Figure 4.

To the left are eight positions (A–H, at 1 cm intervals) on the scalp, all 1 cm to the left of the midline and starting 2 cm above the inion. On the right are shown the phosphenes drawn by the subject (AC) with respect to the central fixation point. Stimulation was 10 Hz for 0.5 s at 75% of maximum output of a Magstim Rapid stimulator and using a 70 mm figure-of-eight coil. When the same stimulation was applied over the other hemisphere at the point marked MT, the resulting speckled and moving phosphene is shown to the lower right of the fixation point. All the phosphenes were reproducible and retinotopically consistent.
3. Applications Of TMS
TMS has been used in investigations of sensation, perception, voluntary movements, awareness, stroke and mood. As it would be impossible to do justice to all of them in a single article, the following examples are largely confined to visual perception and awareness.
(a) Is TMS clinically useful?
The previous section shows that despite the fact that the magnetic field declines exponentially, the induced electrical field can be functionally restricted to small regions of cortex. However, the chief example chosen was the topographic representation of the retina, which was already known and is hardly of great clinical relevance. Here are two very different examples.
It is important to determine which cerebral hemisphere controls speech and language in patients who are being considered for radical surgery for removal of a temporal lobe tumour or an otherwise uncontrollable epileptic source in one temporal lobe. If the surgery removes or encroaches on the language areas, the patient may become seriously and permanently dysphasic or aphasic, which in some instances can be more disturbing than the condition for which the surgery is a treatment. This is why Penfield & Rasmussen (1950) were stimulating the exposed cortex of neurological patients prior to surgery for removal of parts of the temporal lobe. If stimulation above Wernicke's or Broca's area, usually on the left, disrupted or even arrested speech, the dominant hemisphere for language had been identified. Subsequently, it was discovered that injection of sodium amytal into the left or right external carotid artery (the WADA test) also produced speech arrest and indicated which hemisphere controlled language. Unfortunately, the WADA test is not without risk. TMS should be a non-invasive and relatively risk-free alternative because its delivery can be confined to one hemisphere (although propagated activity might then reach the other hemisphere). Several attempts to disrupt speech by unilateral rTMS have been made and the results are inconsistent but highly promising. For example, Epstein et al. (2000) found a positive correlation between the results of the WADA test and TMS delivered over Broca's area (inferior frontal cortex), but the WADA test correlated better with the outcome of surgery. However, Stewart et al. (2001b), using the more focal figure-of-eight coil, showed that the disruption of speech in normal subjects could arise either by stimulation over the precentral gyrus, which directly interferes with the activity in the mentalis muscle that is involved in speech, or over the middle frontal gyrus. As earlier attempts were carried out with large simple coils they might have stimulated both areas. Over the more anterior site there was a clear effect of hemisphere in that stimulation on the right side was far less effective. Unfortunately, the WADA test could not be administered to the subjects, and this important clinical issue remains unresolved, although the speech arrest from rTMS over the left anterior site is so reliable as to be evident in demonstrations to groups of biomedical students.
The second example concerns the mechanism of recovery from paralysis of one hand caused by a stroke. Most patients show some recovery, which is often extensive although rarely complete. Does the recovery reflect restoration of function in the region of the stroke (the conventional view) or might it indicate that the motor cortex for the hand area in the other hemisphere has improved its already existing but slight involvement in the control of hand movements (a possibility suggested by functional neuroimaging of such patients)? This was investigated by applying rTMS to the hand area of the undamaged hemisphere after recovery from stroke (Johansen-Berg et al. 2002). The stimulation briefly impaired the recovered finger movements in the previously paralysed hand and the degree of TMS-induced impairment correlated with the severity of the original paralysis, indicating that the more one hemisphere is damaged, the more the other hemisphere is recruited in the recovery. It is difficult to see how, with existing technology, this could have been demonstrated without their use of a combination of fMRI and TMS.
(b) The effect of a single pulse of TMS
The results of a justly famous experiment are shown in figure 5. Its importance has grown the more we realize that we still do not fully understand its implications, which surely apply to current experiments. What Amassian et al. (1989) discovered is that a single magnetic pulse delivered over the occipital cortex at the back of the head, and therefore, maximally effective on the representation of the centre of gaze in primary visual cortex, impaired visual perception. The perceptual task for the subjects was to identify three letters—trigams—briefly presented at the fixation point on a visual display unit (VDU). Normally a trivially easy task, the subjects were impaired when the pulse was delivered between 60 and 140 ms after the presentation of the trigram. At a delay (called the stimulus onset asynchrony; SOA) of 80–100 ms, their performance was consistent with complete erasure of the percept; none of the letters were perceived. This result is important for several reasons, the principal of which is that an induced current lasting less than 1 ms can influence performance on a perceptual task for tens of milliseconds. And the reason is still unclear! Experiments on TMS cry out for investigations of its effects on the physiological and pharmacological properties of individual neurons, which at present would have to be carried out on the brains of conscious animals. A subsidiary conclusion is that trains of TMS pulses that are tens of milliseconds apart, i.e. rTMS, should be able to block perceptual and cognitive performance for much longer periods, as described below. One of the regrettably few experiments on the physiological effects of TMS (Moliadze et al. 2003) examined the effects of a single biphasic pulse on the visual responses of single cells in area V1 of anaesthetized cats. One pulse at the high intensities typically used in studying the effects of TMS on visual performance usually produced suppression of excitability for about 100–200 ms, followed by a period of increased responsiveness. The authors suggest that these two periods might reflect the different effects of TMS on excitatory and inhibitory cortical neurons. A similarly long-lasting inhibitory effect was invoked by Kammer et al. (2005b) to explain the masking effect of TMS on visual perception. Although the relative effects of induced excitation and inhibition remain unproved, the important message with respect to the present paper is that a single pulse of TMS can effect neurons in the visual cortex for far longer than the duration of the pulse, making the results of Amassian et al. (1989), Corthout et al. (1999a,b) not in the least surprising.
Figure 5.
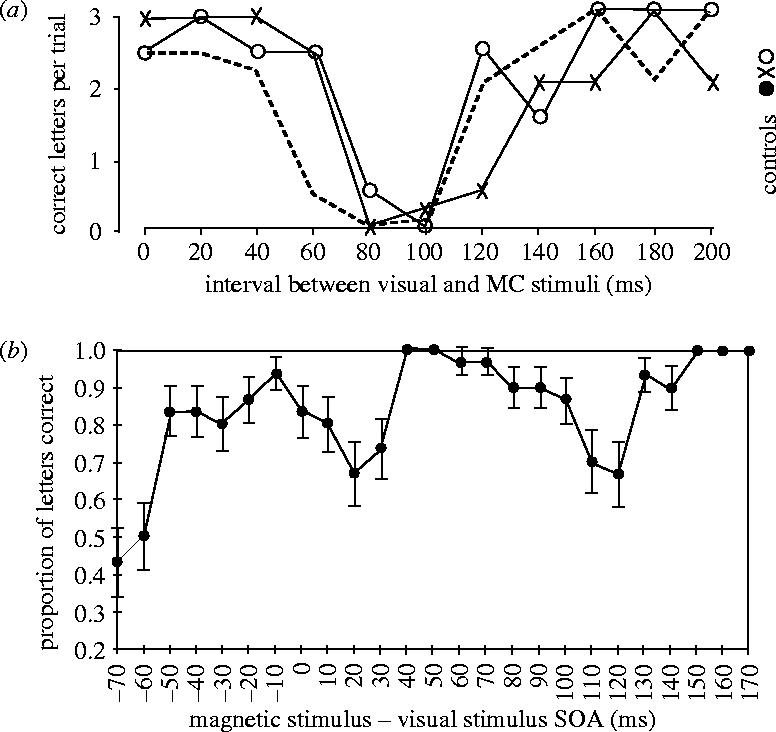
(a) Visual suppression curves of three subjects. The proportion of correct identifications of three dark letters briefly flashed on a bright background is plotted as a function of the delay between visual stimulus onset and the subsequent application of a TMS pulse delivered over the primary visual cortex with a simple round coil. (From Amassian et al. 1989, with permission.) (b) Identification of a single letter chosen at random from a possible five letters. The letter was present for approximately 4 ms at the fixation point. The graph shows the proportion of letters correctly identified as a function of the delay for a subject and shows three dips in performance as well as the blink artefact when the single TMS pulse was delivered 70 ms before the letter. Each point is the mean of 30 trials and error bars denote the s.e.m. (Redrawn from Corthout et al. 1999a,b.)
The method introduced by Amassian et al. (1989) was subsequently used by Corthout et al. (1999a,b, 2000, 2002, 2003) in a finer-grained analysis of the temporal properties of single-pulse TMS applied over the occiput. The outcome was surprising. Using SOAs from −70 to +200 ms they discovered that correct identification of a single letter (out of five possible letters) presented for as little as 4 ms, could be impaired at no fewer than four SOAs, as shown in figure 5. What could be the explanation for this apparently extraordinary result? The most severe impairment occurred when the pulse was delivered −70 ms before the presentation of the visual stimulus, and the reason is now clear. By measuring the temporal dynamics of the eye blink, Corthout (2002, unpublished work) was able to show that both eyes had closed about 70 ms after the pulse, presumably as a result of stimulating the efferent pathway to the eyelids. Although in retrospect this revelation may seem trivial, it provides a lasting caution about evaluating the effects of TMS on visual perception: check the eyes! The other dips in performance are much less easy to explain. At a SOA of −20 ms there is a shallow dip, which at first was believed to be statistically insignificant. However, its presence in all subjects indicates the contrary. A probable explanation is that stimulation of primary visual cortex activates the extensive corticofugal projection from cortex to the dLGN and thus interferes with the signals from the retina that reach the dLGN from the subsequent brief visual stimulus. The third dip is deepest at a SOA of approximately +20–30 ms and this coincides with the arrival in striate cortex of information from the eye as a result of the visual stimulus. It is the fourth dip, first shown by Amassian et al., that is the most difficult to understand. At a SOA of +90 ms, the visual information has long since reached the primary (and probably secondary) visual cortex. Either the TMS has backwardly masked the processing of the stimulus, or it coincides with information projecting back to primary visual cortex that is concerned with visual identification rather than visual registration. The following section provides evidence for the latter hypothesis. However, the general message with respect to the use of single pulse TMS is that, at least over primary visual cortex, its effects are much more complex than first envisaged.
A single pulse applied slightly further forward and more laterally, over the lower bank of the intraparietal sulcus, has an effect that reveals the role of this region in visual search tasks. Figure 6a shows two kinds of visual display much used in experiments on visual selective attention. On the left the target is instantly identifiable; it pops out because its colour differs from that of all the other items on the screen—the distractors. On the right, the target does not pop out; it has to be found by searching the display for the one item that has a unique conjunction of two features, one or other of which occurs in every distractor. Conjunction search is not simply a laboratory phenomenon; we carry it out every time we look for a particular item—a pair of scissors for example, in a cluttered kitchen drawer. In formal visual search tasks the subject commonly is asked to decide whether the display actually contains the target or not and the dependent variable is the time taken to reach a decision. The target is present in half the trials. When Ashbridge et al. (1997) delivered a single magnetic pulse over the posterior parietal cortex (PPC) of normal subjects they discovered the effect shown in figure 6. TMS had no effect on pop-out tasks but on a conjunction task it significantly slowed the reaction time on target-present trials if delivered about 90 ms after the display appeared and at about 160 ms on target-absent trials. The former is believed to be the effect of TMS on this extra-striate region when information about the display is first processed there, whereas the later effective SOA is more likely to reflect the time period during which the top-down cognitive decision to terminate the search is relayed back to the parietal cortex.
Figure 6.

(a) Simplified example of the difference between parallel (pop-out) and serial (conjunction) search. In practice, many more items are displayed. (b–d) Mean normalized response time (±s.e.) of five subjects when a single pulse of TMS was applied over the right parietal cortex at various delays after the stimulus was presented. For each subject, the average response for each delay was normalized to the no-TMS condition. (b) There was no effect of TMS on reaction times in the pop-out task. (c) The solid line shows that stimulation around l00 ms after presenting the display during a conjunction task resulted in significantly longer RTs when the target was present (compared with the no-stimulation condition, dotted line). Other TMS delays had no significant effect. The broken line shows that TMS on the conjunction task, when the target was absent, significantly increased reaction times when applied 160 ms after the stimulus onset. (d) After over-training on the task, which renders TMS ineffective, the effect was restored when new conjunction stimuli were introduced.
This initial demonstration has been replicated many times. It almost certainly highlights the role of the parietal cortex in visually searching the environment, and it is consistent with functional activations found in parietal and prefrontal cortex during visual search tasks and with the well-known effects of parietal lesions on visuo-spatial perception. However, TMS has revealed a further aspect of visual search. Its effect on performance is greatest as the conjunction search task is being learned. With extensive practice subjects become progressively faster at recognizing the presence or absence of the target and increasingly immune to the TMS. However, a new conjunction of features reinstates the effect of TMS (Ashbridge et al. 1997). It is as if these two cortical areas are necessary for learning but not for performance once it becomes automatized. A similar phenomenon is seen when functional neuroimaging is used to reveal changes in regional blood flow during the learning of tasks involving the discrimination of visual motion (e.g. Vaina et al. 2001). Although not yet attempted, TMS could be used to explore the importance of different activated areas during and after perceptual learning.
(c) Dissecting parietal neglect
Although the posterior parietal region studied by Ashbridge et al. (1997) is important only during performance of a novel conjunction search task, the same region is necessary for a different visuo-spatial task. When normal subjects are asked to bisect a horizontal line or to judge whether already transected lines are actually bisected, they make few errors. There is characteristically a slight misjudgement in that the left half of a bisected line is erroneously perceived to be slightly longer than the right, termed pseudo-neglect. However, patients with large right dorsolateral parietal damage display a collection of symptoms that indicate neglect and/or horizontal shrinkage of the left side of space and the pathological condition known as parietal neglect has been extensively studied for well over a century. Among other things, such patients judge a bisected line to be much longer on the right. Moreover, the distortion can be much greater in near-space (within reach) than beyond it, or vice versa (Halligan & Marshall 1991; Cowey et al. 1999). When transected horizontal lines were briefly presented within reaching distance to normal subjects and rTMS (10 Hz, 0.5 s) was directed at the Posterior Parietal Cortex (PPC), the subjects misperceived the bisected lines as being longer on the right, i.e. the opposite of the normal pseudo-neglect (Bjoertomt et al. 2002). The effect was not present with displays in far space (figure 7). Nor was it present with TMS at other sites. It was only effective when delivered over the parietal region that is activated in functional neuroimaging of subjects while they carry out visual-spatial judgements of the kind that are severely impaired after right parietal lesions.
Figure 7.
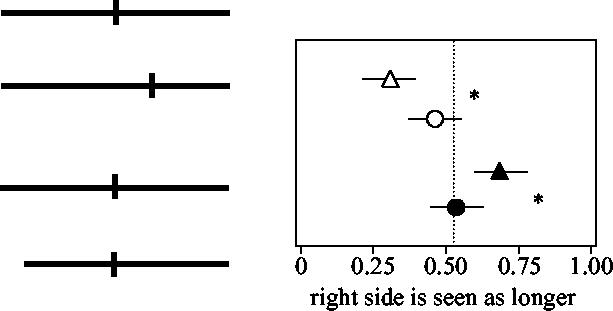
Effects of viewing distance and parietal TMS on neglect. The results on the right, top, show the proportion of ‘right side is longer’ responses for bisected lines in near space (unfilled triangles) and far space (unfilled circles) with normal subjects. Error bars show ±1 s.d. Significantly fewer of the responses were ‘right-is-longer’, which demonstrates the well known right pseudo-neglect. The difference in the subjects' responses at the two viewing distances was significant (*p<0.05). Below, right, are shown the effects of stimulating the right PPC on the same subjects' responses. They are again normalized and show significant shifts in the perceived midpoint during TMS; in near space the right side was now perceived as longer, filled symbols (*p<0.05).
(d) The perception of visual motion
In our everyday cluttered visual environment, moving objects are much easier to pick out than stationary ones. Even a camouflaged object becomes visible when it moves, as all predators know, and we can even identify moving objects against a moving background like foliage swaying in the wind. Even more impressively, we can perceive the direction of motion even when there is no overall change in the position of objects, for example, snow drifting past a window. The latter is known as global motion. But what is an object? The object, or the snow, can usually be defined with respect to its mean luminance in comparison with that of the background (perceptually brighter or dimmer), and in most circumstances, this suffices. However, sometimes the average luminance of the object is the same as that of its surroundings, and if we were able to compute only luminance differences, we would not, in such an instance, see its motion. On the other hand, when displays are constructed in which the items that move have the same average luminance as the background, their motion remains eminently visible. These two categories of motion are called first order (or Fourier) and second order (non-Fourier), respectively, and the distinction is one of the most important in the study of the computation and the neural basis of motion processing. One means of computing motion even when the moving object has the same luminance as its surroundings is to take account of the colour of the object and its background, but this alone is insufficient because we can still detect the direction of motion when the entire display is achromatic. The simplest suggestion for solving the problem is that the first-order process computes the motion signal directly by spatio-temporal Fourier filtering of signals proportional to the local retinal illuminance, whereas a square wave, nonlinear, rectification then yields any second-order component (Chubb & Sperling 1988; Wilson et al. 1992; Boulton & Baker 1993).
How and where any nonlinear transformation is achieved is still unclear. It could occur between neighbouring cells in the same brain region or between cells in separate brain regions, or the distinction could arise even as early as the retina and be onwardly projected to separate brain regions that are not necessarily directly connected. There are four ways of investigating the two types of motion processing: single cell recording, neuroimaging, the study of patients with cortical damage and TMS. The next section gives two particularly striking examples of the latter.
Many psychophysical studies have addressed the nature of these two motion systems and their interaction, but they do not address the problem of how and where the distinction arises. There is physiological evidence for the existence of neurons in area MT and in the superior polysensory areas in macaque monkeys that are especially sensitive to second order motion (Albright 1992; O'Keefe et al. 1993; O'Keefe & Movshon 1996). Zhou & Baker (1993), recording from areas 17 and 18 in cats, demonstrated a pathway selectively responsive to second-order motion. Especially relevant with respect to the present account are psychophysical investigations of neurological patients with unilateral brain lesions, which have demonstrated that second-order motion can be selectively impaired in the visual field contralateral to the lesion (Plant et al. 1993; Vaina & Cowey 1996). The obverse condition can also occur, i.e. where performance on second-order motion is normal, but first-order motion is impaired (Vaina et al. 1998). Collectively, such studies of rare patients provide some of the strongest evidence for gross regional segregation of the two mechanisms rather than one. For example, patient RA, impaired only on first-order motion, has a focal lesion in the medial part of the occipital lobe, whereas patient FD, selectively impaired on second-order has a lesion in the dorsolateral part of the junction between the occipital and temporal lobe. Their cortical lesions, as shown by structural magnetic imaging, are shown in figure 8. In patient FD, the lesion is located dorsolaterally in the left hemisphere and is almost entirely cortical. In patient RA, the lesion is located medially in the right hemisphere and demonstrates cortical and white matter involvement. It involves chiefly the dorsal parts of visual areas V2 and V3.
Figure 8.

Examples of first-order (a) and second-order (c) global motion using flickering random dots. In (a), the tokens (small clusters of pixels) differ in mean luminance from the surround. In (c), the tokens differ from the surround in contrast but not in mean luminance. Patient RA was impaired in his affected hemifield on the first-order task (b), whereas patient FD was impaired in his affected hemifield on the second-order task (d). Their cortical lesions, established by MRI, are shown on a lateral view (FD) and coronal view (RA). The dots on the lateral surface of FD indicate the likely position of area MT. Abbreviations: cs, central sulcus; syl, Sylvian sulcus; sts, superior temporal sulcus.
Both patients were tested on a variety of first-order and second-order motion displays (see Vaina et al. 1999 for complete list) and a typical result is shown in figure 8. In the two kinds of display, the background consisted of flickering random dots, and subjects had to perform a direction discrimination (left or right) of first-order (figure 8a) or second-order (figure 8c) motion in which a variable proportion of the small binary light and dark texture patches move coherently, left or right, while the others are presented from frame to frame at random location within the aperture. In the first-order version of the stimulus (figure 8a), the mean luminance of the tokens and the background is different while the contrast is identical. In the second-order version, the moving textures differ in mean contrast from the background, but not in mean luminance. Figure 8b,d shows that in the visual hemifield contralateral to the lesion, RA was impaired with first-order motion but not second-order, whereas FD showed the opposite dissociation. The fact that RA was conspicuously unimpaired on second-order motion suggests that the two motion systems are indeed mediated by two different pathways from an early stage of cortical processing. A simple linear model in which first order leads to second order is untenable and the computational implications of this are discussed by Clifford & Vaina (1999).
If the computation of first-order and second-order motion becomes regionally separated in the cortex as the evidence from clinical neuropsychology suggests, and they do not interact via direct connexions, TMS should be able to display this by direct stimulation of one or the other. This was investigated by Cowey et al. (unpublished). Six normal observers were tested with the two kinds of display, shown in figure 8a,c. After determining the threshold coherence for performance at 75–80% correct when the display was presented in the right lower quadrant (precisely where visual phosphenes occurred with high magnetic fields pulsed over V5 or V2/V3), they were then given blocks of trials at this threshold coherence while TMS below phosphene threshold was delivered to the left hemisphere over areas V5 or V2/V3 or the PPC centred on the angular gurus. In each trial the display was presented for 500 ms and coincided with TMS at 10 Hz for the same duration. The result is shown in figure 9. TMS over PPC had no significant effect on performance, whereas performance was significantly impaired for both first- and second-order motion by the same stimulation over V5 or V2/V3.
Figure 9.

Six normal subjects were tested on the same tasks presented to patients FD and RA and shown in figure 8. TMS delivered above area V5/MT or V2/V3 impaired performance on both tasks. Stimulation over the vertex had no significant effect.
At first sight, this result appears to show that both regions are equally involved in processing first-order and second-order motion, as suggested by functional neuroimaging experiments where the two kinds of motion have similar effects with respect to regional cerebral blood flow (e.g. Dupont et al. 2003; but see Dumoulin et al. 2003 for a contrasting view). However, the alternative explanation is that the two regions are indeed carrying out different neural computations computations, but that additionally, they are also in functional communication with respect to the motion the observer is attempting to discriminate and that stimulating either of them by TMS will activate the other. Fortunately, this is testable by recording evoked potentials when each is stimulated by TMS. A lesion will remove this communication of course and can reveal their different contributions to motion perception.
(e) Perceptual priming
A well known but poorly understood phenomenon in visual perception is perceptual priming. For example, presentation of a consciously perceived (or even unseen, subliminal) visual stimulus can increase the speed or probability of the same stimulus being detected over a subsequent period of seconds or even minutes. The cortical locus, let alone the cellular mechanism, of this perceptual priming—if indeed it is a cortical mechanism—is unknown, although suggestions include a wide distribution (Tulving & Schacter 1990), areas beyond V1, but prior to regions involved in object recognition (Magnussen & Greenlee 1999; Magnussen 2000), and predominantly the parietal lobe (Farah et al. 1993; Marangolo et al. 1998). TMS offers a method of revealing the locus of the priming by briefly disrupting cortical activity after the stimulus has been seen but before its next presentation. Likely cortical candidates for the site of the priming effect are the primary visual cortex, V1, or one or more of the extrastriate visual areas whose neurons are selectively responsive to the relevant visual features of the stimuli, e.g. areas V5/MT and PPC for stimulus motion, region LOC for shape and the caudal ventro-medial areas V4/V8 for colour. The latter areas are inaccessible to TMS but the former are not. Campana et al. (2002) therefore presented normal subjects with short trains of rTMS over regions V1, or PPC or V5/MT while they performed a visual motion–direction discrimination task. If an area is the site of the short-term changes that underlie priming, the latter should be abolished or impaired by the TMS. This was done as follows.
Seven right-handed adults, aged between 23 and 29, took part. Two had no previous experience of TMS. The display consisted of four virtual squares (each 20 by 20) symmetrically arranged around the centre of the VDU. Each square contained 100 spatially random bright dots, one pixel in size and moving horizontally or vertically at 3° s−1 in the same direction within a square. In three of the squares the direction of motion was identical and in one of the four it was orthogonal to the other three. This odd direction out was the target to be detected on each trial by the subject. Each trial began with a white fixation point (eight pixels in diameter) for 500 ms followed by the four virtual squares presented simultaneously for 160 ms and followed by a blank screen (see figure 10a). The subject had to press one of four response buttons, using the thumb and first fingers of each hand, to indicate which of the four squares contained the target. The train of TMS pulses was applied 500 ms after the subject had made their decision and was followed by the fixation spot for the next trial. A target was present on every trial but—unknown to the subjects—did not appear in the same square on any two consecutive trials. The direction of the moving dots and the location of the target was pseudorandomized across trials. Subjects were given 320 trials in blocks of 40 and received 80 TMS trials per stimulation site and 80 control trials. Before the main experiment the subjects practised without TMS and all showed a priming effect. The independent variable was the direction of the dots in the target square, which could be either the same as or different from that of the previous trial, and the statistical analyses assessed the effects of TMS on the relative reaction times of trials in which the preceding target was moving in the same direction versus those trials in which the target was preceded by a different direction.
Figure 10.

(a) The temporal sequence of events in the priming task where the subjects had to judge the direction of global motion. Subjects were presented with a fixation spot for 500 ms followed by four virtual squares each containing prominent random dots moving in the same direction in three squares and a different direction in the fourth. The stimuli were presented for 144 ms followed by a blank screen until the subject responded. Response was followed by a further 500 ms of blank screen after which rTMS was applied for 500 ms before the fixation point for the next trial. (b) The priming effect is abolished by TMS delivered over the motion area V5/MT. (Modified from Campana et al. (2002).)
The result of the experiment (for details see Campana et al. 2002) is shown in figure 10b. Although TMS had no effect on percentage correct performance, the prominent difference between reaction times on same and different trials was abolished by TMS delivered over area V5/MT but not elsewhere. In a separate condition, the dots moved in the same direction in each square but had the same colour in three squares and a different colour in the target square. TMS over V5/MT now failed to abolish the colour priming effect. More recently (unpublished), the same authors have found that the priming effect of the position of the target is also resistant to TMS over any of these dorsolateral extrastriate visual areas. The results of the experiment are clear. Whatever the neurophysiological and pharmacological nature of the ‘record’ of the important feature of the target stimulus on the previous trial, that record is present in the relevant extrastriate visual area, where it can be disrupted by TMS. Similar priming experiments can and almost certainly will be done with different accessible areas and appropriate stimuli, e.g. shape and position. Finally, the results complement demonstrations, using invasive methods in monkeys, of the importance of areas V4 and TEO for priming in the colour and form domains (Walsh et al. 2000).
(f) The role of synchronized cortical discharge in awareness and cognition
As TMS can be delivered with millisecond precision and at high frequency it should be possible briefly to alter the temporal properties of the electroencephalogram (EEG) in the underlying cortex and thereby investigate the putative importance to conscious awareness and cognitive performance of the frequency and phase locking of the EEG. Few investigations have been conducted but they indicate that performance can be enhanced or impaired according to the properties of the induced waveforms. For example, Klimesch et al. (2003) studied the performance of subjects on a mental rotation task similar to that shown in figure 11, but instead, using as stimuli outline cubes with different symbols on each side and presented with different degrees and directions of rotation. In each trial one cube was the standard, and of the five others, only one matched the standard. The subjects had to identify the matching cube despite the fact that all cubes had a different orientation. The EEG was recorded and the alpha rhythm (around 10 Hz) for each subject was determined. The display in each trial was presented immediately after a train of 24 TMS pulses at a rate of alpha +1, alpha −3 or 20 Hz. The train was delivered over medial frontal cortex (FZ), PPC (P6) or with the coil tilted 90° over P6 as a sham condition. At alpha −3 or 20 Hz there were no differences in percentage correct performance on the mental rotation task with respect to the baseline scores with sham stimulation. However, at a frequency of alpha +1 there was a statistically significant improvement of 12–15% after stimulation of frontal and parietal sites. The authors relate the improvement to previous observations reporting that cognitive performance correlates with endogenous modulations of the alpha rate (Klimesch 1999) and to functional neuroimaging studies that suggest that both cortical regions (FZ and P6) are involved in mental rotation (Richter et al. 2000). The experiment does not explain why a particular alpha frequency, just before carrying out the mental rotation and its dramatic collapse during the mental task, is so influential, but it does suggest that the relationship between EEG and performance is causative.
Figure 11.

Examples of a mental rotation task where the subject has to judge which of the images cannot be fitted to all the others. In a similar, but not identical task, Klimesch et al. (2003) showed that rTMS above the medial prefrontal or parietal cortex at a frequency just above each subject's alpha frequency improved performance on the task.
Even a single pulse can briefly synchronize cortical activity in the stimulated region. A recent example is the study by Paus et al. (2001), who delivered single or paired pulses over motor cortex of human volunteers while recording the EEG. Single-pulse TMS induced a short period of synchronized activity in the beta range (15–30 Hz) which lasted approximately 300 ms. Although the authors were not simultaneously assessing performance on any behavioural task, their results are of direct relevance to theories of perceptual awareness that relate awareness to phase-locked oscillations in the 40–70 Hz band in the relevant cortical areas (Singer 1993). If, as Paus et al. suggest, single-pulse TMS resets the oscillators at a lower frequency (and perhaps abolishes phase locking of individual cells), the disruptive effect of single-pulse TMS on letter recognition in the experiments of Amassian et al. (1989) and (Corthout et al. 1999a,b, 2002, 2003) make good sense. What are needed are studies of TMS on the temporal properties of individual neurons in animals, including behaving animals, but none has yet been reported.
(g) Studies of visual conscious awareness
When any part of the primary visual cortex in man is destroyed, the patient has a visual field defect in which he is clinically blind. Although this does not necessarily prove that conscious visual percepts are created there—after all, we are blind if the eyes are destroyed, but no one suggests that visual consciousness is created there—it does indicate the importance of V1 to visual awareness, especially as destruction of no other visual area produces phenomenal blindness. Despite this blindness, some patients possess blindsight, which is the ability to respond in a highly successful manner and by forced choice guessing to visual stimuli they deny seeing (Pöppel et al. 1973; Weiskrantz et al. 1974). For example, they can detect, localize and even discriminate between a large range of visual stimuli, initially to their surprise because they are at a loss to explain how they do so. Many comprehensive reviews and critiques of blindsight exist (e.g. Stoerig & Cowey 1997; Weiskrantz 2001; Cowey 2004). Unsurprisingly, investigators have attempted to discover how the blindsighted subjects perform so well and therefore to reveal something about the cortical processing of stimuli that fail to elicit conscious visual awareness. For example, the much-studied subject GY showed functional activations in visual areas V5/MT and in or around area V3 when moving patterns were presented and confined to his blind hemifield (Barbur et al. 1993). When area V1 or V5 (and subsequently area V3) in his normal hemisphere was stimulated with rTMS, GY reported and could draw his phosphenes, which were stationary from V1 stimulation but moving from V5 stimulation. When the same stimulation was delivered over V1 or V2/V3 of his blind hemisphere he never reported a phosphene, even at maximum TMS currents (Cowey & Walsh 2000; figure 12). This confirms that even though these extrastriate areas are activated by moving stimuli, the latter are not consciously perceived. However, would TMS applied during a motion discrimination disrupt blindsighted performance? Using a simple discrimination (a 200 area of moving dots in his blind hemifield), his ability to tell in which of two consecutive 0.5 s intervals the dots moved was significantly impaired by TMS applied above the motion area V5 of the damaged hemisphere (Cowey et al., unpublished work; figure 13). TMS elsewhere had no effect. Whether phosphenes could be experienced in his blind field by interactions between areas V5 in the blind and the seeing hemispheres is still being investigated.
Figure 12.

Phosphenes elicited by medial occipital TMS (a) in a normally sighted observer (b) in retinally blind subject PS, and (c) in hemianopic patient GY. The coordinates give the site of stimulation in dorsal-lateral order. For example, 2,1 indicates that the coil was centred 2 cm rostral to the inion and 1 cm lateral to the midline. Note that as the coil is moved rostrally from the inion, the phosphenes migrate inferiorly and that as the coil is moved away from the midline the phosphenes migrate farther into the contralateral visual field. In subject PS, the phosphenes remain resolutely in the central few degrees of the visual field despite stimulation being delivered between 2 and 5 cm above the inion and up to 2 cm lateral. Moving phosphenes are shown in the three right-hand figures, (a) in a normally sighted observer, (b) in retinally peripherally blind subject PS, and (c) in cortically hemianopic patient GY with TMS in his undamaged hemisphere. All three subjects reported moving phosphenes. Reproduced from Cowey & Walsh (2000), with permission.
Figure 13.

The effects of stimulating the motion area V5/MT in the ‘blind’ hemisphere of subject GY on his blindsighted discrimination of moving versus stationary random dot arrays (TMS 10 Hz, 0.6 s, 0.5 s stimulus display). At all three speeds (4, 32 and 64° s−1) he was impaired by the TMS above V5/MT but not at a control sight. The dashed line indicates chance performance out of 70 trials and at the two lower speeds he did not differ significantly from chance in the TMS condition.
The significance of GY's inability to have a visual sensation when his area V5 is stimulated by TMS is highlighted by the effects of identical stimulation in patient PS, whose V1 is intact, but who is completely blind as a result of an accident that destroyed both his optic nerves 10 years before he was investigated (Cowey & Walsh 2000). Unlike GY, PS experiences vivid phosphenes when V1 or V5 are stimulated with rTMS and can describe and localize them with respect to his fingertip placed on a drawing board in front of him (figure 14). Whether his V5 phosphenes reach conscious awareness via the backprojections to V1 is unknown (but see the following section). However, PS reveals the importance of V1 in a different manner. A few years after his accident he began to experience visual flashes or bursts of light in response to loud, unexpected and complex meaningful sounds. No matter where the sound was presented and localized in his auditory field, the flashes, usually coloured, appeared in front of him. The latter corresponds to what we observed when stimulating his occipital cortex with TMS: his phosphenes were confined to what would be his macular visual field if he had real sight (figure 14). PS is demonstrating late-onset acquired auditory–visual synaesthesia. We therefore investigated its cortical origin by measuring his evoked potentials to a range of brief auditory stimuli and compared the activity evoked in trials where he did or did not experience a phosphene (Rao et al. submitted). Only when he experienced a phosphene was prominent activity evoked in visual cortex and it was confined to recording sites at and around the occipital pole (OZ), where the central visual field is represented (figure 15). In a control subject, AC, who does not experience auditory–visual synaesthesia, there was never any auditorily evoked activity in V1. Together, the evidence for TMS and EEG point to the importance of V1 for phenomenal visual awareness.
Figure 14.

The positions of phosphenes produced in a normal subject (AC) and a retinally blind subject (PS) by rTMS delivered over the scalp positions shown to the left of the plots of the phosphenes. Phosphenes were readily elicited in both subjects, although those in PS were much more confined to the centre of personal space.
Figure 15.

When event-related potentials were recorded over the entire skull, there was no evoked response to auditory stimuli in the caudal occipital region of the sighted subject AC (dashed line), but there was a clear and significant response in the same region in the retinally blind subject (PS), corresponding to his synaesthetic experience of visual phosphenes in his central visual field in response to sudden and meaningful sounds (thick black line). The thin black line shows a smaller occipital response to sounds that failed to produce a phosphene. At the top are shown the evoked responses in auditory cortex recorded at position CZ. The symbols OZ, O1 and O2 refer to standard occipital EEG positions over visual cortex at the back of the head.
(h) Interactions between cortical areas
Knowing that two cortical areas are anatomically connected is important, as is knowing that stimulating one of them evokes activity in the other. TMS is especially helpful in establishing the latter, but it can additionally reveal the time-course of interactions between areas, and therefore, something of their role in behaviour. There are still few studies of such interactions, but the following provides an example of their power. As already described, TMS above area V1 produces stationary and often coloured phosphenes in accordance with the topographic representation of the retina in V1 (figure 4). In contrast, similar stimulation above the motion area V5 gives rise to larger, and moving, phosphenes that are rarely, if ever, coloured. These two areas are strongly interconnected in the anatomical sense. However, it is only destruction of V1 that produces phenomenal blindness and the accompanying ineffectiveness of TMS above V5 to produce phosphenes (Cowey & Walsh 2000), as if only V1 is necessary for conscious visual awareness. This was investigated by Pascual-Leone & Walsh (2001), who used single-pulse TMS applied above V1 and V5 at various interstimulus delays in an attempt to tease apart the role of the two interconnected areas in conscious awareness. Their first step was to establish for each subject the positions of the TMS coil above V1 or V5 of the same hemisphere, and the threshold magnetic field strength, that produced a phosphene in the same position of the subject's visual field. A single pulse of this intensity was then applied above V5, accompanied at some delay by a pulse over V1 at only 80% of threshold and which alone did not produce a phosphene. The subjects were asked to report whether they saw a phosphene and, if so, whether it was stationary or moving or whether they were not sure whether it moved. The results of testing eight subjects are shown in figure 16. The conspicuous result is that when TMS was applied over V1 about 20 ms after the pulse to V5, the subjects no longer experienced a moving phosphene and, occasionally, no phosphene at all. The authors' interpretation is that the feedback connexions from V5 to V1 provide information about visual motion and that when area V1, necessary for conscious awareness, is briefly disabled while the feedback information arrives, the moving percept is unsustainable. Other and more complex interpretations are possible, but the most important practical message is that without TMS, the issue might not even have been investigated.
Figure 16.

(a) schematic of the experimental design of the V5–Vl interaction study. The brain MRI image from one of the subjects displays the site of stimulation for induction of stationary (VI) and moving (V5/MT) phosphenes. The location on the subject's scalp of the centre of the figure-of-eight coil is superimposed on the subject's brain as reconstructed from an anatomical MRI. (b) Mean responses of all eight subjects to combined stimulation of V5 and Vl. The V5–Vl TMS asynchrony is on the x-axis: negative values indicate that VI was stimulated before V5, and positive values indicate that VI was stimulated after V5. The subjects made one of four judgements on each trial. (i) A phosphene elicited by V5 TMS was present and moving, (ii) a phosphene was present, but the subject could not decide whether it moved, (iii) the phosphene was present but stationary, (iv) no phosphene was experienced. TMS over VI between 10 and 30 ms after TMS over V5 affected the perception of the phosphene (see text for more details).
4. Summary and conclusions
TMS does not explain how the brain works, that is, how it carries out its neural processing. It is a tool that can reveal which cortical areas are involved and even necessary, and when they are involved.
TMS is particularly useful in conjunction with other techniques such as fMRI and EEG. Its spatial resolution approaches that of the former and can be better than that of the latter. Its temporal resolution is outstanding, making it possible to determine the order in which different cortical areas are involved in a particular behavioural task and precisely when they are vulnerable to interference.
The effects of TMS over a particular area of cortex are not necessarily the same as the consequences of brain damage to the same part of the cortex, in part because the brain shows some reorganization after damage, but also because TMS affects not only the region beneath it but also more distant regions via propagated neural activity.
Much remains to be discovered about the effects of TMS on individual neurons. For example, is TMS more effective at depolarizing cell bodies in grey matter or axons in white and grey matter? Are functionally and morphologically and pharmacologically different neuronal cell types equally affected, or is their sensitivity and recovery different.
At present, TMS is most useful in investigating the dorsolateral and dorsomedial aspects of the brain. More than half the brain remains out of range of ‘selective’ stimulation by TMS, just as it was to David Ferrier.
Despite the latter point, David Ferrier would have relished the opportunity to use TMS.
Acknowledgments
I am pleased to thank the UK Medical Research Council (grant G971/387/B) for their research support and my colleagues Dr Iona Alexander and Dr Amanda Ellison for their indispensable help in preparing the figures. It is also a pleasure to thank Dr Lisa Cowey for discovering why articles on TMS so frequently refer to Michael Faraday without providing a reference for his original discovery.
References
- Albright T.O. Form-cue invariant motion processing in primate visual cortex. Science. 1992;255:1141–1143. doi: 10.1126/science.1546317. [DOI] [PubMed] [Google Scholar]
- Amassian V.E, Cracco R.Q, Maccabee P.J, Cracco J.B, Rudell A.P, Eberle L. Suppression of visual perception by magnetic coil stimulation of human occipital cortex. Electroencephalogr. Clin. Neurophysiol. 1989;74:458–462. doi: 10.1016/0168-5597(89)90036-1. [DOI] [PubMed] [Google Scholar]
- Amassian V.E, Cracco R.Q, Maccabee P.J, Cracco J.B, Rudell A.P, Eberle L. Unmasking human visual perception with the magnetic coil and its relationship to hemispheric asymmetry. Brain Res. 1993;605:312–316. doi: 10.1016/0006-8993(93)91757-j. [DOI] [PubMed] [Google Scholar]
- Ashbridge E, Walsh V, Cowey A. Temporal aspects of visual search studied by transcranial magnetic stimulation. Neuropsychologia. 1997;35:1121–1131. doi: 10.1016/s0028-3932(97)00003-1. [DOI] [PubMed] [Google Scholar]
- Barbur J.L, Watson J.D, Frackowiak R.S.J, Zeki S. Conscious visual perception without V1. Brain. 1993;116:1293–1302. doi: 10.1093/brain/116.6.1293. [DOI] [PubMed] [Google Scholar]
- Barker A.T. The history and basic principles of magnetic nerve stimulation. Electroencephalogr. Clin. Neurophysiol. Suppl. 1999;51:3–21. [PubMed] [Google Scholar]
- Barker A.T, Jalinous R, Freeston I.L. Non-invasive magnetic stimulation of the human motor cortex. Lancet. 1985;1:1106–1107. doi: 10.1016/s0140-6736(85)92413-4. [DOI] [PubMed] [Google Scholar]
- Bjoertomt O, Cowey A, Walsh V. Spatial neglect in near and far space investigated by repetitive transcranial magnetic stimulation. Brain. 2002;125:2012–2022. doi: 10.1093/brain/awf211. [DOI] [PubMed] [Google Scholar]
- Boulton I.C, Baker C.L. Different parameters control motion perception above and below a critical density. Vis. Res. 1993;33:1803–1811. doi: 10.1016/0042-6989(93)90171-r. [DOI] [PubMed] [Google Scholar]
- Brindley G.S, Lewin W.S. The sensations produced by electrical stimulation of the visual cortex. J. Physiol. 1968;196:479–493. doi: 10.1113/jphysiol.1968.sp008519. [DOI] [PMC free article] [PubMed] [Google Scholar]
- Campana G, Cowey A, Walsh V. Priming of motion direction and area V5/MT: a test of perceptual memory. Cereb. Cortex. 2002;12:663–669. doi: 10.1093/cercor/12.6.663. [DOI] [PubMed] [Google Scholar]
- Chubb C, Sperling G. Drift-balanced random stimuli: a general basis for studying non-Fourier motion perception. J. Opt. Soc. Am. A. 1988;5:1986–2007. doi: 10.1364/josaa.5.001986. [DOI] [PubMed] [Google Scholar]
- Clifford W.G.C, Vaina L.M. A computational model of selective deficits in first-order and second-order motion processing. Vis. Res. 1999;39:113–130. doi: 10.1016/s0042-6989(98)00082-0. [DOI] [PubMed] [Google Scholar]
- Corthout E, Uttl B, Walsh V, Hallett M, Cowey A. Timing of activity in early visual cortex as revealed by transcranial magnetic stimulation. NeuroReport. 1999a;10:2631–2634. doi: 10.1097/00001756-199908200-00035. [DOI] [PubMed] [Google Scholar]
- Corthout E, Uttl B, Ziemann U, Cowey A, Hallett M. Two periods of processing in the (circum)striate visual cortex as revealed by transcranial magnetic stimulation. Neuropsychologia. 1999b;37:137–145. doi: 10.1016/s0028-3932(98)00088-8. [DOI] [PubMed] [Google Scholar]
- Corthout E, Uttl B, Chi-Hung J, Hallett M, Cowey A. Suppression of vision by transcranial magnetic stimulation: a third mechanism. NeuroReport. 2000;11:2345–2349. doi: 10.1097/00001756-200008030-00003. [DOI] [PubMed] [Google Scholar]
- Corthout E, Hallett M, Cowey A. Early visual cortical processing suggested by transcranial magnetic stimulation. NeuroReport. 2002;13:1163–1166. doi: 10.1097/00001756-200207020-00018. [DOI] [PubMed] [Google Scholar]
- Corthout E, Hallett M, Cowey A. Interference with vision by TMS over the occipital pole: a fourth period. NeuroReport. 2003;14:651–655. doi: 10.1097/00001756-200303240-00026. [DOI] [PubMed] [Google Scholar]
- Cowey A. Fact, artefact and myth about blindsight. Q. J. Exp. Psychol. A. 2004;57:577–609. doi: 10.1080/02724980343000882. [DOI] [PubMed] [Google Scholar]
- Cowey A, Walsh V. Magnetically induced phosphenes in sighted, blind and blindsighted observers. NeuroReport. 2000;11:3269–3273. doi: 10.1097/00001756-200009280-00044. [DOI] [PubMed] [Google Scholar]
- Cowey A, Walsh V. Tickling the brain: studying visual sensation, perception and cognition by transcranial magnetic stimulation. Prog. Brain Res. 2001;134:411–425. doi: 10.1016/s0079-6123(01)34027-x. [DOI] [PubMed] [Google Scholar]
- Cowey A, Small M, Ellis S. No abrupt change in visual hemineglect from near to far space. Neuropsychologia. 1999;37:1–6. doi: 10.1016/s0028-3932(98)00071-2. [DOI] [PubMed] [Google Scholar]
- d'Arsonval A. Dispositifs pour la mesure des courants alternatifs de toutes frequences. C. R. Soc. Biol (Paris) 1896;3:450–457. [Google Scholar]
- Dumoulin S.O, Baker C.L, Hess R.F, Evans A.C. Cortical specialization for processing first- and second-order motion. Cereb. Cortex. 2003;13:1375–1385. doi: 10.1093/cercor/bhg085. [DOI] [PubMed] [Google Scholar]
- Dupont P, Sary G, Peuskens H, Orban G.A. Cerebral regions processing first- and higher-order motion in an opposed-direction discrimination task. Eur. J. Neurosci. 2003;17:1509–1517. doi: 10.1046/j.1460-9568.2003.02571.x. [DOI] [PubMed] [Google Scholar]
- Epstein C.M, Woodard J.L, Stringer A.Y, Bakay R.A.E, Henry T.R, Pennell P.B, Litt B. Repetitive transcranial magnetic stimulation does not replicate the Wada test. Neurology. 2000;55:1025–1027. doi: 10.1212/wnl.55.7.1025. [DOI] [PubMed] [Google Scholar]
- Faraday M. Richard and John Edward Taylor; London: 1839. Experimental researches in electricity. [Google Scholar]
- Farah M, Wallace M, Vecera S.P. “What” and “where” in visual attention: evidence from the neglect syndrome. In: Robertson I.H, Marshall J.C, editors. Unilateral neglect: clinical and experimental studies. Erlbaum; Hillsdale, NJ: 1993. [Google Scholar]
- Ferrier D. Experimental researches in cerebral physiology and pathology. West Riding Lunatic Asylum Med. Rep. 1873;4:30–62. doi: 10.1136/bmj.1.643.457. [DOI] [PMC free article] [PubMed] [Google Scholar]
- Ferrier D. Smith, Elder; London: 1886. The functions of the brain. [Google Scholar]
- Flourens M.-J.-P. 2nd edn. J.-B. Ballière; Paris: 1842. Recherches expérimentales sur les propriétés et les fonctions du système nerveux dans les animaux vertébrés. (1st edn. 1842.) [Google Scholar]
- Fritsch G.T, Hitzig E. Über die elektrische Erregbarkeit des Grosshirns. Arch. Anat. Physiol. Med. Wiss. 1870:300–332. (Transl. von Bonin, G. 1960 Some papers on the Cerebral Cortex. Springfield, IL: Charles C. Thomas.) [Google Scholar]
- Goltz F. Über die Verrichtungen des Grosshirns. Pflügers Archiv für die gessamte Physiologie. 1888;42:419–467. (Translated in: von Bonin, G. 1960 Some papers on the cerebral cortex, pp. 118–158. Springfield, IL: Charles C Thomas.) [Google Scholar]
- Halligan P.W, Marshall J.C. Left neglect for near but not far space in man. Nature. 1991;350:498–500. doi: 10.1038/350498a0. [DOI] [PubMed] [Google Scholar]
- Holmes G. Disturbances of vision by cerebral lesions. Br. J. Ophthalmol. 1918;2:353–384. doi: 10.1136/bjo.2.7.353. [DOI] [PMC free article] [PubMed] [Google Scholar]
- Johansen-Berg H, Rushworth M.F, Bogdanovich M.D, Kischka U, Wimalaratna S, Matthews P.M. The role of ipsilateral premotor cortex in hand movement after stroke. Proc. Natl Acad. Sci. USA. 2002;99:14 518–14 523. doi: 10.1073/pnas.222536799. [DOI] [PMC free article] [PubMed] [Google Scholar]
- Kammer T. Phosphenes and transient scotomas induced by magnetic stimulation of the occipital lobe: their topographic relationship. Neuropsychologia. 1999;37:191–199. doi: 10.1016/s0028-3932(98)00093-1. [DOI] [PubMed] [Google Scholar]
- Kammer T, Klaas P, Erb M, Grodd W. Transcranial magnetic stimulation in the visual system II. Characterization of induced phosphenes and scotomas. Exp. Brain Res. 2005a;160:129–140. doi: 10.1007/s00221-004-1992-0. [DOI] [PubMed] [Google Scholar]
- Kammer T, Klaas P, Strasburgr H, Hill N.J, Wichman F.A. Transcranial magnetic stimulation in the visual system. I. The psychophysics of visual suppression. Exp. Brain Res. 2005b;160:118–128. doi: 10.1007/s00221-004-1991-1. [DOI] [PubMed] [Google Scholar]
- Klimesch W. EEG alpha and theta oscillations reflect cognitive and memory performance: a review and analysis. Brain Res. Rev. 1999;29:169–195. doi: 10.1016/s0165-0173(98)00056-3. [DOI] [PubMed] [Google Scholar]
- Klimesch W, Sauseng P, Gerloff G. Enhancing cognitive performance with repetitive transcranial magnetic stimulation and human individual alpha frequency. Eur. J. Neurosci. 2003;17:1129–1133. doi: 10.1046/j.1460-9568.2003.02517.x. [DOI] [PubMed] [Google Scholar]
- Lorberbaum J.P, Wassermann E.M. Safety concerns of TMS. In: George M.S, Bellmaker R.H, editors. Transcranial Magnetic stimulation in Psychiatry. American Psychiatric Press; Washington, DC: 2000. pp. 141–162. [Google Scholar]
- Magnussen S. Low level memory processes in vision. Trends Neurosci. 2000;23:247–251. doi: 10.1016/s0166-2236(00)01569-1. [DOI] [PubMed] [Google Scholar]
- Magnussen S, Greenlee M.W. The psychophysics of perceptual memory. Psychol. Res. 1999;62:81–92. doi: 10.1007/s004260050043. [DOI] [PubMed] [Google Scholar]
- Marangolo P, Di Pace E, Rafal R, Scabini D. Effects of parietal lesions in humans on color and location priming. J. Cogn. Neurosci. 1998;10:704–716. doi: 10.1162/089892998563112. [DOI] [PubMed] [Google Scholar]
- Moliadze V, Zhao Y, Eysel U, Funke K. Effect of transcranial magnetic stimulation on single unit activity in cat primary visual cortex. J. Physiol. 2003;553:665–679. doi: 10.1113/jphysiol.2003.050153. [DOI] [PMC free article] [PubMed] [Google Scholar]
- O'Keefe L.P, Movshon I.A. Processing of first- and second-order motion signals by neurons in area MT of the macaque monkey. Vis. Neurosci. 1996;15:305–317. doi: 10.1017/s0952523898152094. [DOI] [PubMed] [Google Scholar]
- O'Keefe L.P, Carandini M, Beusmans I.M.H, Movshon I.A. MT neuronal responses to 1st- and 2nd-order motion. Soc. Neurosci. Abstr. 1993;19:1283. [Google Scholar]
- Pascual-Leone A, Walsh V. Fast back-projections from the motion area to the primary visual area necessary for visual awareness. Science. 2001;292:510–512. doi: 10.1126/science.1057099. [DOI] [PubMed] [Google Scholar]
- Paus T, Sipila P.K, Strafella A.P. Synchronization of neuronal activity in the human primary motor cortex by transcranial magnetic stimulation: an EEG study. J. Neurophysiol. 2001;86:1983–1990. doi: 10.1152/jn.2001.86.4.1983. [DOI] [PubMed] [Google Scholar]
- Penfield W, Rasmussen T. Macmillan; New York: 1950. The cerebral cortex of man. [Google Scholar]
- Plant G.T, Laxer K.D, Barbaro N.M, Schiffman I.S, Nakayama K. Impaired visual motion perception in the contralateral hemifield following unilateral posterior cerebral lesions. Brain. 1993;116:1337–1353. doi: 10.1093/brain/116.6.1303. [DOI] [PubMed] [Google Scholar]
- Pöppel E, Frost D, Held R. Residual visual function after brain wounds involving the central visual pathways in man. Nature. 1973;243:295–296. doi: 10.1038/243295a0. [DOI] [PubMed] [Google Scholar]
- Rao, A., Nobre, A. C., Alexander I. & Cowey A. Submitted. Auditory evoked visual awareness in a late blind human subject—an electrophysiological investigation.
- Richter W, et al. Motor area activity during mental rotation studied by time-resolved single-trial fMRI. J. Cogn. Neurosci. 2000;12:310–320. doi: 10.1162/089892900562129. [DOI] [PubMed] [Google Scholar]
- Ruohonen J, Ilmoniemi R.J. Modeling of the stimulating field generation in TMS. Electroencephalogr. Clin. Neurophysiol. Suppl. 1999;51:30–40. [PubMed] [Google Scholar]
- Sherrington C.S. Sir David Ferrier. In: Weaver J.R.H, editor. Dictionary of national biography 1922–1930. Oxford University Press; London: 1937. pp. 302–304. [Google Scholar]
- Singer W. Synchronization of cortical activity and its putative role in information processing and learning. Annu. Rev. Physiol. 1993;55:349–374. doi: 10.1146/annurev.ph.55.030193.002025. [DOI] [PubMed] [Google Scholar]
- Stewart L.M, Walsh V, Rothwell J.C. Motor and phosphene thresholds: a TMS correlation study. Neuropschologia. 2001a;39:114–119. doi: 10.1016/s0028-3932(00)00130-5. [DOI] [PubMed] [Google Scholar]
- Stewart L, Walsh V, Frith U, Rothwell J.C. TMS produces two dissociable types of speech disruption. NeuroImage. 2001b;13:472–478. doi: 10.1006/nimg.2000.0701. [DOI] [PubMed] [Google Scholar]
- Stoerig P, Cowey A. Blindsight in man and monkey. Brain. 1997;120:535–559. doi: 10.1093/brain/120.3.535. [DOI] [PubMed] [Google Scholar]
- Taylor C.R, Gross C.G. Twitches versus movements: A story of motor cortex. Neuroscientist. 2003;9:1–11. doi: 10.1177/1073858403257037. [DOI] [PubMed] [Google Scholar]
- Thompson S.P. A physiological effect of an alternating magnetic field. Proc. R. Soc. B. 1910;82:396–399. [Google Scholar]
- Tulving E, Schacter D.L. Priming and human memory systems. Science. 1990;247:301–306. doi: 10.1126/science.2296719. [DOI] [PubMed] [Google Scholar]
- Ueno S, Tashiro T, Harada K. Localised stimulation of neural tissue in the brain by means of a paired configuration of time-varying magnetic fields. J. Appl. Phys. 1998;64:5862–5864. [Google Scholar]
- Vaina L.M, Cowey A. Impairment of the perception of second order motion but not first order motion in a patient with unilateral focal brain damage. Proc. R. Soc. B. 1996;263:1225–1232. doi: 10.1098/rspb.1996.0180. [DOI] [PubMed] [Google Scholar]
- Vaina L.M, Makris N, Kennedy D, Cowey A. The selective impairment of the perception of first-order motion by unilateral cortical brain damage. Vis. Neurosci. 1998;15:333–348. doi: 10.1017/s0952523898152082. [DOI] [PubMed] [Google Scholar]
- Vaina L.M, Cowey A, Kennedy D. Perception of first- and second-order motion: separable neurological mechanisms? Hum. Brain Mapp. 1999;7:67–77. doi: 10.1002/(SICI)1097-0193(1999)7:1<67::AID-HBM6>3.0.CO;2-K. [DOI] [PMC free article] [PubMed] [Google Scholar]
- Vaina L.M, Solomon J, Chowdhury S, Sinha P, Belliveau J.W. Functional neuroanatomy of biological motion perception in humans. Proc. Natl Acad. Sci. USA. 2001;98:11 656–11 661. doi: 10.1073/pnas.191374198. [DOI] [PMC free article] [PubMed] [Google Scholar]
- Walsh V, Cowey A. Magnetic stimulation studies of visual cognition. Trends Cogn. Neurosci. 1998;2:103–110. doi: 10.1016/s1364-6613(98)01134-6. [DOI] [PubMed] [Google Scholar]
- Walsh V, Cowey A. Transcranial magnetic stimulation and cognitive neuroscience. Nature Rev. Neurosci. 2000;1:73–79. doi: 10.1038/35036239. [DOI] [PubMed] [Google Scholar]
- Walsh V, Pascual-Leone A. MIT Press; Cambridge, MA: 2003. Transcranial magnetic stimulation: a neurochronometrics of mind. [Google Scholar]
- Walsh V, Le Mare C, Blaimire A, Cowey A. Normal discrimination performance accompanied by priming deficits in monkeys with V4 or TEO lesions. NeuroReport. 2000;11:1459–1462. [PubMed] [Google Scholar]
- Wassermann E.M. Risk and safety of repetitive transcranial magnetic stimulation report and recommendations from the International Workshop on the Safety of Repetitive Transcranial Magnetic Stimulation, June 5–7, 1996. Electroencephalogr. Clin. Neurophysiol. 1998;108:1–16. doi: 10.1016/s0168-5597(97)00096-8. [DOI] [PubMed] [Google Scholar]
- Wassermann E.M, Cohen L.G, Flitman S.S, Chen R, Hallett M. Seizures in healthy people with repeated ‘safe’ trains of transcranial magnetic stimuli. Lancet. 1996;347:825–826. doi: 10.1016/s0140-6736(96)90898-3. [DOI] [PubMed] [Google Scholar]
- Weiskrantz L. Blindsight. In: Ehrmann M.B, editor. Handbook of neuropsychology. 2nd edn. vol. 4. Elsevier Science; Amsterdam: 2001. pp. 215–237. [Google Scholar]
- Weiskrantz L, Warrington E.K, Sanders M.D, Marshall J. Visual capacity in the hemianopic field following a restricted occipital ablation. Brain. 1974;97:708–728. doi: 10.1093/brain/97.1.709. [DOI] [PubMed] [Google Scholar]
- Wilson H.R, Ferrera V.P, Yo C. A psychophysically motivated model for two-dimensional motion perception. Vis. Neurosci. 1992;9:79–97. doi: 10.1017/s0952523800006386. [DOI] [PubMed] [Google Scholar]
- Zhou Y.-X, Baker C.L.B., Jr A processing stream in mammalian visual cortex neurons for non-Fourier responses. Science. 1993;261:98–101. doi: 10.1126/science.8316862. [DOI] [PubMed] [Google Scholar]