

Abstract
The coalescent with recombination describes the distribution of genealogical histories and resulting patterns of genetic variation in samples of DNA sequences from natural populations. However, using the model as the basis for inference is currently severely restricted by the computational challenge of estimating the likelihood. We discuss why the coalescent with recombination is so challenging to work with and explore whether simpler models, under which inference is more tractable, may prove useful for genealogy-based inference. We introduce a simplification of the coalescent process in which coalescence between lineages with no overlapping ancestral material is banned. The resulting process has a simple Markovian structure when generating genealogies sequentially along a sequence, yet has very similar properties to the full model, both in terms of describing patterns of genetic variation and as the basis for statistical inference.
Keywords: coalescent, recombination, linkage disequilibrium, genealogy
1. Introduction
The coalescent with recombination describes the distribution of genealogies underlying samples of chromosomes from unrelated individuals in idealized natural populations (Hudson 1983; Griffiths & Marjoram 1996). Starting from the present and looking back in time, the ancestral lineages relating to the sampled chromosomes are traced until coalescence (where two ancestral lineages meet in a common ancestor) or recombination (where an ancestral lineage splits in two). The resulting ancestral recombination graph (ARG) has embedded within it the marginal genealogy (or phylogenetic tree describing the ancestry of the chromosomes) at any position along the sequence and, by mapping mutations on to the graph, describes patterns of genetic variation in the sampled chromosomes. Under models with constant population size and random mating, two parameters determine the distribution of variation: the population mutation rate θ=4Neμ (where Ne is the effective population size and μ is the per generation mutation rate); and the population recombination rate ρ=4Ner (where r is the per generation recombination rate).
Stochastic simulation under the model (backwards in time starting from the present) is computationally straightforward because at any point in time the rates of coalescence and recombination are simple functions of the ancestral lineages present (i.e. it has a Markovian structure; Hudson 1983). In contrast, the alternative approach of simulating genealogies while moving along a sequence (Wiuf & Hein 1999) has a complex non-Markovian structure in that the distribution of the next genealogy depends not just on the current genealogy, but also all previous ones. Both approaches, however, can make use of the separation of the genealogical and mutational processes under neutrality (Hudson 1990). Consequently, the ARG may be generated first with mutations subsequently added to the marginal genealogies as a Poisson process.
Efficient inference under the coalescent with recombination is notoriously difficult (Stumpf & McVean 2003). For example, moment estimation of ρ can be achieved by comparing the sample variance in pairwise differences to the expectation under neutrality (using a point estimate of θ; Hudson 1987; Wakeley 1997), but the estimator uses only a fraction of the available information about recombination and is both biased and has high variance (Wall 2000).
In contrast, likelihood-based inference (which uses all possible information) is currently restricted because there exists no analytic or numerical expression for the likelihood function and the construction of efficient Monte Carlo methods for estimating the likelihood is technically challenging. Naively, the likelihood could be estimated by simulating ARGs from the coalescent distribution given ρ, adding mutations to the ARGs from the distribution given by θ and looking to see if the simulated data matched the data observed. By repeating many times under different values of θ and ρ, maximum likelihood estimates of the statistic could be obtained. In practice, the naive approach is infeasible because the vast majority of ARGs contribute nothing to the likelihood. Consequently, sophisticated Monte Carlo methods such as importance sampling (IS; Fearnhead & Donnelly 2001) and Markov Chain Monte Carlo (MCMC; Kuhner et al. 2000; Nielsen 2000) must be used (reviewed in Stumpf & McVean 2003), which create bias towards the simulation of ARGs that make significant contributions to the likelihood.
To date, while Monte Carlo methods can be used to calculate likelihoods for very simple datasets, they are still impractical for most datasets currently being collected. Instead, three alternative approaches to coalescent-based inference have been explored. First, it is possible to calculate the likelihood of a summary of the data, rather than the data itself. For example, Wall (2000) suggested estimating ρ by calculating the likelihood of observing the number of haplotypes (H) and the minimum number of recombination events (Rm) as estimated by the method of Hudson & Kaplan (1985). Importantly, this likelihood may be calculated by naive simulation, potentially aided by regression techniques (Beaumont et al. 2002). The second approach is to divide the complete data into smaller subsets (pairs of segregating sites; Hudson 2001; McVean et al. 2002 or non-overlapping windows Fearnhead & Donnelly 2002), the likelihood of which can be calculated using IS or even naive methods. Combining likelihood calculations across subsets can give accurate estimates (Wall 2000), and can be used to estimate variation in the recombination rate (McVean et al. 2004), but the resulting likelihoods do not have standard properties (e.g. be used to calculate support intervals).
The third approach is to simplify or approximate the coalescent model itself. Building on research into optimal IS proposal distributions, Stephens & Li (2003) proposed a new statistical model for genetic data with recombination that generates patterns of genetic variation similar to the coalescent, but uses an approximation to the genealogical process. Importantly, the approximation means that likelihoods are easy to compute (referred to as product of approximate conditional, or PAC likelihoods), hence the approach generates a true likelihood.
The disadvantage of approximating the coalescent model is that the biological validity of the approximation may be poor. In the PAC approach, chromosomes are no longer exchangeable (i.e. the likelihood depends on the order in which chromosomes are analysed), and the estimated recombination parameter can only be related to that of the coalescent through an empirical bias correction. Even more importantly, the coalescent approximation does not correspond to any well defined genealogical process, so that no inferences can be made about the ancestral history of the sample (e.g. the marginal genealogy at a given position).
The potential advantages of developing tractable alternative models to the coalescent, combined with the disadvantages of the PAC model, stimulate the search for other possible approximations to the coalescent process. However, such a search should be motivated both by an appreciation of what makes the coalescent with recombination so difficult a model under which to perform inference, and how to assess the merit of alternative models for sequence variation data. Here, we focus on one aspect of the coalescent with recombination that makes inference difficult: the sequentially non-Markovian behaviour of the coalescent model. Our approach is to introduce a simplification of the standard coalescent process (called the sequentially Markov coalescent or SMC) that loses this aspect of model complexity, and to compare its properties with the full model. We show that the model differs only marginally from the standard model in terms of the predicted patterns of genetic variation and suggest that it may provide both a tractable and useful model for genealogy-based inference.
2. What is difficult about the coalescent with recombination?
Before considering novel approximations to the coalescent with recombination it is necessary to appreciate why the basic model is so difficult to estimate likelihoods under. There are three important and inter-related issues.
The state-space of ARGs is huge.
The data are generally not very informative about the actual ARG.
Likelihood estimation is a missing-data problem with highly redundant augmentation.
The state-space of ARGs is huge because the number of recombination events is unbounded and when the rate of recombination is high, most coalescent events will be between lineages that have no overlapping ancestral material and which will rapidly get broken up by further recombination. However, the size of the state space in itself does not make the problem of likelihood calculation difficult. More importantly, unless the ratio of mutation to recombination is very high, there is generally little information about the true genealogy underlying the sample at any point. This means that the likelihood function will not be dominated by any single ARG, so that efficient sampling of diverse contributing ARGs is required.
The last issue needs more explanation. Inference under the coalescent with recombination is an example of a missing data problem: if the true ARG were known, calculating the data likelihood would be trivial, hence summing over possible ARGs is achieved by successively augmenting the data with potential ones. However, the data likelihood is actually only dependent on the set of marginal genealogies embedded within the ARG, and every set of marginal genealogies corresponds to an infinite set of ARGs. In effect, the coalescent with recombination provides an indirect model for the set of marginal genealogies underlying a sample of chromosomes. The problem is that there is no direct way of calculating the coalescent likelihood from a set of marginal genealogies (i.e. integrating over the possible ARGs that could have given the set of marginal genealogies). As a result, inference methods are based on augmenting with the more complex and potentially redundant ARGs (redundant in the sense that two ARGs with identical marginal genealogies may have very different likelihoods).
The coalescent is, of course, just one possible model for the set of marginal genealogies (albeit based on an appreciation of reproduction in natural populations). In the following section we develop the idea that alternative models might be worth considering if they both prove easier for inference and have properties similar to the coalescent. In particular, we introduce a simplification of the coalescent that generates sets of marginal genealogies with a similar correlation structure to the coalescent but has both a much-reduced state-space and a direct way of calculating the coalescent likelihood for a set of marginal genealogies.
3. The sequentially Markov coalescent
We first describe a generalization of the standard coalescent process for a constant population size. At any point in time the state of the coalescent process is described by the set of k ancestral lineages, the ith of which contains ancestral material at a set of mi ordered non-overlapping intervals on the unit interval (treating sequences as continuous)
| (3.1) |
where xij and yij represent the lower and upper limits respectively of an interval of ancestral material. The instantaneous rate of coalescence is the sum of the rates for all pairs of lineages that can potentially coalesce (note each pair coalesces independently)
| (3.2) |
where Iij=1 under the standard coalescent for all i and j (i≠j). The instantaneous rate of recombination is
| (3.3) |
The time until the next event is distributed as a random exponential variable with rate λC+λR, with the type of event being drawn in proportion to its contribution to the summed rates. If a coalescent event is chosen, the resulting lineage acquires the union of the intervals of ancestral material. After coalescence, if any interval is represented by just one ancestral lineage the most recent common ancestor (MRCA) of that interval has been reached and the interval is removed. Recombination events result in a splitting of ancestral material, where the point of splitting is chosen uniformly from the interval for a constant recombination rate. The process for a sample of size n is initialized by setting k=n and mi=1, xi1=0, yi1=1 for all i and terminated when every point along the sequence has found an MRCA.
The SMC process requires a simple modification to the process. If Xi(=∪xi) is the set of all loci at which chromosome i has ancestral material
In other words, if two ancestral lineages have no interval in common where they share ancestral material they are not allowed to coalesce.
By restricting coalescent events in this way the resulting process has three important differences from the standard coalescent. First, the state-space of ARGs is much reduced (though the state-space of the set of marginal genealogies is unaltered). Second, the SMC model will tend to have many fewer recombination events in its history (figure 1). Third, the resulting process has a Markovian structure in the sequential generation of genealogies along a chromosome.
Figure 1.

The ratio of the average number of recombination events in the ARG for the standard coalescent to the average number of recombination events in the SMC model for n=2. The average number of recombination events in the SMC is equal to ρ.
The Markovian structure along a chromosome is best described in terms of the sequential algorithm for simulating a set of marginal genealogies on the unit interval for n sequences under the SMC model (figure 2). The algorithm can be described through a series of steps.
Simulate a standard coalescent history at point 0 (i.e. without recombination). The resulting tree has a total branch length of T0.
The distance along the unit interval until the first recombination event is exponentially distributed with rate ρT0/2. If the point at which the recombination event occurs is less than one, the position at which the recombination occurs on the marginal genealogy is drawn uniformly and the older portion of the branch on which the event occurred is erased, resulting in a ‘floating’ lineage.
The floating lineage coalesces with the remaining genealogy at rate proportional to the number of ancestral lineages present (note that the time at which it rejoins may be older than the current time of the MRCA or TMRCA). Note also that this is the point of departure from the standard coalescent, where the floating lineage may coalesce with all ancestral lineages, not just those remaining on the previous genealogy.
The previous genealogy is discarded and the process repeated with the new genealogy until the next recombination event occurs beyond the unit interval.
Figure 2.
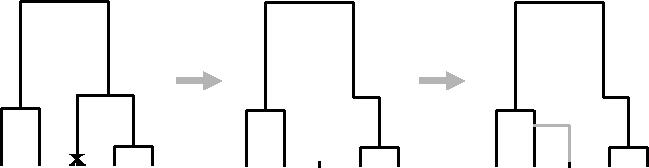
The sequentially Markov coalescent with recombination. The point of the recombination event (indicated by a crossmark) is placed uniformly on the tree. The branch above it is removed and the lineage coalesces back to the remaining tree at a rate proportional to the number of lineages present.
The backwards-in-time and sequential formulations lead to the same distribution on marginal genealogies because restricting coalescence to lineages that have overlapping ancestral material is equivalent to only allowing the floating lineage to coalesce to the remaining part of the previous genealogy. There is a slight difference between the processes in that recombination events in non-ancestral material can occur in the backwards-in-time process (when a site has reached its MRCA but the neighbouring sites have not), which are equivalent to recombination events on the stalk of the marginal genealogy. However, such events have no influence on the distribution of marginal genealogies.
4. Properties of the sequentially Markov model
The point of introducing the modified coalescent process is that while it has a similar structure to the standard process (and is therefore a reasonable model for patterns of genetic variation), the reduced state-space and sequentially Markovian structure may make inference considerably easier compared with the full coalescent. For example, estimation of likelihoods using the backwards-in-time IS scheme of Fearnhead & Donnelly (2001) may be more efficient because fewer events need to be considered at each step and fewer recombination events will occur in the history of the sequences. In addition, the Markovian sequential nature allows for efficient calculation of the coalescent likelihood for a set of marginal genealogies, which enables the use of MCMC methods in which marginal genealogies are updated locally.
However, the adequacy of the model as compared with the full coalescent process will depend on how much the restrictions to the ancestral process influence patterns of variation. To address this question, we have considered three properties of the original and modified coalescent processes. First, we assess the importance of the non-Markovian structure of marginal genealogies under the standard coalescent. Second, we compare expected patterns of linkage disequilibrium under the two models. Finally, we consider inference under both models, using a simple example with two sequences.
(a) Non-Markovian properties of the standard coalescent process
To quantify the importance of coalescent events between ancestral lineages that share no overlapping material (the events that generate a non-Markovian sequential algorithm) we consider two related probabilities. Q(x, ρ) is the probability (for a given value of ρ) that two unrelated sequences that share a single MRCA at points 0 and 1 have a different MRCA at an intervening point x. Q*(ρ) is the probability that two sequences that share a single MRCA at points 0 and 1 do not share one in at least one intervening interval. The probability, P(ρ), that a pair of sequences share a common ancestor at points 0 and 1 is (proof not shown)
| (4.1) |
Whereas Q(x, ρ) can be obtained numerically (equations not shown), Q*(ρ) can only be obtained by Monte Carlo simulation (we used 106 samples). Under the sequentially Markov process, Q(x, ρ)=Q*(ρ)=0, so the magnitude of these quantities determine the error in the sequentially Markov process.
Table 1 shows how these probabilities vary as a function of the recombination rate. While the probability that points 0 and 1 share an MRCA decreases monotonically, the conditional probabilities of having a different intervening MRCA peak at intermediate values of ρ. The non-Markovian behaviour is strongest for ρ≈10, where there is approximately a 12% chance of having a different intervening MRCA, conditional on the two end points sharing an MRCA. Note, however, that there is only an 11% chance of the two points sharing an MRCA at all, so the absolute probability of the non-Markovian event is less than 2%.
Table 1.
P(ρ), Q(0.5, ρ) and Q*(ρ) as a function of recombination rate.
| ρ | P(ρ) | Q(0.5, ρ) | Q*(ρ) |
|---|---|---|---|
| 0.1 | 0.937 | 0.0002 | 0.0003 |
| 1 | 0.594 | 0.012 | 0.023 |
| 2 | 0.417 | 0.029 | 0.054 |
| 5 | 0.213 | 0.066 | 0.106 |
| 10 | 0.113 | 0.087 | 0.123 |
| 20 | 0.056 | 0.087 | 0.112 |
| 50 | 0.021 | 0.060 | 0.065 |
| 100 | 0.010 | 0.037 | 0.045 |
(b) Linkage disequilibrium
We can also compare models in terms of the patterns of linkage disequilibrium (LD) generated. Specifically, we can compare the distribution of two-locus summaries of allelic association under the coalescent and sequentially Markov processes.
For two bi-allelic loci, the r2 measure of association (Hill & Robertson 1968) is the square of the correlation coefficient between allelic states. Although no simple expression for moments of the distribution of r2 can be derived, a related quantity is given by
| (4.2) |
where D is the standard disequilibrium coefficient and pi and qi are the allele frequencies at locus i (Ohta & Kimura 1971). By conditioning on segregation at both loci and letting the mutation rate tend to zero, McVean (2002) showed how equation (4.2) could be expressed in terms of the covariance in coalescence times at the two loci for different configurations of chromosomes
| (4.3) |
where Cij,kl is the covariance between the coalescence time for two sequences i and j sampled at the first locus, and two (possibly identical) sequences k and l sampled at the second locus. Expressions for the covariance terms under the coalescent can be derived by solving a system of linear equations. For the coalescent these give (Pluzhnikov & Donnelly 1996)
For the SMC we have to assume that all recombination is concentrated at a single point between the two sites. In this case the covariance terms are
The resulting values of σd2 under the two models are shown in figure 3. Preventing coalescent events between ancestral lineages that share no ancestral material only very slightly reduces linkage disequilibrium relative to the standard coalescent process. We have also investigated the difference in the distribution of r2 under the two models by Monte Carlo simulation (table 2; we used 106 samples with n=50, θ=0.05 per site and conditioning on segregation). The marginal reduction in r2 for a given value of ρ is also observable, though note that the expectation of r2 is considerably lower than the corresponding value of σd2 due to the covariance of allele frequency and LD statistics, an effect that can be countered by conditioning on mutations above a certain frequency (McVean 2002). Importantly, banning coalescent events between lineages that share no overlapping ancestral material does not seem to markedly reduce the variance of LD at any genetic distance.
Figure 3.

The decay of LD as a function of genetic distance (ρ) as approximated by σd2 under the standard coalescent process (black) and the sequentially Markov version (grey).
Table 2.
Mean and standard deviation of r2.
| 4Ner | coalescent | sequentially Markov |
|---|---|---|
| 0.1 | 0.200 (0.342) | 0.199 (0.340) |
| 1 | 0.146 (0.273) | 0.141 (0.265) |
| 10 | 0.059 (0.128) | 0.058 (0.128) |
| 100 | 0.027 (0.066) | 0.026 (0.065) |
(c) Inference
We have demonstrated that banning coalescent events between lineages that share no overlapping ancestral material has little notable effect on the distribution of two-locus statistics of LD. However, we have also shown that non-Markovian behaviour can have some effect on the distribution of genealogies, so it is not obvious that inferences made under the sequentially Markov process will be similar to those made under the full coalescent.
While a full exploration of inference under the sequentially Markov model is beyond the scope of this article, we can consider a simple example for two sequences. For simplicity we will assume a model in which recombination occurs at a finite number of equally spaced points. In our toy example we use 20 sites with single mutations in intervals 2, 3, 4, 5, 16, 17 and 18.
For inference we can calculate a likelihood surface for θ (per interval) and ρ (for the region) by naive Monte Carlo simulation. Figure 4 shows the joint log likelihood surface under the two models. The maximum likelihood estimates for θ and ρ are very similar under both models ( for both; for the coalescent and for the sequentially Markov process).
Figure 4.

Log likelihood surface for θ and ρ under the standard coalescent and sequentially Markov processes. Although the maximum likelihood estimates of both parameters are very similar under the two models, it should also be noted that the likelihood surfaces are very flat.
For the estimated parameter values, we can also calculate the posterior distributions of the number of recombination events between each pair of sites and the marginal TMRCAs (figure 5), using the MCMC method of Griffiths (1999). The distribution of the expected TMRCA along with sequences is almost identical under the standard coalescent and sequentially Markov processes. The distributions of the number of recombination events are also similar in shape, peaking in the regions with mutations. However, the expected number of recombination events under the coalescent is approximately twice as high as under the sequentially Markov process, because coalescence between lineages that share no overlapping ancestral material provide further opportunity for recombination. Note, however, that this does not lead to a large shift in the estimated recombination rate.
Figure 5.

Expected values of the number of recombination events and TMRCA at each position under the standard coalescent (black) and sequentially Markov processes (grey). Maximum likelihood estimates of θ and ρ were used for each. Open circles represent the position of the mutations in the sequences.
5. Discussion
The analysis of patterns of linkage disequilibrium using Wright–Fisher models has long history in populations genetics (Hill & Robertson 1968; Ohta & Kimura 1971; Hill 1975; Weir & Hill 1986). Of particular interest has been the extent to which variation in the extent of linkage disequilibrium along a chromosome reflects underlying variation in the recombination rate (Weir & Hill 1986; Crawford et al. 2004; Fearnhead et al. 2004; McVean et al. 2004). However, recent attempts to use the coalescent with recombination as a model for genetic variation have used approximations either to the likelihood function or the model itself, because estimating the likelihood function is computationally intractable for all but the smallest datasets.
The problem with the current methodologies is that while they may be useful for estimating the recombination rate, they do not explicitly model the ancestral history of set of sequences and hence cannot be used to estimate genealogies along a chromosome, or the ages of mutations and MRCAs. Knowing such quantities is of interest to many areas of population genetics (such as demographic inference and association mapping), which has generated our interest in developing genealogical models related to the coalescent under which inference may be easier.
There are many potential approaches to approximating the coalescent process so as to result in models that are easier for inference, but retain a notion of genealogy. The sequentially Markov process described might provide one such model, although further research is required into whether inference under the model is sufficiently more efficient than under the standard coalescent. More generally, we have shown that the exclusion of certain types of event in the coalescent with recombination (coalescence between lineages that share no overlapping ancestral material) results in a model for genealogical structure, genealogical correlation, and patterns of genetic variation that do not differ markedly from the standard model. It is therefore unlikely that inferences about genealogical history made under the sequentially Markov model will differ significantly than those made under the more complex model.
For most species, accurate reconstruction of evolutionary histories that include recombination (ARGs) is not possible (indeed it is theoretically impossible for recombination events that can never be detected; Wiuf et al. 2001; Myers & Griffiths 2003). Furthermore, when rates of recombination and mutation are comparable (as in humans), reliable reconstruction of the true genealogy at any given nucleotide position is an impractical aim. Conversely, estimating likelihoods by Monte Carlo methods that sum over possible ARGs given the data will always be difficult when the data are so uninformative. For these reasons, approximations to the coalescent with recombination are likely to be the only realistic route to genealogical inference from sequence variation in large datasets.
Acknowledgments
Many thanks to Chris Spencer, Brian Charlesworth and two anonymous referees for discussion and comments on the manuscript
Footnotes
One contribution of 16 to a Theme Issue ‘Population genetics, quantitative genetics and animal improvement: papers in honour of William (Bill) Hill’.
References
- Beaumont M.A, Zhang W, Balding D.J. Approximate Bayesian computation in population genetics. Genetics. 2002;162:2025–2035. doi: 10.1093/genetics/162.4.2025. [DOI] [PMC free article] [PubMed] [Google Scholar]
- Crawford D.C, Bhangale T, Li N, Hellenthal G, Rieder M.J, Nickerson D.A, Stephens M. Evidence for substantial fine-scale variation in recombination rates across the human genome. Nat. Genet. 2004;36:700–706. doi: 10.1038/ng1376. [DOI] [PubMed] [Google Scholar]
- Fearnhead P, Donnelly P.J. Estimating recombination rates from population genetic data. Genetics. 2001;159:1299–1318. doi: 10.1093/genetics/159.3.1299. [DOI] [PMC free article] [PubMed] [Google Scholar]
- Fearnhead P, Donnelly P. Approximate likelihood methods for estimating local recombination rates. J. R. Stat. Soc. B. 2002;64:1–24. [Google Scholar]
- Fearnhead P, Harding R.M, Schneider J.A, Myers S, Donnelly P. Application of coalescent methods to reveal fine-scale rate variation and recombination hotspots. Genetics. 2004;167:2067–2081. doi: 10.1534/genetics.103.021584. [DOI] [PMC free article] [PubMed] [Google Scholar]
- Griffiths R.C. The time to the ancestor along sequences with recombination. Theor. Popul. Biol. 1999;55:137–144. doi: 10.1006/tpbi.1998.1390. [DOI] [PubMed] [Google Scholar]
- Griffiths R.C, Marjoram P. An ancestral recombination graph. In: Donnelly P.J, Tavaré S, editors. IMA volume on mathematical population genetics. Springer; Berlin: 1996. pp. 257–270. [Google Scholar]
- Hill W.G. Linkage disequilibrium among multiple neutral alleles produced by mutation in a finite population. Theor. Popul. Biol. 1975;8:117–126. doi: 10.1016/0040-5809(75)90028-3. [DOI] [PubMed] [Google Scholar]
- Hill W.G, Robertson A.R. Linkage disequilibrium in finite populations. Theor. Appl. Genet. 1968;38:226–231. doi: 10.1007/BF01245622. [DOI] [PubMed] [Google Scholar]
- Hudson R.R. Properties of a neutral allele model with intragenic recombination. Theor. Popul. Biol. 1983;23:183–201. doi: 10.1016/0040-5809(83)90013-8. [DOI] [PubMed] [Google Scholar]
- Hudson R.R. Estimating the recombination parameter of a finite population model without selection. Genet. Res. 1987;50:245–250. doi: 10.1017/s0016672300023776. [DOI] [PubMed] [Google Scholar]
- Hudson R.R. Gene genealogies and the coalescent process. In: Futuyama D, Antonovics J, editors. Oxford surveys in evolutionary biology. vol. 7. Oxford University Press; New York: 1990. pp. 1–44. [Google Scholar]
- Hudson R.R. Two-locus sampling distributions and their application. Genetics. 2001;159:1805–1817. doi: 10.1093/genetics/159.4.1805. [DOI] [PMC free article] [PubMed] [Google Scholar]
- Hudson R.R, Kaplan N. Statistical properties of the number of recombination events in the history of a sample of DNA sequences. Genetics. 1985;111:147–164. doi: 10.1093/genetics/111.1.147. [DOI] [PMC free article] [PubMed] [Google Scholar]
- Kuhner M.K, Beerli P, Yamato J, Felsenstein J. Usefulness of single nucleotide polymorphism data for estimating population parameters. Genetics. 2000;156:439–447. doi: 10.1093/genetics/156.1.439. [DOI] [PMC free article] [PubMed] [Google Scholar]
- Li N, Stephens M. Modeling linkage disequilibrium and identifying recombination hotspots using single-nucleotide polymorphism data. Genetics. 2003;165:2213–2233. doi: 10.1093/genetics/165.4.2213. [DOI] [PMC free article] [PubMed] [Google Scholar]
- McVean G.A.T. A genealogical interpretation of linkage disequilibrium. Genetics. 2002;162:987–991. doi: 10.1093/genetics/162.2.987. [DOI] [PMC free article] [PubMed] [Google Scholar]
- McVean G, Awadalla P, Fearnhead P. A coalescent-based method for detecting and estimating recombination rates from gene sequences. Genetics. 2002;160:1231–1241. doi: 10.1093/genetics/160.3.1231. [DOI] [PMC free article] [PubMed] [Google Scholar]
- McVean G. A.T, Myers S, Hunt S, Deloukas P, Bentley D, Donnelly P. The fine-scale structure of recombination rate variation in the human genome. Science. 2004;304:581–584. doi: 10.1126/science.1092500. [DOI] [PubMed] [Google Scholar]
- Myers S.R, Griffiths R.C. Bounds on the minimum number of recombination events in a sample history. Genetics. 2003;163:375–394. doi: 10.1093/genetics/163.1.375. [DOI] [PMC free article] [PubMed] [Google Scholar]
- Nielsen R. Estimation of population parameters and recombination rates from single nucleotide polymorphisms. Genetics. 2000;154:931–942. doi: 10.1093/genetics/154.2.931. [DOI] [PMC free article] [PubMed] [Google Scholar]
- Ohta T, Kimura M. Linkage disequilibrium between two segregating nucleotide sites under the steady flux of mutations in a finite population. Genetics. 1971;68:571–580. doi: 10.1093/genetics/68.4.571. [DOI] [PMC free article] [PubMed] [Google Scholar]
- Pluzhnikov A, Donnelly P. Optimal sequencing strategies for surveying molecular genetic diversity. Genetics. 1996;144:1247–1262. doi: 10.1093/genetics/144.3.1247. [DOI] [PMC free article] [PubMed] [Google Scholar]
- Stumpf M.P.H, McVean G.A.T. Estimating recombination rates from population genetic data. Nat. Rev. Genet. 2003;4:959–968. doi: 10.1038/nrg1227. [DOI] [PubMed] [Google Scholar]
- Wakeley J. Using the variance of pairwise differences to estimate the recombination rate. Genet. Res. 1997;69:45–48. doi: 10.1017/s0016672396002571. [DOI] [PubMed] [Google Scholar]
- Wall J.D. A comparison of estimators of the population recombination rate. Mol. Biol. Evol. 2000;17:156–163. doi: 10.1093/oxfordjournals.molbev.a026228. [DOI] [PubMed] [Google Scholar]
- Weir B.S, Hill W.G. Nonuniform recombination within the human β-globin gene cluster. Am. J. Hum. Genet. 1986;38:776–778. [PMC free article] [PubMed] [Google Scholar]
- Wiuf C, Hein J. Recombination as a point process along sequences. Theor. Popul. Biol. 1999;55:248–259. doi: 10.1006/tpbi.1998.1403. [DOI] [PubMed] [Google Scholar]
- Wiuf C, Christensen T, Hein J. A simulation study of the reliability of recombination detection methods. Mol. Biol. Evol. 2001;18:1929–1939. doi: 10.1093/oxfordjournals.molbev.a003733. [DOI] [PubMed] [Google Scholar]