Abstract
Context: The return-to-play decision after sport-related cerebral concussion depends in part on knowing when an athlete has fully recovered postural control after injury.
Objective: To describe the postconcussion recovery of postural control using approximate entropy (ApEn), a regularity statistic from nonlinear dynamics.
Design: Retrospective case series analysis.
Setting: Sports medicine research laboratory.
Patients or Other Participants: Collegiate athletes from whom center-of-pressure and symptom data were collected at preseason, less than 48 hours after injury, and 48 to 96 hours after injury.
Main Outcome Measure(s): Approximate entropy values reflecting the amount of randomness contained in center-of-pressure oscillations were calculated for anterior-posterior (AP) and medial-lateral (ML) time series. Equilibrium scores reflecting the amplitude of center-of-pressure AP oscillations were used to indicate postural stability. The number and severity of symptoms were described.
Results: Compared with the healthy preseason state, ApEn values for the AP and ML time series generally declined immediately after injury in both steady and unsteady injured athletes. At 48 to 96 hours after injury, ApEn values for the ML time series remained significantly depressed (mean difference compared with preseason = −0.268, standard error = 0.072), even among athletes whose initial postural instability had resolved. We found few significant relationships between changes in ApEn values and changes in symptoms before and after injury.
Conclusions: The effects of cerebral concussion on postural control appear to persist for longer than 3 to 4 days, even among athletes with no signs of unsteadiness. Our results may reflect changes in neurophysiologic or mechanical constraints on postural control. Approximate entropy provides a theoretically distinct, valuable measurement alternative that may prove useful for reducing uncertainty in the return-to-play decision.
Keywords: cerebral concussion, nonlinear dynamics, measurement
Complete recovery of postural control after cerebral concussion is an important determinant of an athlete's readiness to return to competitive activity. On average, athletes who initially present with postural instability after concussion return to their baseline level of performance within 3 to 5 days of injury. 1–4 The return-to-play decision, however, is complicated by medical, social, and legal factors, 5 not the least of which is variable recovery rates among athletes. 4 Given the risk of recurrent brain injury associated with returning to competition too early, 6, 7 medical professionals are obligated to certify with confidence that an injured athlete has fully recovered. Variable recovery rates, combined with the challenge of objectively measuring subtle physiologic impairments, often make this task difficult and highlight the critical need for developing more sensitive clinical tools for assessment of complete recovery of postural control.
Postural control traditionally has been characterized according to a biomechanical framework as postural stability (ie, the ability to maintain a desired postural orientation in response to perturbations generated from either internal or external sources). Postural stability is commonly inferred from the amplitude of center-of-pressure (COP) displacements collected during postural steadiness testing, in which an athlete attempts to stand as still as possible, without external perturbation, while maintaining the vertical projection of the whole body center of gravity (CG) within the limits of the base of support defined by the feet. The COP is a compound signal that includes the position of the whole body CG, transformed by the multilinked system of the body to the support surface, as well as the muscle activity used to control equilibrium. 8 Larger-amplitude COP displacements imply greater motion of the whole body CG and greater muscle activity used to control equilibrium. Consistent with the traditional biomechanical view, this approach implicitly assumes that the task of postural control in upright standing is to center the body CG over the base of support as precisely as possible. 9 Changes in postural stability in athletes after cerebral concussion previously have been measured using a metric known as the equilibrium score in conjunction with the Sensory Organization Test (SOT). 2, 3, 10 The equilibrium score estimates the maximum anterior-posterior (AP) angular displacement of the whole body CG based on the range (amplitude) of COP AP displacement. 2, 3, 10 Higher equilibrium scores are derived from lower-amplitude COP displacement, thereby indicating greater postural stability.
Recent findings have raised the possibility that biomechanical measures of postural stability may not be capable of detecting subtle changes in postural control. Epidemiologic evidence, for example, indicates that postural instability after concussion, using a clinical biomechanical measure, appears to resolve more quickly, on average, than either neuropsychological function or symptoms. 4 Other evidence indicates that despite reporting concussion-related symptoms, not all athletes display reduced equilibrium scores (greater postural instability) after injury. 10 In response to this concern, we recently determined that approximate entropy (ApEn), a regularity statistic developed from nonlinear dynamics (see “Methods”), 11 could be used successfully to detect changes in the amount of randomness in COP oscillations collected using the SOT within 1 to 2 days after cerebral concussion from athletes determined to have normal postural stability. 12 In that study, COP oscillations of injured athletes, especially in the medial-lateral (ML) direction, were less random (had lower ApEn values) across sensory conditions than were preinjury levels. The finding provided preliminary evidence that ApEn shows promise as a sensitive indicator of change in postural control in the acute stage after concussion.
To continue this line of inquiry, we conducted the present investigation to re-examine the time course of postural control recovery after concussion. Using COP data collected from athletes with and without initial postural instability after injury, we compared ApEn values and equilibrium scores from each sensory condition of the SOT. 13 Based on previous research, 1–4 we expected that equilibrium scores would indicate that athletes with postural instability generally would display preseason-level performance by 3 to 4 days after injury. We questioned whether ApEn would produce an equivalent finding. Our secondary purpose was to determine the degree to which changes in ApEn values were associated with changes in concussion-related symptoms measured before and after injury. Larger declines in ApEn values and equilibrium scores were expected to reflect a greater influence of concussion on postural control. Based on our clinical experience, larger increases in symptom number or aggregate score were thought to reflect greater concussion severity. Thus, we speculated that changes in ApEn values and symptoms would be inversely related.
METHODS
Subjects
Subjects included 19 male and 10 female collegiate athletes who sustained concussions between 1997 and 2003 during practice or competition. Athletes were selected based on the availability of balance assessment data from 3 time intervals: preseason, within the first 48 hours after injury, and from 48 to 96 hours postinjury. Athletes ranged in age from 17 to 21 years (mean = 19.1 years), in height from 160 to 196 cm (mean = 179.5 cm), and in mass from 54.5 to 136.2 kg (mean = 84.4 kg). No athlete had sustained a previous concussion within the same season as the concussion under investigation. Eighteen athletes reported no lifetime history of concussion, whereas 5 athletes reported 1 previous injury, 2 athletes reported more than 1 previous injury, and 4 athletes gave no report. No athlete reported a lower limb musculoskeletal injury sustained either earlier in the season or at the time of concussion. Athletes participated in a variety of sports, including football (n = 12, 41%), soccer (n = 12, 41%), lacrosse (n = 4, 14%), and field hockey (n = 1, 3%). All athletes had been enrolled in a formal concussion surveillance protocol, were informed of the procedures and inherent risks of testing, and had read and signed a consent form in accordance with the University of North Carolina at Chapel Hill Academic Affairs Institutional Review Board, which approved the study.
Postural Control Assessment
We evaluated postural control using the Smart Balance Master System (NeuroCom International, Inc, Clackamas, OR). Software versions 6.0 through 8.0 were employed over the course of the data collection period. The system was equipped with a movable visual surround and support surface that could rotate in the AP plane. Two 9 × 18-in (22.9 × 45.7-cm) forceplates connected by a pin joint were used to collect COP coordinates at 100 Hz.
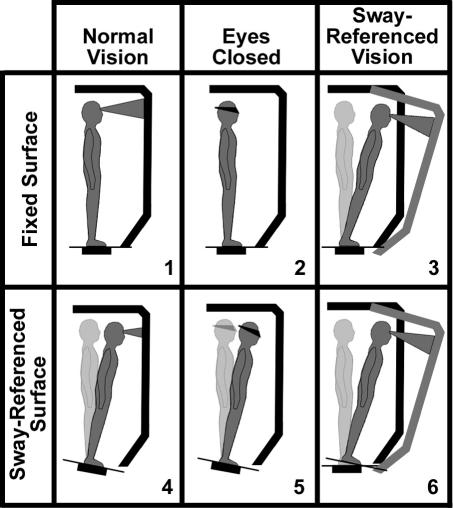
The SOT consists of 18 total trials, each lasting 20 seconds, in which subjects are instructed to stand with their arms relaxed at their sides, look straight ahead, and remain as still as possible without reaching out to touch the visual surround or taking a step. Subjects wear comfortable attire and are shoeless during testing. Foot placement is standardized based on each subject's height according to the manufacturer's protocol. The trials are conducted in 3 groups of 6 each. Each group contains 1 trial from a different sensory condition (Figure 1). In our protocol, the SOT required approximately 15 minutes to conduct. For the first group of trials, sensory conditions were presented in ascending order (1 to 6). For the second and third groups, sensory conditions were presented randomly.
Figure 1. Sensory Organization Test 6 conditions. Vision is absent in conditions 2 and 5. In conditions 3 and 6, the sway-referenced anterior-posterior angular motion of the surrounding wall reduces optic flow stimulation useful for the perception of self-motion relative to the visual field. In conditions 4 through 6, sway-referenced angular motion of the forceplates reduces somatosensory stimulation useful for the perception of anterior-posterior self-motion relative to the support surface. (Used by permission from NeuroCom International, Inc).
Symptom Assessment
A checklist of 17 symptoms commonly associated with concussion was read to subjects during each testing session. The list included headache, nausea, vomiting, dizziness, poor balance, sensitivity to noise or light (2 items), ringing in the ear, blurred vision, difficulty concentrating or remembering (2 items), trouble falling asleep, drowsiness, fatigue, sadness, irritability, and neck pain. At the preseason assessment, subjects were instructed to rate the severity of symptoms experienced more than 3 times per week. For the postinjury assessments, subjects were instructed to rate the severity of their current symptoms. Symptom severity was rated using a 7-point Likert scale, with 0 corresponding to none and 6 corresponding to severe. For each testing session, we generated 2 measures: the number of symptoms rated >0 and an aggregate total rating score. Of the 29 subjects selected for study, only 18 had symptom and postural steadiness data recorded for all 3 testing sessions.
Center-of-Pressure Data Reduction
We applied ApEn to examine the amount of randomness in each trial of collected COP data. The ApEn algorithm essentially determines the probability that short sequences of consecutive data points repeat, at least approximately, throughout a longer temporal sequence of points. Expressing the average probability in logarithmic form (and taking the inverse), ApEn generates a unitless real number that ranges from 0 to 2. 14 Zero values correspond to time series in which the sequences of data points are perfectly repeatable. A sine wave, for example, oscillates continuously in a repeatable and predictable fashion. Values of 2 correspond to time series for which any repeating sequences of points occur by chance alone (eg, white noise). Acute concussion previously has been associated with a decline in the randomness of COP oscillations, theoretically because injury constrains the output of the postural control system. 12
The exact ApEn mathematical algorithm has been published in great detail elsewhere. 11, 15 Using MATLAB software (The Mathworks Inc, Natick, MA), we calculated separate ApEn values for the AP and ML components of the COP coordinate time series derived from test trials. Each time series contained 2000 data points (100-Hz sampling frequency × 20 seconds). The algorithm requires the operator to enter both the length of the short sequence of data points and the error tolerance used in the calculation. The reliability of ApEn is optimal when input values, as well as the length of the entire time series, are identical for all subjects. 11 For our study, this requirement precluded the use of trials interrupted by a fall; thus, we calculated ApEn values for the first 2 trials from each SOT condition and used the third trial as a substitute for interrupted trials. Input variables for the ApEn calculation were (1) a series length (m) of 2 data points, (2) a tolerance window (r) normalized to 0.2 times the standard deviation of individual time series, and (3) a lag value of 10. 15, 16 This lag value was chosen to lower the effective sampling frequency of the algorithm from 100 Hz to 10 Hz, thereby reducing the influence of extraneous noise in the data. The ApEn values from individual trials were averaged for further analysis. According to accepted guidelines, 17 average ApEn values for COP time series collected during 2 trials of the SOT have demonstrated good to moderate between-session response stability for the AP (intraclass correlation coefficient [ICC] (2,2) range, 0.79– 0.90) and ML (ICC (2,2) range, 0.53–0.77) components of COP time series. 18
A surrogation (phase randomization) procedure was conducted as a preprocessing step to identify if the COP data were derived at least in part from a deterministic (nonrandom) source. This confirmation is a necessary component of nonlinear dynamics methods. 19 Surrogation involves shuffling the order of points in a time series to create a new “surrogate” time series, the randomness of which can then be compared with the original. We performed this procedure in MATLAB using algorithms developed by Theiler et al 20, 21 and Schiff et al. 22 Using the Student t test (α = .05), we found significant differences between the ApEn values for each original COP time series and its surrogate counterpart, indicating that the original data were not randomly derived.
An equilibrium score was generated for each trial in each sensory condition based on the algorithm developed for the Smart Balance System. 13 The algorithm uses the peak-to-peak amplitude of COP AP displacement to estimate the amount of postural sway in the sagittal plane. Scores are calculated as the angular difference, expressed as a percentage, between the amount of estimated AP postural sway and the theoretic limit of stability (approximately 12.5° in the AP plane). Greater postural stability results in smaller-amplitude COP displacement, thereby producing a higher equilibrium score. As with the ApEn values, we averaged equilibrium scores from the first and second trials from each sensory condition for further analysis. A separate composite equilibrium score was calculated by independently averaging all trial scores from conditions 1 and 2, adding these 2 average scores to the individual trial scores from conditions 3 through 6, and then dividing the sum by 14. 13
Data Analysis
Primary and secondary analyses were conducted using SPSS statistical software (version 10.0; SPSS Inc, Chicago, IL). Sample sizes for each analysis varied according to the availability of COP and symptom data. To compare COP randomness (ApEn) and amplitude (equilibrium score) recovery curves, subjects were separated into steady and unsteady groups, depending on whether or not they displayed evidence of postural instability within 48 hours after injury. Steady subjects had a composite equilibrium score that was no more than 5% below their preseason value. Accordingly, 16 subjects were classified as steady and 13 subjects as unsteady. We conducted a separate 2 × 3 × 6 (group × day × sensory condition) mixed-model analysis of variance for ApEn values and equilibrium scores. To accommodate any violations of the sphericity assumption, we relied on the more conservative Geisser-Greenhouse F test (α = .05). Degrees of freedom used for the corrected F test were not necessarily whole numbers. The Pearson product moment correlation ( r) was used to describe relationships between ApEn values and equilibrium scores.
To describe the relationship between changes in ApEn values and changes in concussion-related symptoms, we studied 18 athletes (11 males, 7 females) from whom COP and symptom data had been collected. We included both steady (n = 12) and unsteady (n = 6) subjects. Change scores from before to after injury were calculated for the number of symptoms, symptom aggregate score, ApEn values for AP and ML time series, and equilibrium scores. Relationships between COP changes and symptom changes were described using the Pearson product moment correlation coefficient ( r). Because of the small sample size, correlations were generated for subjects as a single group (n = 18).
RESULTS
All subjects completed the SOT battery in each of the 3 testing sessions. A total of 10 falls occurred in 8 subjects. All falls took place within 48 hours after injury. Nine of the 10 falls took place in condition 6, whereas 1 fall occurred in condition 5. Although the interrupted trials had been included in the calculation of composite equilibrium scores used to determine group membership, they could not be used for ApEn and individual trial equilibrium score calculations. Consequently, we substituted for 7 of 10 interrupted trials with intact trial 3 data. The remaining interrupted trials, however, occurred in subjects who also fell in trial 3. In these cases, we calculated ApEn values and equilibrium scores on a single intact trial only.
Comparing Center-of-Pressure Randomness and Amplitude Recovery Curves
Approximate Entropy Values for Center-of-Pressure Anterior-Posterior Time Series
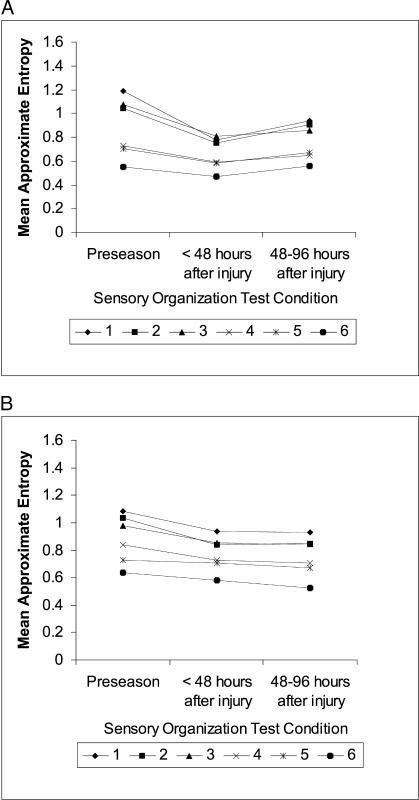
For both steady and unsteady subjects, ApEn values for the AP time series generally declined between preseason and within 48 hours postinjury in all SOT conditions. Changes occurring by 48 to 96 hours postinjury were variable, with ApEn values for unsteady subjects beginning to return to preseason levels (Figure 2). Despite this trend, group differences were negligible, as no interaction was noted between group and condition or group and day, and no main effect for group was seen. The only significant interaction was between day and condition (F3.2,86.5 = 2.96, P = .03), indicating that differences in ApEn values across days depended on SOT condition. Follow-up inspection of mean ApEn differences revealed that the change in ApEn values in sensory conditions 1 and 2 between preseason and within 48 hours postinjury was much larger (at least 3 times as large as the standard error of the mean) than for all other conditions (Table 1).
Figure 2. Mean approximate entropy values for center-of-pressure anterior-posterior time series in athletes (A) with (n = 13) and (B) without (n = 16) postural instability after concussion. Approximate entropy values are displayed for the 6 Sensory Organization Test conditions. Athletes were tested at preseason, within 48 hours after injury, and between 48 and 96 hours after injury. Lower scores reflect greater regularity of center-of-pressure oscillations.
Table 1. Mean Approximate Entropy Value Differences for Center-of-Pressure Anterior-Posterior Time Series Between Days*.
Approximate Entropy Values for Center-of-Pressure Medial-Lateral Time Series
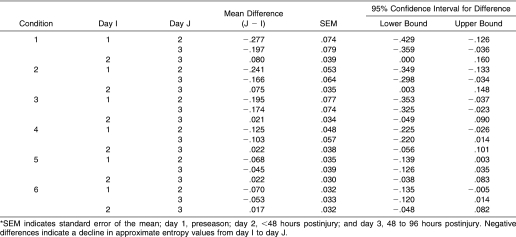
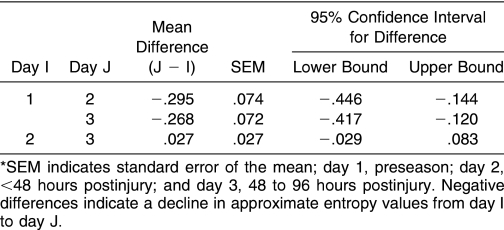
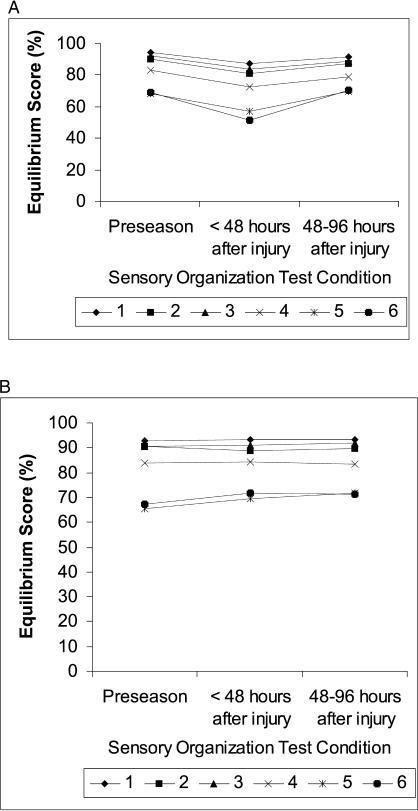
Compared with preseason values, values for the COP ML time series across all sensory conditions were markedly less random (lower ApEn values) within 48 hours after injury and remained less random at 48 to 96 hours postinjury (Figure 3). Main effects for day (F1.25,35 = 14.02,P < .01) and condition (F 3.6,101.6 = 16.1,P < .01) were significant but not for group. No interactions were significant. Follow-up inspection of mean ApEn differences between days revealed that the changes from preseason to within 48 hours postinjury and from preseason to 48 to 96 hours postinjury were approximately 3 to 4 times larger than the standard error of the mean (Table 2). Tukey Honestly Significant Difference analyses of the main effect of condition revealed that ApEn differences greater than 0.08 represented significant alterations in COP regularity. Using this criterion, we determined that ApEn values in SOT conditions 1 through 3 were significantly different than ApEn values in conditions 5 and 6.
Figure 3. Mean approximate entropy values for center-of-pressure medial-lateral time series in athletes (A) with (n = 13) and (B) without (n = 16) postural instability after concussion. Approximate entropy values are displayed for the 6 Sensory Organization Test conditions. Athletes were tested at preseason, within 48 hours after injury, and between 48 and 96 hours after injury. Lower scores reflect greater regularity of center-of-pressure oscillations.
Table 2. Mean Approximate Entropy Value Differences for Center-of-Pressure Medial-Lateral Time Series Between Days in Athletes After Cerebral Concussion*.
Sensory Organization Test Equilibrium Scores
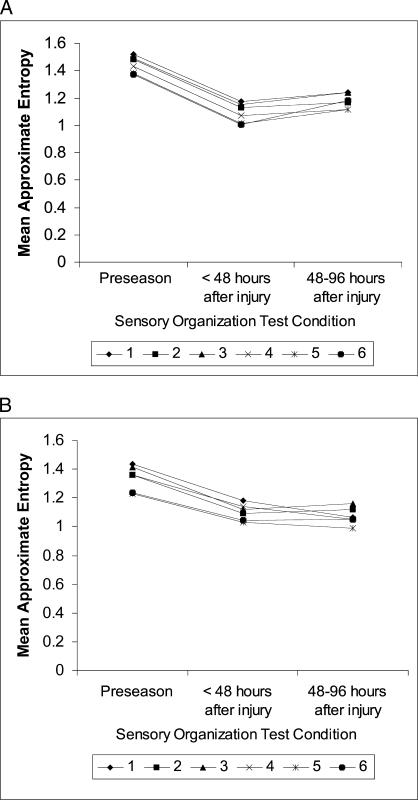
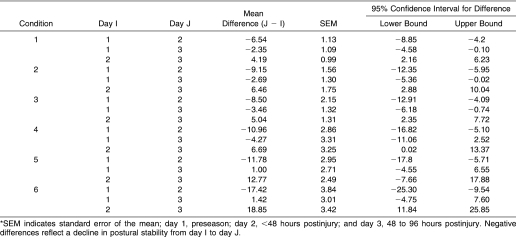
A significant 3-way interaction was seen among group, day, and SOT condition (F 5.4,147 = 3.0, P = .01), indicating that differences in equilibrium scores between days depended on group and SOT condition (Figure 4). For subjects with postural instability after concussion, scores were markedly diminished at 48 hours after injury in all SOT conditions (Table 3). The magnitude of this decline was generally greater than 4 times the standard error of the mean. During the same interval, scores for steady subjects remained relatively constant. At 48 to 96 hours postinjury, equilibrium scores for unsteady subjects across all conditions had returned to within 1 to 2 standard errors of the mean of preseason values.
Figure 4. Mean equilibrium scores in athletes (A) with (n = 13) and (B) without (n = 16) postural instability after concussion. Equilibrium scores are displayed for the 6 Sensory Organization Test conditions. Athletes were tested at preseason, within 48 hours after injury, and between 48 and 96 hours after injury. Lower scores reflect greater postural instability.
Table 3. Mean Equilibrium Score Differences Between Days in Subjects With Postural Instability After Injury*.
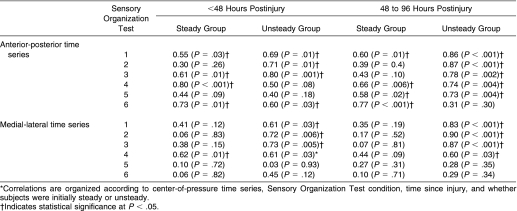
Correlations between ApEn values (COP AP and ML time series) and equilibrium scores were positive, regardless of whether athletes were steady or unsteady after injury (Table 4). The positive correlations indicated that COP displacements that were larger in amplitude (lower equilibrium score) tended to be less random (lower ApEn). Conversely, time series containing smaller COP oscillations (higher equilibrium score) tended to be more irregular (higher ApEn). Relationships were generally stronger in athletes who initially had postural instability after injury, especially in SOT conditions 1 through 3, and remained strong at 48 to 96 hours after injury, when initial postural instability had resolved. A larger number of significant relationships were found for the AP time series.
Table 4. Pearson ( r ) Values for Relationships Between Approximate Entropy Values and Equilibrium Scores* .
Relationship Between Changes in Approximate Entropy Values and Changes in Concussion-Related Symptoms
At preseason, subjects had few symptoms (mean = 3.8, SD = 3.7, range = 0–13) and low aggregate symptom severity scores (mean = 6.5, SD = 8.0, range = 0–31). Within 48 hours after injury, subjects had a greater number of symptoms (mean = 8.0, SD = 3.6, range = 3–13) and symptom severity (mean = 21.2, SD = 13.0, range = 6–46). By 48 to 96 hours after injury, the number of symptoms (mean = 6.5, SD = 3.8, range = 0–13) and symptom severity (mean = 14.6, SD = 13.5, range = 0–51) had begun to decline toward preseason levels. Changes in symptom number and severity differed between steady and unsteady subjects (Table 5). Symptoms for steady subjects tended to resolve between 48 and 96 hours postinjury. For unsteady subjects, however, symptoms remained relatively unchanged, despite the resolution of postural instability. Mean ApEn change scores for all subjects generally were negative and were relatively similar at 48 and 96 hours after injury. Equilibrium score change was more negative within 48 hours than between 48 and 96 hours. Despite these trends, however, changes in COP characteristics before and after concussion were generally unrelated to changes in symptoms at either time interval.
Table 5. Change Scores for Self-Reported Number of Symptoms and Symptom Severity From Preseason to After Cerebral Concussion*.
DISCUSSION
The novel finding of this study was that the postural control of injured athletes, when measured in terms of ApEn values for COP oscillations, did not return to baseline levels within 3 to 4 days after injury. The finding stands in contrast to the SOT equilibrium score data, which as in previous research, 1–4 demonstrated that postural instability generally resolves within that time frame. Our results also revealed a reduction in ApEn values, particularly for the COP ML time series. An explanation for this phenomenon has been proposed previously. 12 Whether the decreased randomness of COP oscillations indicates a heightened risk for subsequent injury remains unknown and should be further investigated.
The distinction between changes in COP randomness (ApEn) and amplitude (equilibrium score) was further supported by the similarity of ApEn recovery curves for steady and unsteady subjects. Clearly, athletes determined to be steady within the first 48 hours after injury did not regain preseason ApEn values faster than athletes who demonstrated postural instability after injury. The similarity between groups and the persistence of decreased COP randomness indicates that regardless of their initial levels of postural stability, all athletes with concussion should be monitored closely after injury.
The decline in ApEn values after concussion may have been related to changes in neurophysiologic or mechanical constraints on postural control. Diffuse axonal injury, for example, may have reduced or distorted interactions among neurons in the brain, 23 thereby increasing the regularity of cortical oscillations 24 that were subsequently manifested in a loss of randomness (increased regularity) in patterns of COP oscillation. Alternatively, increased cocontraction of the lower extremity musculature, generated by injured athletes in an attempt to gain control over postural sway, may also have reduced the randomness of COP oscillations. Regardless of the explanation, the positive relationship between ApEn values and equilibrium scores indicated that larger-amplitude COP oscillations (diminished postural stability reflected in a lower equilibrium score) tended to be more regular (lower ApEn values), whereas lower-amplitude COP oscillations (better postural stability reflected in a higher equilibrium score) tended to be more irregular (higher ApEn values). It appears, therefore, that optimal postural control in quiet standing is achieved via relatively unconstrained, more irregular patterns of motor output.
The primary analysis also revealed important information about changes in postural stability after injury. Consistent with previous findings, 2, 25 changes in equilibrium score after concussion were most apparent under more challenging SOT conditions. This finding can be interpreted in several ways. First, more difficult SOT conditions may place greater demands on the presumably impaired attentional resources of athletes with concussion. With less ability to concentrate, the athlete may show performance declines during more demanding standing conditions. Second, more difficult, sway-referenced conditions may require a higher level of sensory information processing that injured athletes cannot achieve. Previous authors 2, 25 have suggested specific impairments in visual-vestibular processing among athletes with concussion. Finally, sway-referenced platform conditions may require a high level of motor skill, but that skill may be impaired in injured athletes. 26 Regardless of the explanation, our results serve as an important reminder that athletes, who are often capable of extremely precise postural control, may demonstrate injury-related abnormalities only during especially challenging balance tasks.
The difference in the ability of ApEn and the equilibrium score to detect changes in postural control underscores the distinction between their theoretic constructs and the amount of COP information used by each algorithm. The ApEn value is clearly not a measure of postural stability. As a measure derived from nonlinear dynamics, ApEn quantifies randomness in system output to provide clues to underlying system organization. 16 Less random output is thought to be produced by systems that are relatively more constrained. 27 The ApEn algorithm is a highly iterative process that analyzes the recurrent nature of short sequences of data points considered incrementally throughout a time series. The ApEn value reflects relationships between each data point and its immediate neighbors. In contrast, the equilibrium score provides little insight into the evolving patterns of variation in postural control performance during the course of a trial. Equilibrium scores are calculated using only 2 COP data points, the maximum and minimum, regardless of when they occur. As a biomechanical measure based on linear dynamics, the resulting range of COP displacement reflects only the magnitude of variability (error) in system output.
Changes in ApEn values after concussion could not be explained in terms of self-reported symptoms. No relationship was demonstrated, despite a relatively dramatic change in both symptom number and severity from preseason to postinjury. Our results indicate that ApEn values for COP time series provide unique information regarding the health status of athletes with concussion. Combined with the aforementioned distinction between changes in COP regularity and postural stability, the findings highlight the potentially valuable contribution of ApEn as a clinical assessment tool. The results also confirm that the resolution of symptoms does not necessarily coincide with the recovery of physical performance. 4 Importantly, athletes who were initially unsteady after injury were likely to display substantial symptoms even after their postural instability had resolved. Although this finding may seem intuitive, given that concussions severe enough to produce postural instability presumably would be more likely to produce symptoms of longer duration, it highlights the need for serial assessments after injury and effective symptom-management strategies. Clearly, complete symptom resolution, along with the return of normal cognitive function and postural stability, must remain critical considerations in the return-to-play decision.
For several reasons, our results should be interpreted with caution. First, the relatively small sample of convenience was selected for retrospective analysis based primarily on the availability of data. Second, because we used only 2 SOT trials to reflect subject performance, ApEn values and equilibrium scores may not have been entirely representative. Finally, our decision to replace fall trials with nonfall trials may have biased the findings, especially for SOT condition 6 data collected within 48 hours after injury. Nonetheless, these findings provide an important foundation for future discussions of postural control in injured athletes.
CONCLUSIONS
The effects of cerebral concussion on postural control appear to persist for longer than 3 to 4 days, even among athletes who demonstrate normal postural stability. Further research, however, is needed to determine the meaning, mechanism, and duration of postconcussion changes in postural control revealed by ApEn. Until such findings become available, clinicians should exercise caution in relying on measures of postural stability, such as the equilibrium score, as the sole indicator of postural control when determining an athlete's readiness to resume competitive activity after injury. The ApEn value provides a theoretically distinct measurement alternative that may prove useful in future clinical practice as a valuable supplement to postural stability measures.
Acknowledgments
This research was conducted as part of James Cavanaugh's doctoral dissertation at the University of North Carolina at Chapel Hill. Data collection was supported by grants from the National Athletic Trainers' Association Research & Education Foundation and the National Operating Committee on Standards for Athletic Equipment (Kevin Guskiewicz). Manuscript preparation took place as part of James Cavanaugh's postdoctoral work at the Veterans Affairs Medical Center in Durham, NC.
REFERENCES
- Riemann BL, Guskiewicz K. Effects of mild head injury on postural stability as measured through clinical balance testing. J Athl Train. 2000;35:19–25. [PMC free article] [PubMed] [Google Scholar]
- Guskiewicz KM, Ross SE, Marshall SM. Postural stability and neuropsychological deficits after concussion in collegiate athletes. J Athl Train. 2001;36:263–273. [PMC free article] [PubMed] [Google Scholar]
- Guskiewicz KM, Riemann BL, Perrin DH, Nashner LM. Alternative approaches to the assessment of mild head injury in athletes. Med Sci Sports Exerc. 1997;29:S213–S221. doi: 10.1097/00005768-199707001-00003. (suppl 7) [DOI] [PubMed] [Google Scholar]
- McCrea M, Guskiewicz KM, Marshall SW. Acute effects and recovery time following concussion in collegiate football players: the NCAA Concussion Study. JAMA. 2003;290:2556–2563. doi: 10.1001/jama.290.19.2556. et al. [DOI] [PubMed] [Google Scholar]
- Maroon JC, Lovell MR, Norwig J, Podell K, Powell JW, Hartl R. Cerebral concussion in athletes: evaluation and neuropsychological testing. Neurosurgery. 2000;47:659–672. doi: 10.1097/00006123-200009000-00027. [DOI] [PubMed] [Google Scholar]
- Kelly JP, Nichols JS, Filley CM, Lillehei KO, Rubinstein D, Kleinschmidt-DeMasters BK. Concussion in sports: guidelines for the prevention of catastrophic outcome. JAMA. 1991;266:2867–2869. doi: 10.1001/jama.266.20.2867. [DOI] [PubMed] [Google Scholar]
- Guskiewicz KM, McCrea M, Marshall SW. Cumulative effects associated with recurrent concussion in collegiate football players: the NCAA Concussion Study. JAMA. 2003;290:2549–2555. doi: 10.1001/jama.290.19.2549. et al. [DOI] [PubMed] [Google Scholar]
- Blaszczyk JW, Klonowski W. Postural stability and fractal dynamics. Acta Neurobiol Exp Warsz. 2001;61:105–112. doi: 10.55782/ane-2001-1390. [DOI] [PubMed] [Google Scholar]
- Riley MA, Turvey MT. Variability and determinism in motor behavior. J Mot Behav. 2002;34:99–125. doi: 10.1080/00222890209601934. [DOI] [PubMed] [Google Scholar]
- Guskiewicz K. Balance and mild head injury in athletes. Orthop Phys Ther Clin N Am. 2002;11:143–158. [Google Scholar]
- Pincus SM, Gladstone IM, Ehrenkranz RA. A regularity statistic for medical data analysis. J Clin Monit. 1991;7:335–345. doi: 10.1007/BF01619355. [DOI] [PubMed] [Google Scholar]
- Cavanaugh JT, Guskiewicz KM, Giuliani C, Marshall SW, Mercer VS, Stergiou N. Detecting altered postural control after cerebral concussion in athletes without postural instability. Br J Sports Med. 2005;39:805–811. doi: 10.1136/bjsm.2004.015909. [DOI] [PMC free article] [PubMed] [Google Scholar]
- NeuroCom. Equitest System Data Interpretation Manual. Clackamas, OR: NeuroCom International Inc; 1991.
- Pincus SM. Approximate entropy as a measure of system complexity. Proc Natl Acad Sci U S A. 1991;88:2297–2301. doi: 10.1073/pnas.88.6.2297. [DOI] [PMC free article] [PubMed] [Google Scholar]
- Stergiou N, Buzzi UH, Kurz MJ, Heidel J. Nonlinear tools in human movement. In: Stergiou N, ed. Innovative Analyses of Human Movement. Champaign, IL: Human Kinetics; 2004:63–90 .
- Pincus SM, Goldberger AL. Physiological time-series analysis: what does regularity quantify? Am J Physiol. 1994;266:H1643–H1656. doi: 10.1152/ajpheart.1994.266.4.H1643. (4 pt 2) [DOI] [PubMed] [Google Scholar]
- Portney LG, Watkins MP. Foundations of Clinical Research: Applications to Practice. 2nd ed. Upper Saddle River, NJ: Prentice Hall Health; 2000.
- Cavanaugh JT, Mercer VS, Guskiewicz K. Response stability estimates for the Sensory Organization Test: equilibrium scores and approximate entropy values in healthy young adults. Gait Posture. 2004;20:S55. (suppl 1): [Google Scholar]
- Rapp PE. A guide to dynamical analysis. Integr Physiol Behav Sci. 1994;29:311–327. doi: 10.1007/BF02691335. [DOI] [PubMed] [Google Scholar]
- Theiler J, Eubank S, Longtin A, Galdrikian B, Farmer JD. Testing for nonlinearity in time series: the method of surrogate data. Physica D. 1992;58:77–94. [Google Scholar]
- Theiler J, Rapp PE. Re-examination of the evidence for low-dimensional, nonlinear structure in the human electroencephalogram. Electroencephalogr Clin Neurophysiol. 1996;98:213–222. doi: 10.1016/0013-4694(95)00240-5. [DOI] [PubMed] [Google Scholar]
- Schiff SJ, Sauer T, Chang T. Discriminating deterministic versus stochastic dynamics in neuronal activity. Integr Physiol Behav Sci. 1994;29:246–261. doi: 10.1007/BF02691329. [DOI] [PubMed] [Google Scholar]
- McCrory P, Johnston KM, Mohtadi NG, Meeuwisse W. Evidence-based review of sport-related concussion: basic science. Clin J Sport Med. 2001;11:160–165. doi: 10.1097/00042752-200107000-00006. [DOI] [PubMed] [Google Scholar]
- Pincus SM. Quantifying complexity and regularity of neurobiological systems. Methods Neurosci. 1995;28:336–363. [Google Scholar]
- Guskiewicz KM, Perrin DH, Gansneder BM. Effect of mild head injury on postural stability in athletes. J Athl Train. 1996;31:300–306. [PMC free article] [PubMed] [Google Scholar]
- Slobounov S, Sebastianelli W, Simon R. Neurophysiological and behavioral concomitants of mild brain injury in collegiate athletes. Clin Neurophysiol. 2002;113:185–193. doi: 10.1016/s1388-2457(01)00737-4. [DOI] [PubMed] [Google Scholar]
- Newell K. Degrees of freedom and the development of postural center of pressure profiles. In: Newell K, Molenaar P, eds. Applications of Non-Linear Dynamics to Developmental Process Modeling. Mahwah, NJ: Lawrence Erlbaum Assoc; 1998:80–81 .


