Abstract
The yield and quality of food crops is central to the well being of humans and is directly affected by climate and weather. Initial studies of climate change on crops focussed on effects of increased carbon dioxide (CO2) level and/or global mean temperature and/or rainfall and nutrition on crop production. However, crops can respond nonlinearly to changes in their growing conditions, exhibit threshold responses and are subject to combinations of stress factors that affect their growth, development and yield. Thus, climate variability and changes in the frequency of extreme events are important for yield, its stability and quality. In this context, threshold temperatures for crop processes are found not to differ greatly for different crops and are important to define for the major food crops, to assist climate modellers predict the occurrence of crop critical temperatures and their temporal resolution.
This paper demonstrates the impacts of climate variability for crop production in a number of crops. Increasing temperature and precipitation variability increases the risks to yield, as shown via computer simulation and experimental studies. The issue of food quality has not been given sufficient importance when assessing the impact of climate change for food and this is addressed. Using simulation models of wheat, the concentration of grain protein is shown to respond to changes in the mean and variability of temperature and precipitation events. The paper concludes with discussion of adaptation possibilities for crops in response to drought and argues that characters that enable better exploration of the soil and slower leaf canopy expansion could lead to crop higher transpiration efficiency.
Keywords: crop yields, climatic variability, simulation models, grain quality, crop adaptation
1. Introduction
In his presidential address to the UK Royal Meteorological Society in 1980, Professor John Monteith FRS considered the question of climatic variation and the growth of crops. He remarked in his opening (Monteith 1981) that ‘Five previous Presidents had addressed the Society on the subject of weather and crops at almost regular intervals since 1889 …’. The topic continues to capture the imagination of agricultural scientists and agro-meteorologists. It has been given fresh impetus by concerns that the security of global food production and quality may be affected at large and local spatial scales by future climate and weather, perhaps in conjunction with damaging levels of tropospheric gases such as ozone (Long et al. 2005). Monteith calculated the contribution that different weather factors have on the yields of winter- and spring-sown crops grown in eastern England. He concluded that the two largest climatic causes of variation in yield were temperature and rainfall and their independent effects were three to four times larger than caused by variation in how much light was incident on crops. For winter cereals on heavy soils, 12% of their yield variation was calculated to stem from variation in temperature, radiation and rainfall. On lighter land, this rose to 17% of the yield variation. Therefore, other causes of yield variation, notably management, contribute much more to yield variability than those factors beyond our control. However, increased variation and changes in mean temperature and precipitation are expected to dominate future changes in climate as they affect crop production. Such considerations form the main theme of this paper.
Monteith's question and analysis followed much experimental work in crop production over the last 150–200 years, aimed at determining the causes of yield variation. In Europe, with the work of Liebig in Germany and Gilbert and Lawes in England in the mid-nineteenth century, it has concentrated on determining how water and nutrition affect crop yields. Their work was extremely timely given the very high rates of increase in the numbers of Europeans that needed fed in the nineteenth century. A similar need now exists on the global scale if we are to feed the estimated 8–11 billion global population in 2050. Most of the increase in global population will occur in those areas of the planet less congenial to food production than conditions in northwestern Europe or North America. Therefore, we can expect weather to play a more determining role in global yield variability than at present. In extremis, Europe may have to reverse the current de-intensification goals of the Common Agricultural Policy in response to increased food demand from, particularly, China and India as they replicate the economic and technical evolution of the rich world and their populations move from being rural to predominantly urban (Gilles 2005).
This paper describes crop responses to climate and climatic variability. Climatic variability plays a major role in producing meteorological conditions that deviate substantially from mean conditions, including weather extreme events. The definition of what constitutes extreme weather differs for the properties of weather such as temperature, rainfall and wind speed and for a region. For example, temperatures considered extreme for the main cereal growing areas of the UK are normal for cereal areas in France; extreme storms can be more intense and/or frequent and drought is apparent as a total of precipitation and/or its seasonal distribution. The European heat wave of 2003 was characterized by both an increased mean temperature and much larger temperature variability (Schär et al. 2004). Crop growth, development and yield are affected by climatic variability via linear and nonlinear responses to weather variables and the exceedance of well defined crop thresholds, particularly, temperature. Integrating the study of meteorological extremes and crop responses to them, leads to an assessment of the possible impacts of changes in climatic variability on crop production and quality. Finally, there is a consideration of how crops might be managed or be bred to adapt to variable conditions to minimize their effects.
2. Crop responses to climatic variability and extremes
The yield productivity of many crops has risen over the past 40 years. Rates of yield increase in Europe have ranged from 0.8% (oats; Avena sativa) to 2.6% (triticale; Triticosecale) per year (Ewert et al. 2005). Rates of increase in wheat yields differ between European countries, but regional variation about the linear trend is less clear (figure 1). More southerly European countries have lower rates of wheat yield increase than more northern ones, suggesting that weather factors such as temperature and precipitation play a more determining role in yield than in the north. Figure 1 suggests that inter-annual variation in wheat yields has become larger since the mid-1980s. The fact that there have been lower rates of increase in yields in areas of Europe with more extreme conditions and that deviations from a linear trend have increased, points to the conclusion that warming since the start of the 1990s (Schär et al. 2004) has started to affect European wheat yields.
Figure 1.
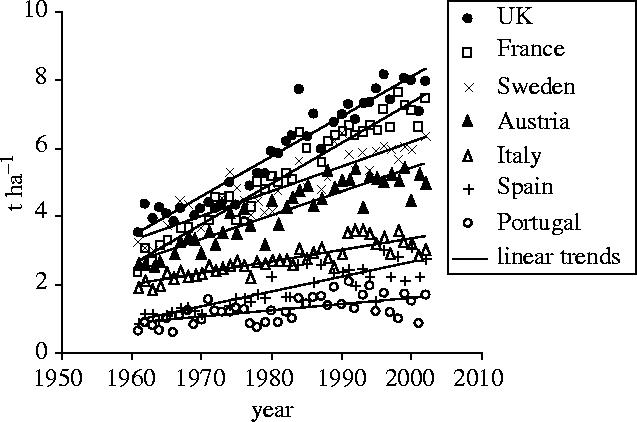
Observed (FAO 2003) grain yields of wheat for selected countries in Europe.
For crops, both changes in the mean and variability of temperature can affect crop processes, but not necessarily the same processes. Some crop processes, mostly related to growth such as photosynthesis and respiration, show continuous and mainly nonlinear changes in their rates as temperature increases (figure 2a). Rates of development and progression through a crop life cycle more often show linear responses to temperature (figure 2b). Both growth and developmental processes show temperature optima, whereby process rates increase over a range but thereafter flatten and decrease. For example, the light-saturated photosynthesis rate of C3 crops such as wheat and rice is at a maximum for temperatures from about 20–32 °C; total crop respiration, the sum of the growth and maintenance components, shows a steep nonlinear increase for temperatures from 15–40 °C followed by a rapid and nearly linear decline. The threshold developmental responses of crops to temperature are often well defined, changing direction over a narrow temperature range, as will be seen later.
Figure 2.
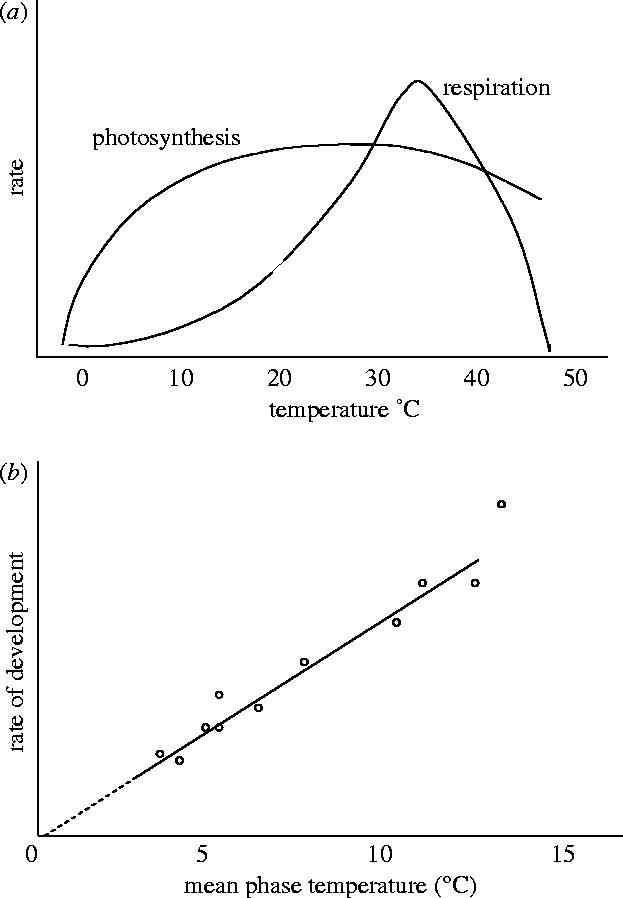
Changes in the rate of (a) C3 photosynthesis and respiration and (b) rate of crop development as a function of temperature.
(a) An experimental study of climatic variability and wheat
Physiological responses to temperature changes in plants may occur at short or long time-scales (Wollenweber et al. 2003). Rapid changes in enzymatic reactions caused by differential thermosensitivity of various enzymes can deplete or result in accumulation of key metabolites. In addition, short-term effects involving altered gene expression, such as heat-shock protein synthesis, are likely to occur. Longer-term responses include alterations in the rate of carbon dioxide (CO2) assimilation and electron transport per unit leaf area, and impaired cell anaplerotic carbon metabolism, sucrose synthesis and carbon (C) and nitrogen (N) partitioning within and between organs (Jagtap et al. 1998). Altered carbon availability brought about by these events will affect uptake, transport and assimilation of other nutrients, disturb lipid metabolism and injure cell membranes (Maheswari et al. 1999), resulting in changes in growth rates and grain yield (Al Khatib & Paulsen 1999). However, temperature responses for specific physiological processes do not always relate directly to growth, because the latter is an integration of the effects of temperature on total metabolism (Bowes 1991).
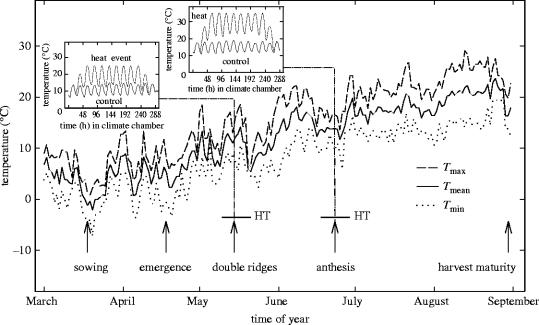
The developmental stage of the crop exposed to increased temperatures has an important effect on the damage experienced by the plant (Slafer & Rawson 1995), but experimental studies of the effects of temperature variability on crop productivity are rare. This is mainly because of the difficulties in establishing and maintaining a temperature regime where a mean climatic value can be held constant between treatments that vary the amplitude of temperature (Moot et al. 1996). A solution to this is to examine the effects of extreme conditions at particular developmental stages (Ferris et al. 1998), in which the extreme conditions are defined with reference to literature (Porter & Gawith 1999). Wollenweber et al. (2003) tested the null hypothesis that wheat plants react to two separate periods of high temperature as if they were independent of each other. The chosen stages were the double-ridge stage of the apical meristem, which is close in time to the transition from vegetative to reproductive development of the apical meristem, and anthesis when extreme temperature events interfere with the development of fertile grains, as meiosis and pollen growth are affected (Wallwork et al. 1998). The experimental design, shown in figure 3, and the extreme temperature conditions were defined as a heat period of eight days of 25 °C at the double-ridge stage and/or a heat event of 35 °C at anthesis. Biomass accumulation, photosynthesis and the components of grain yield were analysed. While a high temperature event of 25 °C at the double-ridge stage is not a stress event sensu strictu for wheat, reproductive spikelet initiation can be impaired (Porter & Gawith 1999) and 25 °C is 13 °C higher than mean daily temperatures measured over 30 years at the experimental site in Denmark.
Figure 3.
Mean, minimum and maximum temperatures at the experimental site at for the heat episode experiment from March until September 1997. During heat events (HT), the plants were transferred to growth chambers and higher temperatures applied as indicated (Wollenweber et al. 2003).
Grain yields were significantly lower in the treatments with high temperatures at anthesis and at both developmental stages. The major yield component reduced by the treatments was the harvest index; that is, the proportion of total dry matter invested in grain. The harvest index was lower in plants experiencing heat periods because their grain number per plant was reduced by 60% (table 1).
Table 1.
Effect of heat events on the harvest index of T. aestivum cv. Chablis (after Wollenweber et al. 2003).
| treatments | main tiller | side tillers |
|---|---|---|
| control (no HT) | 0.52 a | 0.43 b |
| HT at DR | 0.54 a | 0.48 a |
| HT at AN | 0.34 b | 0.30 c |
| HT at DR+AN | 0.31 b | 0.29 c |
Values are given as means (n=30). Within a column, means followed by the same letter are not significantly different at the p=0.05 level, using the Tukey test. Heat events (HT) were induced during the double-ridge stage (DR; 25 °C) and/or anthesis (AN; 35 °C).
However, there was no significant difference in the grain yield of plants as between those warmed at anthesis and those at double ridges and anthesis, meaning that the plants experienced the warming periods as independent and that critical temperatures of 35 °C for a short-period around anthesis had severe yield reducing effects. The conclusions from such results for climate change are that yield damaging weather signals for cereals such as wheat are in the form of absolute temperature thresholds, are linked to particular developmental stages and can be effective over short time-periods. This means that yield damage estimates of coupled crop–climate models need to have a maximum temporal resolution of a few days and incorporate models of crop phenology to deal with the overlap between such extreme weather events and crop sensitivity to them.
In contrast to the effects on developmentally linked processes, no significant differences were seen in the relation between light-saturated photosynthesis and leaf internal CO2 concentration for the heat treatments (figure 4). A heat episode during DR increased the rates of light-saturated photosynthesis (Asat) in green leaves slightly (figure 4). There were no significant differences in Asat and carboxylation efficiency, as measured by the initial slopes of the curves in figure 4, reinforcing the conclusion that the principal effects of high temperatures are on developmental processes, such as flowering and the formation of sinks for assimilated carbon, which in itself either is stimulated or is little affected by short-term warming. An extreme heat episode during vegetative development does not seem subsequently to affect the growth and developmental response of wheat to a second heat event at anthesis, and high-temperature episodes seem to operate independently of each other.
Figure 4.
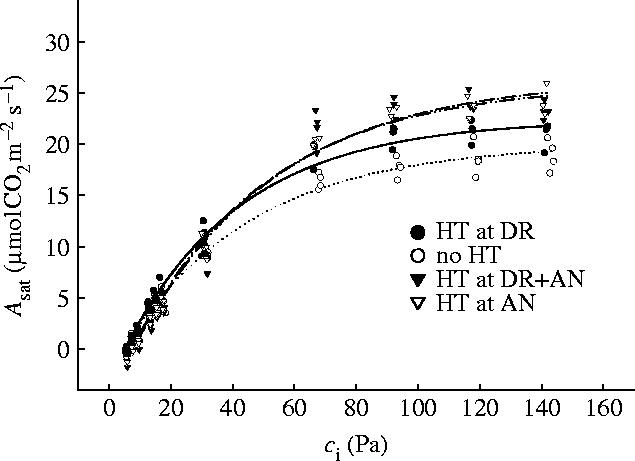
Rate of light-saturated photosynthetic CO2 assimilation (Asat) as a function of CO2 concentration inside the leaf mesophyll (Ci). Each symbol represents means of two independent measurements. DR, double-ridge stage; AN, anthesis; HT, heat event (25 °C at DR, 35 °C at AN) (Wollenweber et al. 2003).
(b) Crop temperature thresholds
In addition to the linear and nonlinear responses of crop growth and development processes described above, short-term extreme temperatures can have large yield-reducing effects on major crops. These effects were reviewed for wheat by Porter & Gawith (1999) and, for annual crops in general, by Wheeler et al. (2000). A general point arising from these reviews were that temperature thresholds are well defined as absolute threshold temperatures above which particularly the formation of reproductive sinks, such as seeds and fruits, are adversely affected, as seen in the experiment described above.
Table 2 shows how relatively small and consistent the standard errors of the threshold mean temperatures for many processes are in wheat. The largest standard error found was 5.0 °C for the maximum temperature for root growth, followed by 3.7 °C for the optimum temperature of root growth. Others, such as the base and optimum temperatures for shoot growth, the optimum temperature for leaf initiation and base temperature for anthesis have standard errors of less than 0.5 °C. Thus, the consensus is that functionally important temperatures for wheat are conservative when compared between different studies.
Table 2.
Summary of mean (±s.e.) of lethal minimum (TLmin), lethal maximum (TLmax), base (Tmin), optimum (Topt) and maximum (Tmax) temperatures for various processes and phenological phases in wheat (Porter & Gawith 1999). n is the number of literature sources used to calculate means and SE.
| mean temperature (±s.e.) (°C) | n | ||
|---|---|---|---|
| processes | |||
| lethal limits | TLmin | −17.2 (1.2) | 17 |
| TLmax | 47.5 (0.5) | 2 | |
| leaf initiation | Tmin | −1.0 (1.1) | 12 |
| Topt | 22.0 (0.4) | 9 | |
| Tmax | 24.0 (1.0) | 5 | |
| shoot growth | Tmin | 3.0 (0.4) | 5 |
| Topt | 20.3 (0.3) | 6 | |
| Tmax | >20.9 (0.2) | 6 | |
| root growth | Tmin | 2.0 | 1 |
| Topt | <16.3 (3.7) | 3 | |
| Tmax | >25.0 (5.0) | 3 | |
| phenological phases | |||
| sowing to emergence | Tmin | 3.5 (1.1) | 8 |
| Topt | 22.0 (1.6) | 11 | |
| Tmax | 32.7 (0.9) | 10 | |
| vernalization | Tmin | −1.3 (1.5) | 6 |
| Topt | 4.9 (1.1) | 11 | |
| Tmax | 15.7 (2.6) | 7 | |
| terminal spikelet | Tmin | 1.5 (1.5) | 2 |
| Topt | 10.6 (1.3) | 5 | |
| Tmax | >20.0 | 1 | |
| anthesis | Tmin | 9.5 (0.1) | 3 |
| Topt | 21.0 (1.7) | 2 | |
| Tmax | 31.0 | 1 | |
| grain-filling | Tmin | 9.2 (1.5) | 6 |
| Topt | 20.7 (1.4) | 7 | |
| Tmax | 35.4 (2.0) | 5 | |
A crop that is important in the developing world is groundnut (Arachis hypogaea L.). This is an important food crop of the semi-arid tropics, including Africa, and can experience temperatures above 40 °C for periods during the growing season (Vara Prasad et al. 2000). The harvestable seeds of groundnut are formed following flowering and fruiting periods. When exposed for short-periods at high temperatures of up to 42 °C just after flowering, a clear relationship between fruit set and mean floral temperature was found (Vara Prasad et al. 2000; figure 5). From between 32 and 36 °C and up to 42 °C, the percentage fruit set fell from 50% of flowers to zero and the decline in rate was linear (figure 5), illustrating once more the sharpness of response of crop plants to temperatures between 30 and 35 °C during the flowering and fruiting periods.
Figure 5.
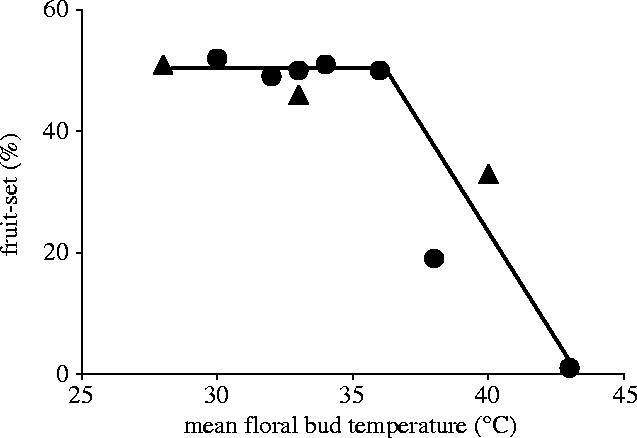
Relationship between percentage fruit set (angular transformed data) and mean floral temperature, from 08:00 to 14:00 h, 9 days after flowering in groundnut (Vara Prasad et al. 2000).
Various literature sources have identified similar patterns for other important food crops such as maize and rice. For example, maize exhibits reduced pollen viability for temperatures above 36 °C; rice grain sterility is brought on by temperatures in the mid-30s °C and similar temperatures can lead to a reverse of the vernalizing effects of cold temperatures in wheat. What is perhaps more surprising than the consistent damaging effects of high temperatures in food crops is that cold-blooded animals also exhibit threshold temperature responses for various activities. Figure 6 shows the temperature limits of the desert pup fish (Cyprinodon n. nevadensis) that lives in the Nevada desert in the USA. As with plants, the lethal limits are the widest, followed by activity limits, development and growth with the reproductive limits being the narrowest from 24 to 30 °C, the upper value interestingly close to the limits seen for many crop plants, but this is presumably a coincidence. It would be very useful to have equivalent diagrams for the major crop plants in the world and thereby provide specific quantitative information on the probability and consequences, in other words the risk, from crop damaging climate change at the regional or country level. This would further be the linkage between crop physiology, crop agronomy and climate science (Porter 2005).
Figure 6.
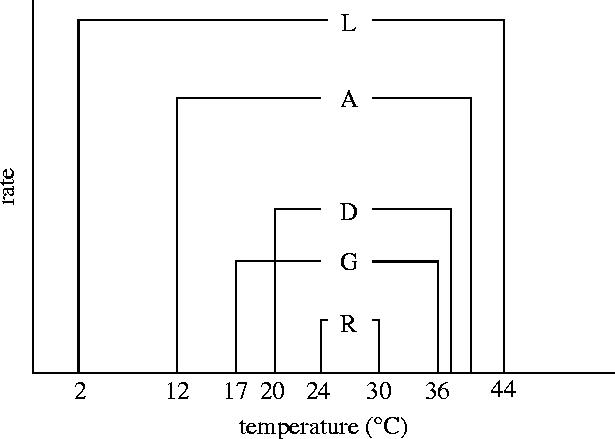
Thermal limits for reproductive (R), growth (G), development (D), activity (A) and lethal (L) thermal limits in Cyprinodon n. nevadensis (Shrode & Gerking 1977; Gerking & Lee 1983 and quoted in Cossins & Bowler, 1987).
3. Climate change and climatic variability
(a) The extent of climatic variability
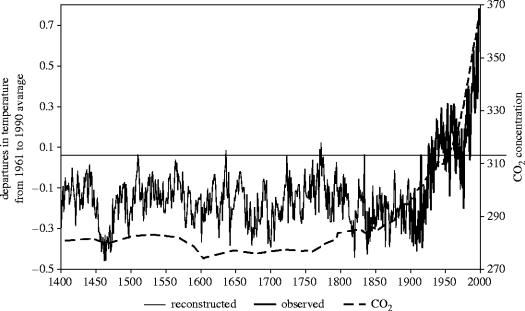
Global temperatures are currently rising and there is debate about whether this is the result of human activities such as the burning of fossil fuels and land clearance or is an expression of the decadal to millennial scale variability in temperatures (Mann et al. 1998; Moberg et al. 2005). From the instrumental record, it is clear that over the past ca 150 years, the mean Northern Hemisphere temperature rise has been rapid in relation to changes on the millennial scale (figure 7: Mann et al. 1998; Moberg et al. 2005). The observed temperature anomaly of +0.4 °C in relation to the long-term mean is still within the absolute range calculated by calibrated reconstruction methods. The most important feature of the Mann et al. 1999 data is the rate of change of temperature since the mid-1900s although recent other studies (Moberg et al. 2005) have pointed to larger multi-centennial variation than found in earlier multi-proxy reconstructions.
Figure 7.
The anomaly range in northern hemisphere surface temperature from 1400 AD to the present and associated change in ambient CO2 concentration (Mann et al. 1998).
Less is known about changes in the variability of climate, although extreme values of, especially, temperature and precipitation can have large effects on crop yields and their variability (Semenov & Porter 1995). A review of observed variability and trends in extreme climate events (Easterling et al. 2000a) concluded that there was evidence for increases in extreme temperature events in some areas of the world. This was not a general observation either in terms of regional distribution or in terms of the extreme temperature variables examined, that included number of frost days, minimum and maximum temperatures and hot and cold waves (table 3). The diurnal temperature range showed a general decrease from 1950 to 1990, caused by larger increases in minimum as opposed to maximum daily temperatures (Easterling et al. 1997). Precipitation intensity, in terms of the number of days with precipitation above 25 mm, shows a statistically significant (p<0.05) increase in many areas of the globe. In eastern Asia, southern Africa and Brazil this increase is accompanied by either no change or reductions in mean total precipitation (Easterling et al. 2000a). The frequency and duration of drought or flooding events are important for food production and its security. Analysis has shown an increase in the areas of the world affected by either excessive or insufficient rainfall (Dai et al. 1998). Some of the areas, such as Hungary and China, which have shown increased drought frequency (Easterling et al. 2000a), are regionally important production areas for staple cereal crops. However, the many gaps in table 3 reinforce the lack of high quality long-term meteorological data needed to make such analyses (Easterling et al. 2000a). Obtaining such data at a temporal scale relevant for crop production needs to be a high priority, in order to inform the debate on the extent and importance of climatic variability. In addition, information is required as to how climate and weather variability may change under a general climate warming.
Table 3.
Summary of analyses of temperature extremes from around the world (Easterling et al. 2000b).
| country | frost days | warm minimum temperature | warm maximum temperature | cold waves | heat waves |
|---|---|---|---|---|---|
| Australia | fewer | up | |||
| China | fewer | up | down | fewer | |
| C. Europe | fewer | ||||
| N. Europe | fewer | ||||
| New Zealand | fewer | up | |||
| US | fewer | up | no trend | no trend | no trend |
(b) Effect of climate warming on ENSO and the thermohaline circulation
A large-scale climate fluctuation that has important effects on the global climate cycle, its variation and the conditions for crop production is the El Niño Southern Oscillation (ENSO). A slight temperature change in the ocean surface waters can have a significant impact on the atmosphere. Warm currents can affect regional climate considerably causing significant increases or decreases in rainfall levels. The term El Niño refers to the large-scale ocean–atmosphere climate phenomenon linked to a periodic warming in sea-surface temperatures across the central and east-central equatorial Pacific. This can cause irregular changes in rainfall patterns on the western and eastern Pacific rims, producing important environmental and economic impacts. ENSO events can cause severe drought or floods over Australia and other parts of the world, as well as floods in Peru and in the Central Pacific.
Computer simulations have been used to predict how increased levels of greenhouse gases might affect the frequency and strength of ENSO events (Neelin et al. 1998; Bracco et al. 2004). The aim is to reproduce the detail of ocean changes associated with the ENSO event, which then can be built into an ocean model for the globe, coupled to models of the global atmosphere (Smith et al. 1997). The coupled ocean–atmosphere global climate models (GCMs) are able to simulate ENSO under present conditions and under higher levels of greenhouse gases. Simulation experiments with these coupled models (Smith et al. 1997; Zheng et al. 2004) confirmed that ENSO is a robust feature, and persists under projected increased levels of greenhouse gases. Of concern, however, is that the models suggest that El Niños could occur more frequently if atmospheric CO2 doubles by 2050. The models suggested that ENSO cycles might occur on average about every three years, rather than the average of every five years under present conditions.
One region where rainfall is strongly influenced by ENSO is southern Africa. Cane et al. (1994) did a simple correlational analysis of the relationship between Pacific sea-surface temperatures (SSTs) and national maize production in Zimbabwe (figure 8, Cane et al. 1994). A large component of the inter-annual variability in Zimbabwean maize production could be explained by Pacific SST anomalies (Phillips et al. 1998).
Figure 8.
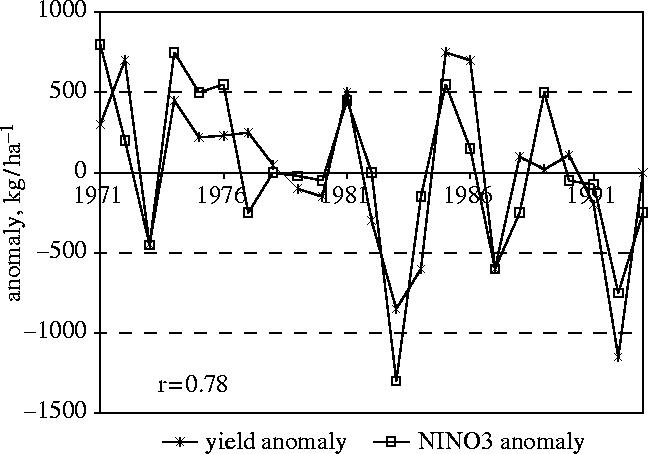
Time-series of maize yields in Zimbabwe and sea-surface temperatures in the Nino3 region. The correlation between the time-series is 0.78 (Cane et al. 1994).
The conclusion is, that at regional and global scales, the extent and frequency of changes in climate as it affects crop production seem to be rising and are likely to increase in the future. This raises the question of whether such changes amount to what has been called ‘dangerous’ climate change (Mastrandrea & Schneider 2004). In terms of crops and animals, the main ‘danger’ from climate change arises as temperatures increase that means that the thresholds described above are crossed more frequently. However, this ignores any decrease in temperature that could occur if the thermohaline circulation is reduced or shuts down completely (Schlesinger et al. 2005). It is likely that temperature conditions in southern Europe and the Mediterranean rim and other areas in the globe such as the Indo-Gangetic Plain and the cereal producing areas of China will be ‘dangerous’. This means that consideration should be given to the situation whereby there is a need to increase UK and northern European production to compensate for declines elsewhere. The effects on UK agriculture of climate change cannot be separated from the regional and global effects of climate change that might mean that the current direction in the CAP to decouple support from production may have to be reversed.
4. Effects of climate change on crop yield and quality
For most of the 10 000 years that humans have cultivated the land, the atmospheric CO2 concentration has been between 260 and 280 μmol mol−1 (Indermühle et al. 1999) and the Northern Hemisphere temperature variation, in relation to its long-term mean, has been about 1 °C, with a decreased amplitude since about 1500 (Mann et al. 1999). However, since 1900, both the mean and variance of the temperature anomaly have been increasing, as has the atmospheric CO2 level to its current value of about 370 μmol mol−1. Issues for crop production under these circumstances are the potential of climate change to reduce the productivity of cropping systems and the possible adaptations of systems to change and the potential of farming activities to slow the build-up of greenhouse gases. Crop physiology has had and will continue to have an important role to play in each of these areas. The impacts of climate change on crops have received much attention from crop physiologists (Long et al. 2004; Amthor 1991), indicating the potential for adaptation by breeding and agronomy (Evans & Fischer 1999). Recent predictions based on the Intergovernmental Panel on Climate Change (IPCC) scenarios (Nakićenović & Swart 2000), argue for a stronger role for CO2 fertilization in the future, but this is not seen before 2050 when ambient CO2 levels are predicted to be in excess of 500 μmol mol−1 and thus double pre-industrial levels (IMAGE-team 2001).
From the start of the debate about the impacts of changing CO2 levels and enhanced radiative warming of the global atmosphere, in the mid-1980s, many studies of agricultural and non-agricultural species concentrated on responses of physiological processes affecting C fixation to CO2 concentrations above pre-industrial values (Drake et al. 1997; Kimball et al. 2002; Ewert 2004; Long et al. 2004). Until the mid-1990s, modelling studies of the impacts of climate change on agriculture (Rosenzweig & Parry 1994) focused on the effects of increases in CO2 level and changes in average climate conditions, such as a rise in mean global temperature or change in rainfall, on crop production. However, it was soon realized that these analyses were conceptually incomplete because: (i) crops, and plants in general, respond nonlinearly to changes in growing conditions, exhibiting discontinuous threshold responses and (ii) crops are often subject to combinations of stress factors that affect their growth and development. Therefore, the effect of climatic variability, the frequency of extreme events, and the effects of combinations of factors have since assumed greater importance (Semenov & Porter 1995). The latest version of the IPCC report on climate change (IPCC 2001) has emphasized issues of climatic variability, mitigation and adaptation to climate change for cultivated and natural ecosystems, as well as likely impacts on the global biosphere.
Porter & Gawith (1999) and the third assessment report of the IPCC (IPCC 2001) have identified that climate could become more extreme via changes in the mean and variance of climatic parameters. The changes postulated for temperature (figure 9) show the effect of an increase in mean temperature, its variance or both distributional parameters on the probability of occurrence of more extreme temperatures. Increasing the mean temperature moves the whole frequency distribution towards hotter and away from colder temperatures. Climatic variability, or more accurately the variability of the weather, since crop growth and development respond to local weather and not general climate, is seen in IPCC (2001) as stemming from three sources:
changes in the mean weather such as a change, and most likely an increase, in annual mean temperature and/or precipitation;
a change in the distribution of weather, such that there are more frequent extreme weather events such as physiologically damaging temperatures or longer periods of drought; and
a combination of changes to the mean and its variability.
Figure 9.
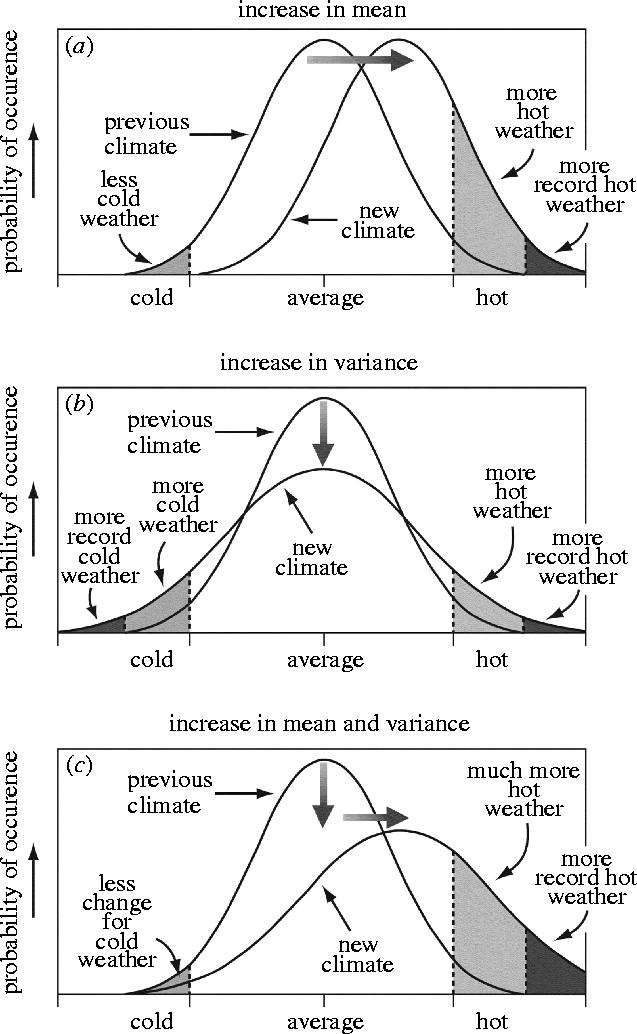
Postulated changes in the distribution of temperatures involving changes in their (a) mean, (b) variance and (c) both on the frequency of occurrence of extreme conditions (IPCC 2001).
These three scenarios would reveal themselves in higher maximum temperatures, hotter days and heat waves over nearly all land areas; and more intense precipitation and drought events over many areas associated with, for example, El Niño events and a likely increase in the variability of Asian summer monsoon precipitation. Variability at a range of spatial and temporal scales is now a key concern in studies of impacts on ecosystems in general and agro-ecosystems in particular. The question for agriculture is how any changes in the variability of weather are mirrored in changes in the variability of crop production. Increased spatial or temporal variability in crop production, measured by the coefficient of variation (CV) of yield, implies lower security of the food supply in terms of amount and quality.
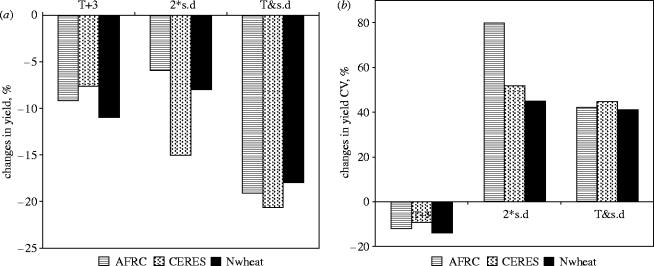
Simulation modelling of the effects of climatic variability has pointed to the general conclusion that increased annual variability in weather causes increased variation in yields. For wheat (figure 10), it was found by three simulation models that doubling the standard variation of temperature, while holding its mean value unchanged (i.e. the scenario in figure 9b) gave the same decrease in yield as a 4 °C increase in mean temperature (figure 9a) but a more than doubled coefficient of yield variation. It remains a challenge for experimental studies to test these model predictions but there are sound reasons to expect verification of the predictions. The mechanisms that lie behind such responses are likely to be complex but will involve the nonlinear relationship of respiration with temperature, and temperature threshold effects on reproductive fertility and phenology (Ferris et al. 1998; Porter & Gawith 1999).
Figure 10.
Modelling of the effect of variation in temperature on (a) crop yields and (b) its variation (as CV) for wheat. T+3, mean temperature increased by 3 °C (cf. figure 9a); 2×s.d., standard deviation of temperature doubled without change in its mean value (cf. figure 9b); T & s.d., combination of raised mean and standard deviation of temperature (cf. figure 9c).
Using a GCM (UKTR), we analysed the response of simulated wheat yield to climate change scenarios with and without changes in the inter-annual variability of precipitation (intensity and occurrence) and temperature (Porter & Semenov 1999). Changes in climatic variability, derived from the UKTR model, were introduced into the climate scenarios via a stochastic weather generator (Semenov & Barrow 1997). The statistics used to measure the effect of inter-annual climatic variability were mean grain yield and its CV from 30 individual years of simulation, for two sites (Spain and the UK). We found for Spain for the baseline climate that the simulated mean wheat yield was 5.6 t ha−1 with a CV of 0.24 (table 4). In the climate scenario without a change in inter-annual variability, mean yield fell slightly to 5.2 t ha−1 with a CV of 0.23. With changes in climatic variability, simulated mean yield dropped to 3.9 t ha−1 but its CV more than doubled to 0.48, particularly because of an increase in the occurrence of prolonged dry spells over the vegetation period. The probability of producing yields of less than 3.5 t ha−1 in the ‘with variability’ scenario was nearly 0.50, compared with about 0.10 for the baseline and ‘without variability’ scenarios (figure 11). Such changes in annual yield variability would make wheat a risky crop to grow in Spain and have important economic and social consequences. For the UK situation, changes in climatic variability had hardly any effect on either mean grain yield or its CV (table 4).
Table 4.
The effect of climate change with and without changes in inter-annual temperature and precipitation variability on simulated mean wheat yield (t ha−1) over 30 years and its CV for sites in Spain the UK.
| baseline climate | UKTR without changes in inter-annual variability | UKTR with changes in inter-annual variability | |
|---|---|---|---|
| Spain | |||
| mean grain yield | 5.6 | 5.2 | 3.9 |
| CV of grain yield | 0.24 | 0.23 | 0.48 |
| UK | |||
| mean grain yield | 9.8 | 11.5 | 11.4 |
| CV of grain yield | 0.06 | 0.08 | 0.09 |
Figure 11.
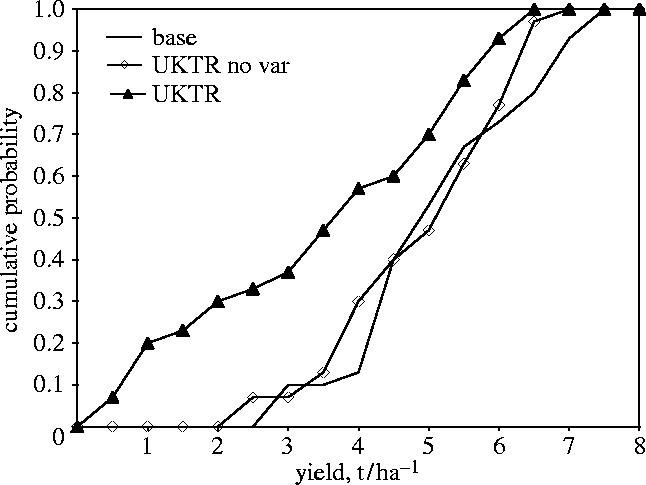
Cumulative probability functions of grain yield as simulated by SIRIUS Wheat (Jamieson et al. 1998) for the base climate and for the UKTR scenarios with and without changes in climatic variability.
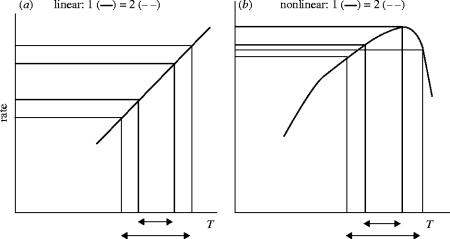
One reason for the differences between the ‘with-and-without’ variability scenarios is the interaction between linear and nonlinear crop processes and the variability of climate, interpreted as the amplitude of temperature between a minimum and maximum value. For a linear process, such as crop development, its rate, computed from the average of the minimum and maximum temperature, is the same irrespective of the temperature amplitude (figure 12a). This is not the case for a nonlinear process (figure 12b). The temporal scale of the amplitude, such as hourly, daily or monthly is important and there must be congruence between the temporal scale of climate variability and the scale of the affected processes. For the major annual food crops, hourly changes in temperature are the shortest time-scale that needs to be included. This is an important message for the climate modelling community as it sets the goal for the required level of detail in their predictions of temperature in particular, for crop climate studies.
Figure 12.
Diagrams showing how the rates of a linear and nonlinear crop process may respond to differences in the amplitude (maximum minus minimum value) of temperature (T). Part (a) shows a linear process, where two amplitudes of temperature (defined by the arrows) lead to the same average rate of a process, i.e. the rate is independent of amplitude. Part (b) shows that the same amplitude as in (a) leads to two different rates for the process for a nonlinear process, making the rate dependent on amplitude.
(a) Climate change and grain quality
The majority of analyses of the effects of climate change on food and forage crops have been concerned with production, either per unit area or for a region. A major omission has been studies of the influence and mechanisms by which climate change might affect crop and food quality, for either human or animal nutrition. Crop quality is a multi-faceted and complex subject involving growth, storage and processing pre- and post-harvest, and including nutritional, technological and environmental aspects. For example, in both humans and livestock, it is possible to have a carbohydrate sufficiency but still suffer from malnutrition—in the form of protein, mineral or vitamin deficiencies. The general picture for wheat is that elevated CO2 is detrimental to flour quality both in nutritional terms (protein content) and in technological terms (rheological properties, e.g. the Hagberg falling number (HFN); IPCC 2001). Closed chamber experiments with wheat, in which nitrogen, temperature and CO2 level have been manipulated, have shown that there is a strong influence of weather in the determination of total protein content and, as importantly, its composition, which affects its nutritional and bread-making rheological properties (Kettlewell et al. 1999; Gooding et al. 2003; Martre et al. 2003).
One of the few examples, at the regional scale, of the influence of climatic variability on crop quality for wheat is seen because of the North Atlantic oscillation (NAO). The NAO is an equivalent Northern Hemisphere pressure oscillation to the ENSO, referred to above. The NAO is an index based on the alternation of air pressure between Iceland and the Azores linked to fluctuations in SSTs in the northern Atlantic. Kettlewell et al. (1999) reported on the correlations between the NAO and a range of quality parameters for wheat in the UK that included HFN, specific weight and total protein concentration. HFN is a measure of α-amylase activity and a high HFN is desired since this indicates low α-amylase activity. A low HFN is often correlated with wet conditions at harvest, leading to sprouting of the grain in the ear and fungal disease infections of the grain. HFN was positively correlated (r2=0.58; p<0.001) with NAO for January and February from 1972 to 1996 (figure 13; Kettlewell et al. 1999).
Figure 13.
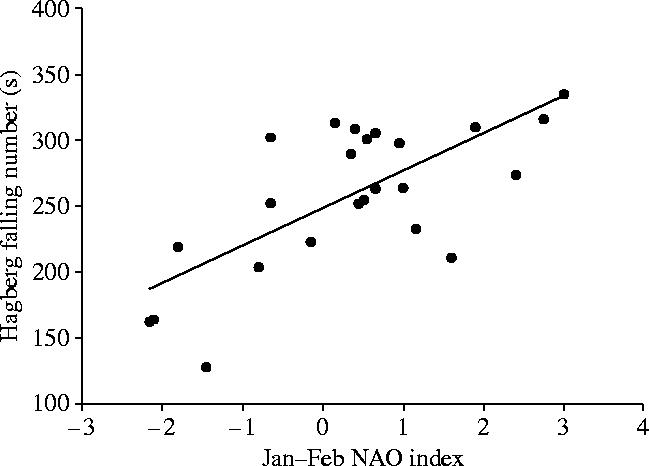
Relationship between the NAO index from 1972 to 1996 and the HFN of UK wheat (Kettlewell et al. 1999).
Kettlewell et al. (1999) extended their analysis by examining the relationship between the NAO and the premium price paid for high quality wheat in the UK (figure 14).
Figure 14.
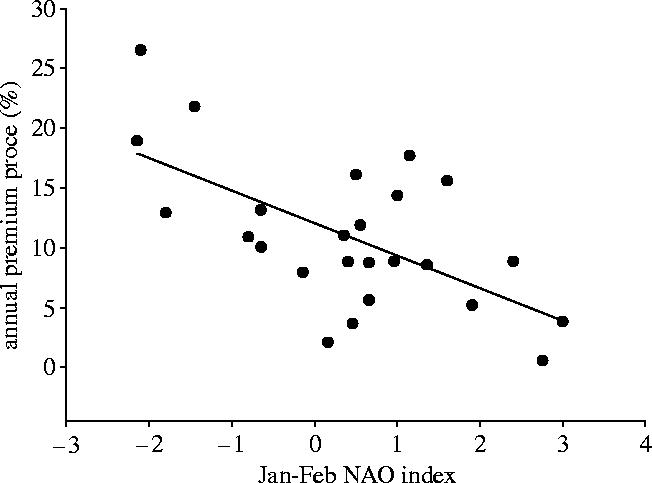
Relationship between the NAO index from 1972 to 1996 and the premium price of UK wheat (Kettlewell et al. 1999).
The correlation was negative but significant (r2=0.38; p<0.001) and was explained by the negative correlation between high values of the January–February NAO index and the amount of rainfall in the UK in August, the harvesting month. High amounts of rainfall in August reduce the supply of high quality wheat in the UK, thus increasing the wheat premium price, resulting in a negative correlation with the early season NAO. This study by Kettlewell et al. (1999) is one of the few to show how climate variability can affect the quality as well as quantity of a harvested crop and this has been calculated in terms of the percentage of UK milling flour that is imported. For wet years (low NAO), about 45% of the UK milling wheat is imported falling to 25% for high NAO years.
With respect to the quality of fodder, IPCC (2001) reports that, in high-quality grass species for ruminants, elevated CO2 and temperature increase have only minor impacts on the digestibility and fibre composition of the harvested material (Soussana et al. 1997). Nevertheless, livestock that graze rangeland with low protein-containing forage may be more affected by increased C : N ratios than energy-limited livestock that graze protein rich pastures (Gregory et al. 1999). Lowering the protein-to-energy ratio in forage could reduce the availability of microbial protein to ruminants for growth and production, leading to less efficient utilization of feed and more waste, including emissions of methane. The effect of climate change on food quality will be an important issue for future research in the development of a healthy and sustainable diet. To play an active role in this area, crop physiologists will need to take more account of the interests of breeders and processors by studying, quantifying and modelling the differences in quality among crop varieties and species.
An inevitable requirement for higher production will be increased use of nitrogen fertilizer, for two reasons. The first is that maintaining the yield response to elevated CO2 requires higher levels of the supply of Rubisco. The reasons for this are unclear but are possibly linked to the enhanced turnover of the CO2 fixing enzyme as CO2 level increases. A second reason is that elevated CO2 on its own leads to an increase in crop C : N ratio (Triboï et al. 2003), meaning that the nutritional quality, in terms of grain protein will decrease in the absence of extra N. The link between climate change and food quality remains one of the main under researched areas in global change studies, yet is one of the issues most directly relevant to human needs. As new wheat varieties have been bred for improved yield, there has been a tendency for protein content to diminish. High yields call for a long-lived canopy, but most of the N in green tissue will end up as part of the storage protein in grain (Jamieson & Semenov 2000). Therefore, there is a tension between the physiologies of yield and protein formation. Recent work (Martre et al. 2003) has shown that transfer of N from vegetative to grain tissue is largely source regulated. That means that breeding attention to increase yield and quality, traditionally focused on the grain, must be directed to manipulating the N pools within the plant. This infers that the dual aims of simultaneously increasing crop yield and protein content can be achieved by making the pool of labile N within wheat plants larger. Nevertheless, the building of protein requires a supply of N, and high yields coupled with high protein will always require N fertilizer.
Simulation studies of the effects of changes in climate variability on crop quality are rare. Based on those presented above (figure 10), regarding the importance of changes to the mean and/or variability of temperature and precipitation, and using the LARS-WG stochastic weather generator (Semenov & Barrow 1997) and the Sirius wheat simulation model (Jamieson et al. 1998), showed that longer periods of dry weather, but with the same total precipitation raised the variability of both yield and grain protein concentration by 70–80% compared to a baseline (table 5). Such predicted increases in the uncertainty of obtaining high quality grain with more variable conditions were larger than the predicted effects of changes in mean temperatures, even though the area chosen (southern Spain) could be expected to provide temperatures in the region of or above the thresholds identified above. The important general point is that the issue of crop quality as it is affected by climate changes needs to be given as much emphasis in future modelling and experimental studies as climate and weather effects on crop productivity have until now.
Table 5.
Simulations of the effects of increases in mean temperature, more variable temperatures and longer dry periods in relation to a 30-year baseline climate from Seville, Spain on the CV of yield and grain protein concentration of wheat.
| scenario | CV of yield (%) | CV of grain protein concentration (%) |
|---|---|---|
| baseline | 11.1 | 11.0 |
| mean T+2°C | 10.9 | 9.7 |
| mean T+4°C | 9.8 | 8.5 |
| more variable T | 14.0 | 12.5 |
| longer dry periods | 17.6 | 19.1 |
5. Adaptation
If it is the case that the climatic conditions for growing plentiful and nutritious crops are going to be variable and severe in the future then consideration needs to be given as to how humans can adapt. Olesen & Bindi (2002) distinguish short-term sectoral and long-term structural adaptive changes that can be made in agriculture. The sectoral changes include plant breeding and recent results from CIMMYT (www.cimmyt.org) have offered a possibility of breeding highly drought resistant wheat plants. The wheat plants have been genetically transformed to include and express the DREB gene coding for a ‘dehydration-responsive element binding’ protein and to withstand drought in preliminary field trials. Such a single-gene adaptation to drought creates questions in the minds of crop physiologists who are more used to understanding drought as a complex of biological and physical processes that cannot be controlled by a single gene. The crop physiological view would be that there exist a number of crop traits that can affect crop response to drought.
An example of how crop models can be used to identify plant traits that may prove useful in particular growth conditions, such as increased temperature or reduced water supply is given by Sinclair & Muchow (2001) for maize (table 6). Using a maize simulation model, they analysed the possible effect of eight putative crop traits on the mean simulated yield of maize grown over 20 years at Columbus, Missouri in the USA. The site was chosen because its high inter-annual variation in rainfall (a 20 yr mean of 411 mm yr−1 with a range from 169 to 772 mm yr−1), could be expected to ensure seasons of contrasting crop water relations. Traits for adaptation to drought conditions fall into three broad categories; a reduction in the length of pre-flowering and/or post-flowering phases to escape drought (e.g. Bolanos et al. 1993); expansion of the soil water extracted volume to increase water supply by, for example, deeper roots (Salih et al. 1999) and decreases in the rate of soil water extraction by reduction in canopy size via smaller leaves (Salih et al. 1999) or a slower rate of leaf appearance (Muchow & Carberry 1989, 1990) and/or stomatal responses (Ludlow & Muchow 1990; Ray & Sinclair 1997). Such individual phenotypic traits can be combined but can also have yield reducing implications for other plant processes. For example, smaller leaves may reduce evapotranspiration but a smaller canopy will intercept less radiation and produce less dry matter, leaving the biomass yield to transpiration ratio largely unchanged. Such trade-offs become are readily apparent within a logical and quantitative description of a cropping system; in other words, a crop simulation model.
Table 6.
Summary of mean values and CV for simulated grain yield, evapotranspiration (ET) and their ratio of 20 year of simulations with changes in traits described in the text (after Sinclair & Muchow 2001). RUE, radiation use efficiency.
| trait | yield (g m−2) | CV (%) | ET (mm m−2) | yield/ET (g mm−1) |
|---|---|---|---|---|
| baseline maize | 409 | 54 | 387 | 0.99 |
| 100 cm rooting depth | 597 | 47 | 419 | 1.16 |
| 120 cm rooting depth | 563 | 43 | 442 | 1.23 |
| smaller leaves | 370 | 52 | 389 | 0.90 |
| slower leaf appearance | 540 | 57 | 408 | 1.23 |
| lower RUE | 421 | 47 | 386 | 1.04 |
| higher grain growth rate | 368 | 50 | 366 | 0.96 |
| early stomatal closure | 445 | 60 | 391 | 1.08 |
| delayed stomatal closure | 381 | 55 | 383 | 0.93 |
| combined traits | 474 | 36 | 402 | 1.14 |
Sinclair & Muchow (2001) examined the effects on grain yield and its variation of eight plant traits that are known to vary between cultivars and are presumably heritable to a degree. The traits were chosen to resemble those of sorghum, a crop adapted to drier conditions than maize: two increased depths (100 and 120 cm versus 80 cm) of soil water extraction; decreased leaf size; slower rate of leaf appearance; decreased CO2 assimilation; early stomatal closure; delayed stomatal closure; increased grain growth rate but decreased duration and combination of those of the above eight traits related to leaves, CO2 and grain growth. The yearly simulated yields over 20 year for the site in Columbus, Missouri, USA formed the baseline for comparison for yearly yields with and without the ‘sorghum’ traits. Table 9.4 in Sinclair & Muchow (2001) shows the mean yields, evapotranspiration and their ratio for the changed crop traits. For the baseline over the 20 years, the simulated grain yields ranged from 87 to 976 g m−2 with a mean of 409 g m−2.
The three traits that produced the largest yield enhancement relative to the baseline were increased rooting depth and thereby the soil volume explored for water, followed by a slower rate of leaf emergence, canopy development, and thus evapotranspiration and their combination. The transpiration efficiency (gram biomass per gram water) was simulated to increase by between 14 and 23% with these trait changes. The effect of slowing the rate of leaf emergence (figure 15) reveals an interesting pattern. In the two years with the largest change in yield, the baseline simulation predicted very low yields. Generally, all years benefited a little from slower canopy development as evapotranspiration was thereby spread over the growing season more equitably. In a few years, the yield was predicted to be lower than the baseline and this occurred when the crop ran into an early frost and died prematurely. Larger positive yield changes were seen for the larger baseline yields, indicating that extending the length of the growing season is advantageous both in conditions where drought limitations are small to begin with and in extreme drought conditions, where resources are used more sparingly. The general point is that there seem to be traits that can benefit both ends of the continuum of high and low resource inputs into cropping.
Figure 15.
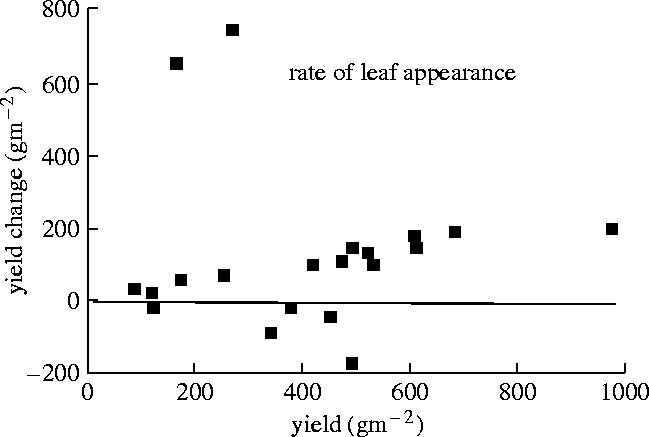
Yield change for each of 20 years from a maize crop with a relatively rapid leaf appearance rate (baseline) to one with a slower rate, plotted against yield simulated for the baseline (Sinclair & Muchow 2001).
The CV (standard deviation as a percentage of the mean) of yields measures their inter-annual variation and is an indication of yield stability. Table 6 shows that in the variable rainfall of Missouri the CV of the modelled baseline yields was 54%. Plant traits, such as increased rooting depth and a lower radiation use efficiency (RUE) that increased predicted mean yield, also reduced inter-annual yield variation as shown by the lowered CV. Early stomatal closure was predicted to both reduce yields and increase their variation, and thus would not seem to be a desirable trait for adapting to drought. The combined traits offered an increase in mean yield and a substantial reduction in their CV, thus illustrating and emphasizing the conclusion that adapting crops to drought needs to use a range of phenotypic strategies and that single traits are unlikely to succeed.
Changing the response of stomata to drought was predicted to have little general effect on improving yield; although in extremely dry years early closure did ensure that the crop avoided a drought that reduced the baseline yield substantially. This trait was predicted to have a neutral effect for most years and may be useful in conditions where extremely severe droughts occur. Allowing stomata to remain open even at very low leaf water potentials via leaf osmotic adjustment resulted in continued evapotranspiration and increased the likelihood that the crop experienced a lethal stress before reaching maturity. Reliance on a single physiological factor such as the maintenance of leaf turgor to preserve yield is challenged by such a prediction. Combining traits led to stabilization of yields in poor years but small decreases in good baseline years, although the overall effect over 20 years was positive for yields. A similar conclusion of was also reached by Porter et al. (1995) in modelling the effects of climatic change and genetic modification on nitrogen use by wheat. Such predictions of the modelled effects of traits on crop production need to be tested experimentally. The general conclusion of the Sinclair & Muchow (2001) exercise was that breeding to increase the below-ground exploration of the soil for water is likely to be very beneficial. Reducing the efficiency of radiation ‘conversion’ into dry matter had a lower beneficial effect than slowing canopy development that reduced the demand for water. Altered internal regulation of stomatal sensitivity was predicted to have a neutral or a deleterious effect. Such results sound a warning to the relevance of molecular and other detailed studies of single processes of physiological and biochemical regulation for improving crop production in extreme environments. It is important to initiate a dialogue with molecular and conventional plant breeders to utilize both molecular and computing tools to identify, incorporate and examine the genotype×environment×management (G×E×M) combinations that are likely to prove successful in breeding and cultivating future the crop varieties that will be required to enable humans to feed and clothe themselves.
6. Discussion
Generally, the importance of nonlinearity in governing the response of ecological and biological systems to their environments is recognized. Examples occur at diverse scales of biological organization from the early studies of the chaotic dynamics of plant and animal populations (May 1975) to hormonally regulated feedbacks in plants (e.g. Tardieu & Davies 1992). Consequently, it is clear that representation of the variability of the driving variables that act as inputs to such systems are required. For crop simulation models, these requirements can be met by the use of stochastic weather generators. The advantage of this approach is that the system preserves the statistical properties of generated daily weather sequences, including means, variances, correlation between meteorological variables and type of distributions, for the baseline climate and climate change scenarios. Weather generators can serve as a computationally inexpensive tool to produce high-resolution climate change scenarios incorporating changes in means and climate variability. These changes, derived from GCMs, can be used to alter site-specific parameters of a particular weather generator. Another useful development of the stochastic weather generator component of climate change research would be to adopt it for regional analyses using the generator to interpolate missing data and incorporate topographical features that affect climate at scales relevant for crop growth. Whatever the context, be it assessment of the effects of climatic change on crop performance or the further development of real-time simulations of crop growth, the necessity of recognizing the importance of variability and its interaction with the nonlinear aspects of crop growth will remain at the core of such work. The demonstrated effect of climate variability on simulated crop yields also has implications for experimental studies where we should concentrate on the effects of increasing the variability of experimental treatments, while keeping average differences between experimental and control conditions constant.
Such considerations are important in the light of estimates of the effect of climatic change on agriculture and the world food supply (Adams et al. 1990; Rosenzweig & Parry 1994). These studies have not yet examined the possibility that an increasingly variable climate may prove more serious to food production and trade than a gradually changing one. If the climate becomes more variable then, naturally, the frequency distribution of yields is likely to widen (Semenov et al. 1993) and a short sequence of low yields become more likely with serious consequences for world food production, its trading and distribution.
Both simulation and experimental results have shown that altering the variability of temperature had the same order effect on the development and growth of wheat as changing its mean value. These results support the conclusions of Semenov & Porter (1995), who highlighted the importance of representing changes in both the mean and variability of climatic conditions in order to predict the impact of climatic change on crop development and yield. There need to be further studies, perhaps under Free air CO2 exchange systems (see Long et al. 2005), to link simulation and experimental investigations. Two other points are important for the future, particularly in the context of climate change studies. Climate scientists should recognize the large body of information, often published in non-traditional references such as plant breeding trial reports, that may be useful in defining what can be considered a ‘dangerous’ amount of climate change from the point of view of food production. The clear message from the crop community is that thresholds are well defined, they can be effective over short time-periods and can extensively damage yield productivity, mainly via restrictions on carbon and nitrogen sink formation and activity. Also, there is a need to develop joint modelling and, especially, experimental studies of this topic to examine the predicted degree of temporal overlap between extreme events such as high temperatures and storms and sensitive times in the agricultural calendar or stages of crop development such as flowering and harvest. Crop modelling can predict the timing of stages when crops are sensitive to threshold temperatures; experimental studies can provide the quantitative responses that will permit the modelling effort to progress. In this endeavour, plant scientists could be guided by their zoological colleagues who have very carefully characterized the temperature limits of a range of physiological processes (figure 6; Meats & Khoo 1976, quoted in Cossins & Bowler (1987)). There is a need for equivalent information for the major food crops.
Footnotes
One contribution of 17 to a Discussion Meeting Issue ‘Food crops in a changing climate’.
References
- Adams R.M, Rosenzweig C, Pearl R.M, Ritchie J.T, McCarl B.A, Glyer J.D, Curry R.B, Jones J.W, Boote K.J, Allen L.H., Jr Global climate change and US agriculture. Nature. 1990;345:219–224. doi:10.1038/345219a0 [Google Scholar]
- Al Khatib K, Paulsen G.M. High temperature effects on photosynthetic processes in temperate and tropical cereals. Crop Sci. 1999;39:119–125. [Google Scholar]
- Amthor J.S. Respiration in a future, higher-CO2 world. Plant Cell Environ. 1991;14:13–20. [Google Scholar]
- Bolanos J, Edmeades G.O, Martinez L. Eight cycles of selection for drought tolerance in lowland tropical maize: III. Responses to drought-adaptive physiological and morphological traits. Field Crop Res. 1993;31:269–286. [Google Scholar]
- Bowes G. Growth at elevated CO2: photosynthetic responses mediated through Rubisco. Plant Cell Environ. 1991;14:795–806. [Google Scholar]
- Bracco A, Kucharski F, Kallummal R, Molteni F. Internal variability, external forcing and climate trends in multi-decadal AGCM ensembles. Clim. Dynam. 2004;23:659–678. doi:10.1007/s00382-004-0465-2 [Google Scholar]
- Cane M.A, Eshel G, Buckland R.W. Forecasting Zimbabwean maize yields using eastern equatorial Pacific sea-surface temperature. Nature. 1994;370:204–205. doi:10.1038/370204a0 [Google Scholar]
- Cossins A.R, Bowler K. Temperature biology of animals. Chapman & Hall; London: 1987. [Google Scholar]
- Dai A, Treberth K.E, Karl T.R. Global variation in droughts and wet spells. Geophys. Res. Lett. 1998;25:3367–3370. doi:10.1029/98GL52511 [Google Scholar]
- Drake B.G, Gonzalez-Meier M.A, Long S.P. More efficient plants: a consequence of rising atmospheric CO2? Ann. Rev. Plant Physiol. Plant Mol. Biol. 1997;48:609–639. doi: 10.1146/annurev.arplant.48.1.609. doi:10.1146/annurev.arplant.48.1.609 [DOI] [PubMed] [Google Scholar]
- Easterling D.R, et al. Maximum and minimum temperature trends for the globe. Science. 1997;277:364–367. doi:10.1126/science.277.5324.364 [Google Scholar]
- Easterling D.R, et al. Climate extremes: observations, modelling, and impacts. Science. 2000;289:2068–2074. doi: 10.1126/science.289.5487.2068. [DOI] [PubMed] [Google Scholar]
- Easterling D.R, Evans J.L, Groisman P. Ya, Karl T.R, Kunkel K.E, Ambenje P. Observed variability and trends in extreme climate events: a brief review. Bull. Am. Meteorol. Soc. 2000b;81:417–425. doi:10.1175/1520-0477(2000)081<0417:OVATIE>2.3.CO;2 [Google Scholar]
- Evans L.T, Fischer R.A. Yield potential: its definition, measurement and significance. Crop Sci. 1999;39:1544–1551. [Google Scholar]
- Ewert F. Modelling plant response to elevated CO2: how important is leaf area index? Ann. Bot. 2004;93:619–627. doi: 10.1093/aob/mch101. doi:10.1093/aob/mch101 [DOI] [PMC free article] [PubMed] [Google Scholar]
- Ewert F, Rounsevell M.D.A, Reginster I, Metzger M.J, Leemans R. Future scenarios of European agricultural land use I. Estimating changes in crop productivity. Agr. Ecosyst. Environ. 2005;107:101–116. doi:10.1016/j.agee.2004.12.003 [Google Scholar]
- FAO 2003. Food and Agriculture Organization. http://www.fao.org
- Ferris R, Ellis R.H, Wheeler T.R, Hadley P. Effect of high temperature stress at anthesis on grain yield and biomass of field-grown crops of wheat. Ann. Bot. 1998;82:631–639. doi:10.1006/anbo.1998.0740 [Google Scholar]
- Gerking S.D, Lee R.M. Thermal limits for growth and reproduction in the desert pupfish Cyprinodon n. nevadensis. Physiol. Zool. 1983;56:1–9. [Google Scholar]
- Gilles J. Hikes in surface ozone could suffocate crops. Nature. 2005;435:7. doi: 10.1038/435007a. doi:10.1038/435007a [DOI] [PubMed] [Google Scholar]
- Gooding M.J, Ellis R.H, Shewry P.R, Schofield J.D. Effects of restricted water availability and increased temperature on the grain filling, drying and quality of winter wheat. J. Cereal Sci. 2003;37:295–309. doi:10.1006/jcrs.2002.0501 [Google Scholar]
- Gregory P.J, Ingram J, Campbell B, Goudriaan J, Hunt T, Landsberg J.J, Linder S, Stafford-Smith M, Sutherst B, et al. Managed production systems. In: Walker B, Steffen W, Canadell J, Ingram J, et al., editors. The terrestrial biosphere and global change. Implications for natural and managed ecosystems. Synthesis volume. International Geosphere–Biosphere Program Book Series 4, Cambridge, UK. 1999. pp. 229–270. [Google Scholar]
- IMAGE-team. 2001 The IMAGE 2.2 implementation of the SRES scenarios: a comprehensive analysis of emissions, climate change and impacts in the 21st century. National Institute of Public Health and the Environment (RIVM), Bilthoven, The Netherlands.
- Indermühle A, et al. Holocene carbon-cycle dynamics based on CO2 trapped in ice at Taylor Dome, Antarctica. Nature. 1999;398:121–126. doi:10.1038/18158 [Google Scholar]
- IPCC. Climate change 2001: the scientific basis. Contribution of working group I to the third assessment report of the intergovernmental panel on climate change. In: Houghton J.T, Ding Y, Griggs D.J, Noguer M, van der Linden P.J, Dai X, Maskell K, Johnson C.A, editors. Cambridge University Press; Cambridge, UK: 2001. [Google Scholar]
- Jagtap V, Bhargava S, Streb P, Feierabend J. Comparative effect of water, heat and light stresses on photosynthetic reactions in Sorghum bicolor (L.) Moench. J. Exp. Bot. 1998;49:1715–1725. doi:10.1093/jexbot/49.327.1715 [Google Scholar]
- Jamieson P.D, Semenov M.A. Modelling nitrogen uptake and redistribution in wheat. Field Crop Res. 2000;68:21–29. doi:10.1016/S0378-4290(00)00103-9 [Google Scholar]
- Jamieson P.D, Semenov M.A, Brooking I.R, Francis G.S. Sirius: a mechanistic model of wheat response to environmental variation. Eur. J. Agron. 1998;8:161–179. doi:10.1016/S1161-0301(98)00020-3 [Google Scholar]
- Kettlewell P.S, Sothern R.B, Koukkari W.L. UK wheat quality and economic value are dependent on the North Atlantic Oscillation. J. Cereal Sci. 1999;29:205–209. doi:10.1006/jcrs.1999.0258 [Google Scholar]
- Kimball B.A, Kobyashi K, Bindi M. Responses of agricultural crops to free air CO2 enrichment. Adv. Agron. 2002;77:293–368. [PubMed] [Google Scholar]
- Long S.P, Ainsworth E.A, Rogers A, Ort D.R. Rising atmospheric carbon dioxide: plants FACE the future. Annu. Rev. Plant Biol. 2004;55:591–628. doi: 10.1146/annurev.arplant.55.031903.141610. doi:10.1146/annurev.arplant.55.031903.141610 [DOI] [PubMed] [Google Scholar]
- Long S.P, Ainsworth E.A, Leakey A.D.B, Morgan P.B. Global food insecurity. Treatment of major food crops with elevated carbon dioxide or ozone under large-scale fully open-air conditions suggests recent models may have overestimated future yields. Phil. Trans. R. Soc. B. 2005;360:2011–2020. doi: 10.1098/rstb.2005.1749. doi:10.1098/rstb.2005.1749 [DOI] [PMC free article] [PubMed] [Google Scholar]
- Ludlow M.M, Muchow R.C. A critical evaluation of traits for improving crop yields in water-limited environments. Adv. Agron. 1990;43:107–153. [Google Scholar]
- Maheswari M, Joshi D.K, Saha R, Nagarajan S, Gambhir P.N. Transverse relaxation time of leaf water protons and membrane injury in wheat (Triticum aestivum L.) in response to high temperature. Ann. Bot. 1999;84:741–745. doi:10.1006/anbo.1999.0974 [Google Scholar]
- Mann M.E, Bradley R.S, Hughes M.K. Global-scale temperature patterns and climate forcing over the past six centuries. Nature. 1998;392:779–787. doi:10.1038/33859 [Google Scholar]
- Martre P, Porter J.R, Jamieson P.D, Triboï E. Modeling grain nitrogen accumulation and protein composition to understand the sink/source regulations of nitrogen remobilization for wheat. Plant Physiol. 2003;133:1959–1967. doi: 10.1104/pp.103.030585. doi:10.1104/pp.103.030585 [DOI] [PMC free article] [PubMed] [Google Scholar]
- Mastrandrea M.D, Schneider S.H. Probabilistic integrated assessment of ‘dangerous’ climate change. Science. 2004;304:571–575. doi: 10.1126/science.1094147. doi:10.1126/science.1094147 [DOI] [PubMed] [Google Scholar]
- May R.M. Deterministic models with chaotic dynamics. Nature. 1975;256:165–166. doi:10.1038/256165a0 [Google Scholar]
- Meats A, Khoo K.C. The dynamics of ovarian maturation and oocyte resorption in Queensland fruit fly, Dacus tryoni, in daily rhythmic and constant temperature regimes. Physiol. Entomol. 1976;1:213–221. [Google Scholar]
- Moberg A, Sonechkin D.M, Holmgren K, Datsenko N.M, Karlén W. Highly variable Northern Hemisphere temperatures reconstructed from low- and high-resolution proxy data. Nature. 2005;433:613–617. doi: 10.1038/nature03265. doi:10.1038/nature03265 [DOI] [PubMed] [Google Scholar]
- Monteith J.L. Presidential address to the royal meteorological society. Q. J. Royal Meteor. Soc. 1981;107:749–774. doi:10.1256/smsqj.45401 [Google Scholar]
- Moot D.J, Henderson A.L, Porter J.R, Semenov M.A. Temperature, CO2 and the growth and development of wheat: changes in the mean and variability of growing conditions. Clim. Change. 1996;33:351–368. doi:10.1007/BF00142583 [Google Scholar]
- Muchow R.C, Carberry P.S. Environmental control of phenology and leaf growth in a tropically adapted maize. Field Crops Res. 1989;20:221–236. doi:10.1016/0378-4290(89)90081-6 [Google Scholar]
- Muchow R.C, Carberry P.S. Phenology and leaf area development in a tropical grain sorghum. Field Crops Res. 1990;23:221–237. doi:10.1016/0378-4290(90)90056-H [Google Scholar]
- Nakicenovic N, Swart R, editors. Emissions scenarios 2000. Special report of the Intergovernmental Panel on Climate Change. Cambridge University Press; Cambridge, UK: 2000. [Google Scholar]
- Neelin J.D, et al. ENSO theory. J. Geophys. Res. 1998;103:14 261–14 290. doi:10.1029/97JC03424 [Google Scholar]
- Olesen J.E, Bindi M. Consequences of climate change for European agricultural productivity, land use and policy. Eur. J. Agron. 2002;16:239–262. [Google Scholar]
- Phillips J, Cane M.A, Rosenzweig C. ENSO, seasonal rainfall patterns and maize yield variability in Zimbabwe. Agr. Forest Meteorol. 1998;90:39–50. doi:10.1016/S0168-1923(97)00095-6 [Google Scholar]
- Porter J.R. Rising temperatures are likely to reduce crop yields. Nature. 2005;436:174. doi: 10.1038/436174b. doi:10.1038/436174b [DOI] [PubMed] [Google Scholar]
- Porter J.R, Gawith M. Temperatures and the growth and development of wheat: a review. Eur. J. Agron. 1999;10:23–36. doi:10.1016/S1161-0301(98)00047-1 [Google Scholar]
- Porter J.R, Semenov M.A. Climatic variability and crop yields in Europe. Nature. 1999;400:724. doi:10.1038/23385 [Google Scholar]
- Porter J.R, Leigh R.A, Semenov M.A, Miglietta F. Modelling the effects of climatic change and genetic modification on nitrogen use by wheat. Eur. J. Agron. 1995;4:419–429. [Google Scholar]
- Ray J.D, Sinclair T.R. Stomatal closure of maize hybrids in response to drying soil. Crop Sci. 1997;37:803–807. [Google Scholar]
- Rosenzweig C, Parry M.L. Potential impact of climate change on world food supply. Nature. 1994;337:133–138. doi:10.1038/367133a0 [Google Scholar]
- Salih A.A, Ali I.A, Lux A, Luxova M, Cohen Y, Sugimoto Y, Inanaga S. Rooting, water uptake and xylem structure adaptation to drought of two sorghum cultivars. Crop Sci. 1999;39:168–173. [Google Scholar]
- Schär C, Vidale P.L, Lüthi D, Frei C, Häberli C, Liniger M.A, Appenzeller C. The role of increasing temperature variability in European summer heatwaves. Nature. 2004;427:332–336. doi: 10.1038/nature02300. [DOI] [PubMed] [Google Scholar]
- Schlesinger M.E, et al. Geographical distributions of climate change due to a shutdown of the thermohaline circulation. In: Schlesinger M.E, et al., editors. Human-induced climate change: an interdisciplinary assessment. Cambridge University Press; Cambridge, UK: 2005. [Google Scholar]
- Semenov M.A, Barrow E.M. Use of a stochastic weather generator in the development of climate change scenarios. Clim. Change. 1997;35:397–414. doi:10.1023/A:1005342632279 [Google Scholar]
- Semenov M.A, Porter J.R. Climatic variability and the modelling of crop yields. Agr. Forest Meteorol. 1995;73:265–283. doi:10.1016/0168-1923(94)05078-K [Google Scholar]
- Semenov M.A, Porter J.R, Delécolle R. Climatic change and the growth and development of wheat in the UK and France. Eur. J. Agron. 1993;2:293–304. [Google Scholar]
- Shrode J.B, Gerking S.D. Effects of constant and fluctuating temperatures on reproductive performance of a desert pupfish Cyprinodon n. nevadensis. Physiol. Zool. 1977;201:1–20. [Google Scholar]
- Sinclair T.R, Muchow R.C. Systems analysis of plant traits to increase grain yield on limited water supplies. Agron. J. 2001;93:263–270. [Google Scholar]
- Slafer G.A, Rawson H.M. Base and optimum temperatures vary with genotype and stage of development in wheat. Plant Cell Environ. 1995;18:671–679. [Google Scholar]
- Smith I.N, Dix M.R, Allan R.J. The effect of greenhouse SSTs on ENSO simulations with an AGCM. J. Clim. 1997;10:342–352. doi:10.1175/1520-0442(1997)010<0342:TEOGSO>2.0.CO;2 [Google Scholar]
- Soussana J.F, Besle J.M, Chabaux I, Loiseau P. Long-term effects of CO2 enrichment and temperature on forage quality in a temperate grassland. In: Buchanan-Smith J.G, Bailey L.D, McCaughey P, editors. Proc. XVIII Grassland Congress. International Grassland Society; Saskatoon, Canada: 1997. pp. 23–24. [Google Scholar]
- Tardieu F, Davies W.J. Stomatal response to abscisic acid is a function of plant water status. Plant Physiol. 1992;98:540–545. doi: 10.1104/pp.98.2.540. [DOI] [PMC free article] [PubMed] [Google Scholar]
- Triboï E, Martre P, Triboï-Blondel A.M. Environmentally-induced changes of protein composition for developing grains of wheat are related to changes in total protein content. J. Exp. Bot. 2003;54:1731–1742. doi: 10.1093/jxb/erg183. doi:10.1093/jxb/erg183 [DOI] [PubMed] [Google Scholar]
- Vara Prasad P.V, Craufurd P.Q, Summerfield R.J, Wheeler T.R. Effects of short-episodes of heat stress on flower production and fruit-set of groundnut (Arachis hypogaea L.) J. Exp. Bot. 2000;51:777–784. doi: 10.1093/jexbot/51.345.777. doi:10.1093/jexbot/51.345.777 [DOI] [PubMed] [Google Scholar]
- Wallwork M.A.B, Jenner C.F, Lougue S.J, Sedgley M. Effect of high temperature during grain-filling on the structure of developing and malted barley grains. Ann. Bot. 1998;82:587–599. doi:10.1006/anbo.1998.0721 [Google Scholar]
- Wheeler T.R, Crauford P.Q, Ellis R.H, Porter J.R, Vara Prasad P.V. Temperature variability and the yield of annual crops. Agr. Ecosyst. Environ. 2000;82:159–167. doi:10.1016/S0167-8809(00)00224-3 [Google Scholar]
- Wollenweber B, Porter J.R, Schellberg J. Lack of interaction between extreme high-temperature events at vegetative and reproductive growth stages in wheat. J. Agron. Crop Sci. 2003;189:142–150. doi:10.1046/j.1439-037X.2003.00025.x [Google Scholar]
- Zheng X.G, Sugi M, Frederiksen C.S. Interannual variability and predictability in an ensemble of climate simulations with the MRI-JMA AGCM. J. Meteorol. Soc. Jpn. 2004;82:1–18. doi:10.2151/jmsj.82.1 [Google Scholar]


