

Abstract
A comprehensive assessment of the impacts of climate change on agro-ecosystems over this century is developed, up to 2080 and at a global level, albeit with significant regional detail. To this end an integrated ecological–economic modelling framework is employed, encompassing climate scenarios, agro-ecological zoning information, socio-economic drivers, as well as world food trade dynamics. Specifically, global simulations are performed using the FAO/IIASA agro-ecological zone model, in conjunction with IIASAs global food system model, using climate variables from five different general circulation models, under four different socio-economic scenarios from the intergovernmental panel on climate change. First, impacts of different scenarios of climate change on bio-physical soil and crop growth determinants of yield are evaluated on a 5′×5′ latitude/longitude global grid; second, the extent of potential agricultural land and related potential crop production is computed. The detailed bio-physical results are then fed into an economic analysis, to assess how climate impacts may interact with alternative development pathways, and key trends expected over this century for food demand and production, and trade, as well as key composite indices such as risk of hunger and malnutrition, are computed. This modelling approach connects the relevant bio-physical and socio-economic variables within a unified and coherent framework to produce a global assessment of food production and security under climate change. The results from the study suggest that critical impact asymmetries due to both climate and socio-economic structures may deepen current production and consumption gaps between developed and developing world; it is suggested that adaptation of agricultural techniques will be central to limit potential damages under climate change.
Keywords: agriculture, crop production, climate change, food security, sub-Saharan Africa, risk of hunger
1. Introduction
There is significant concern about the impacts of climate change and its variability on agricultural production worldwide. First, issues of food security figure prominently in the list of human activities and ecosystem services under threat of dangerous anthropogenic interference on Earth's climate (Watson et al. 2000; IPCC 2001a,b; Ecosystem Millennium Assessment 2005; see also article II, UNFCCC). Second, each country is naturally concerned with potential damages and benefits that may arise over the coming decades from climate change impacts on its territory as well as globally, since these will affect domestic and international policies, trading patterns, resource use, regional planning and ultimately the welfare of its people.
Current research confirms that while crops would respond positively to elevated CO2 in the absence of climate change (e.g. Kimball et al. 2002; Jablonski et al. 2002; Ainsworth & Long 2005), the associated impacts of high temperatures, altered patterns of precipitation and possibly increased frequency of extreme events such as drought and floods, will probably combine to depress yields and increase production risks in many world regions, widening the gap between rich and poor countries (e.g. IPCC 2001a,b). A consensus has emerged that developing countries are more vulnerable to climate change than developed countries, because of the predominance of agriculture in their economies, the scarcity of capital for adaptation measures, their warmer baseline climates and their heightened exposure to extreme events (Parry et al. 2001). Thus, climate change may have particularly serious consequences in the developing world, where some 800 million people are undernourished. Of great concern is a group of more than 40 ‘least-developed’ countries, mostly in sub-Saharan Africa, where domestic per capita food production declined by 10% in the last 20 years (e.g. UN Millennium Project 2005).
Many interactive processes determine the dynamics of world food demand and supply: agro-climatic conditions, land resources and their management are clearly a key component, but they are critically affected by distinct socio-economic pressures, including current and projected trends in population growth, availability and access to technology and development. In the last three decades, for instance, average daily per capita intake has risen globally from 2400 to 2800 cal (from 10 to 12 MJ), spurred by economic growth, improved production systems, international trade and globalization of food markets. Feedbacks of such growth patterns on cultures and personal taste, lifestyle and demographic changes have in turn led to major dietary changes—mainly in developing countries, where shares of meat, fat and sugar to total food intake have increased by about 40% (e.g. Fischer et al. 2002b).
Given the virtual impossibility to test experimentally, or to simply try to sum up in a linear fashion all relevant agro-climatic and socio-economic factors involved in determining long-term future trends, it is no surprise that the scientific literature is replete with modelling studies attempting to assess at least some of the aspects likely to characterize the impacts of climate change on future agricultural production. There is a wealth of site-specific, regional and/or national short- and long-term assessments of climate change impacts performed to date (e.g. Rosenzweig et al. 2002; Tubiello et al. 2002; Olesen & Bindi 2002; Reilly et al. 2003). Global assessments of climate change on food production have been less frequent (i.e. Rosenzweig & Parry 1994; Fischer et al. 2002b; Parry et al. 2004), due in part to the difficulties of gathering comprehensive global agro-climatic datasets, in part to the need to employ global trade economic models (see below), as well as due to the significant computer resources required.
Such assessment studies have focused mainly on agro-climatic components, including simplified approaches to simulating adaptation responses, i.e. changes in agro-technology that enable farmers to minimize risks and/or maximize profits under changed climates. Focus of assessment studies with adaptation has either been on explicit, simple farm-level adaptation strategies; or on implicit, market-driven response functions (see, for discussion, Rosenzweig & Tubiello in press). The first approach is local, allowing for agro-technological detail, but lacking key regional market feedbacks. It includes on-site evaluation of strategies such as early planting, use of cultivars better adapted to altered climates or modifications to water and/or fertilizer levels. The second approach better includes agro-economic dynamics over a region, but cannot provide specific technical solutions. It includes generalized strategies such as regional shifting of cropping systems and management; responses based on pesticide and/or fertilizer use, etc. Furthermore, local studies with crop models allow for better calibration and validation compared to regional approaches.
Clearly, both methodologies are necessary in order to conduct more realistic regional studies. In addition, and importantly, local to regional effects of global food trade would need to be included within either approach. This is because international trade can greatly modify the regional dynamics of food demand, production and supply under present climate, and thus significantly modulate impacts under climate change (e.g. Reilly et al. 2001; Tubiello 2005).
This paper presents an integrated ecological–economic modelling framework for the assessment of the world food system in the twenty-first century, under various future scenarios of population, economic growth and climate change. In short, the questions we address herein are as follows: what are the likely impacts of climate change on the world's agricultural resources? How do climate impacts compare to socio-economic pressures over this century? Where and how do significant interactions arise? A few previous studies, notably Rosenzweig & Parry (1994), FAO (2003) and Parry et al. (2004), have employed various components of the FAO–IIASA methodology to address these same questions; we believe, however, that this is the first time that a fully coherent, unified data and modelling system has been used.
Specifically, we employ the FAO–IIASA agro-climatic database and modelling framework known as the agro-ecological zones or AEZ, model (e.g. Fischer et al. 2002a,b), in conjunction with four socio-economic scenarios defined by IPCC and the IIASA world food system or basic linked system (BLS) (Fischer et al. 1988, 2002b; Parry et al. 1999) (figure 1).
Figure 1.
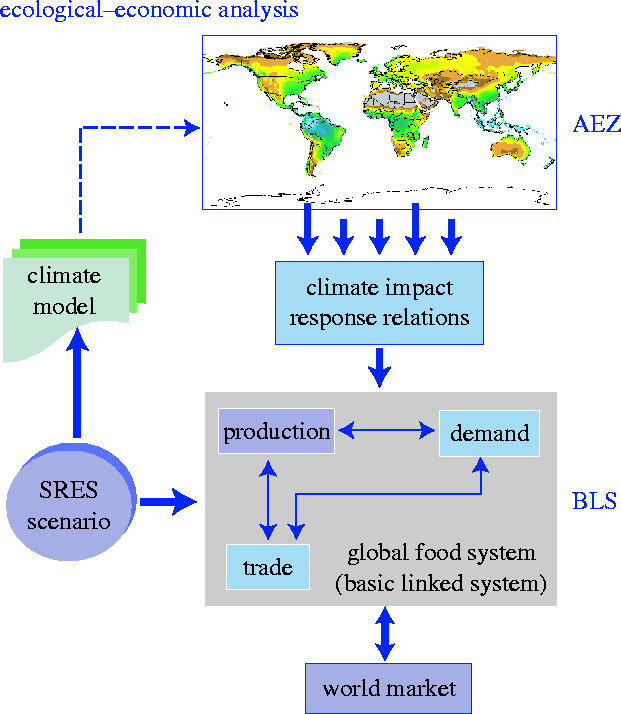
Graphic description of the AEZ–BLS modelling framework. Socio-economic SRES scenarios determine both climatic and market conditions under which AEZ and BLS are run. Climatic impacts on agricultural production—computed with AEZ, are passed on to the agricultural economics and trade model, BLS, to determine overall impacts on world food systems.
The main simulation results of the study herein presented include climate change impacts on agro-climatic resources, potential arable land and related changes in crop production patterns. Our economic analyses assess over this century changes to food demand, production, trade and prices and the scale and location of risk of hunger.
2. Material and Methods
The combination of a spatially detailed bio-physical/agronomic assessment tool and a global food system model provides an integrated ecological–economic framework for the assessment of the impacts of climate change and agricultural vulnerability (figure 1). The focus has been on analysing the current and future availability and use of regional and global land resources, in the context of technological and environmental changes, including climate change and climate variability.
(a) AEZ modelling methodology
Because of the complex interactions between climate, agro-ecosystem dynamics and human management at farm to regional level, assessment studies of the impacts of climate change on agriculture have involved the use of computer simulations that link climate predictions of general circulation models (GCMs) together with crop models and land management decision tools of various kinds (e.g. Tubiello & Ewert 2002). Specific dynamic crop models such as DSSAT (e.g. Tsuji et al. 1994; Rosenzweig et al. 1995), EPIC (e.g. Williams et al. 1984), etc. or simpler, modified ecosystem models, such as TEM (e.g. Feltzer et al. 2004), have been employed for computing crop growth, water dynamics and harvest yield, as a function of soil, climate and management data. The first set of models is more agronomic in nature, allowing for computation of many details of a crop life cycle that might be important for final yield—such as differential climatic and management impacts during vegetative versus flowering stages, etc.—and that are often missed by the simpler ecosystem models. Likewise, the first set of crop models allows for simulation of more realistic field management activities such as type of water and fertilizer management, sowing and harvesting operations, etc. For these reasons, dynamic crop models require many input data for calibration and validation, and perform best at local to national scales, provided sufficiently detailed ‘representative sites’ can be found to cover the area of study (e.g. Tubiello et al. 2002). On the other hand, simplified ecosystem models employ generalized crop algorithms and are better suited to large-scale simulations, requiring less detailed input data to run; yet they may be prone to larger errors and problematic validation, due to lack of both crop and management detail.
The AEZ modelling framework synthesizes essential components of both the crop and ecosystem models described above. It uses detailed agronomic-based knowledge to simulate land resources availability and use, farm-level management options and crop production potentials; at the same time, it employs detailed spatial bio-physical and socio-economic datasets to distribute its computations at fine gridded intervals over the entire globe (e.g. Fischer et al. 2002a). This land-resources inventory is used to assess, for specified management conditions and levels of inputs, the suitability of crops in relation to both rainfed and irrigated conditions, and to quantify expected attainable production of cropping activities relevant to specific agro-ecological contexts characterizing the study area. The characterization of land resources includes components of climate, soils, landform and present land-cover. Crop modelling and environmental matching procedures are used to identify crop-specific environmental limitations, under various levels of inputs and management conditions.
Specifically, AEZ employs the FAO/UNESCO digital soil map of the world (DSMW) as the underlying reference for its own land surface database, consisting of more than 2.2 million grid cells at 5′×5′ latitude/longitude, i.e. with a size of about 10×10 km at the equator. In addition, a global digital elevation map (DEM) and derived slope distribution database is linked to DSMW. AEZs current climate database is based on the climate research unit (CRU) of the University of East Anglia, consisting of historical monthly mean data (mean monthly minimum temperature, mean monthly maximum temperature, precipitation, solar radiation, vapour pressure deficit) for the period 1901–1996, and including a monthly mean climatology based on the decades 1960–1990. In AEZ, the CRU data are transformed into daily data and analysed vis-à-vis crop requirements (e.g. Fischer et al. 2002a). Finally, AEZ employs a land-cover/land-use layer specifying distributions of aggregate land-cover classes, as derived from global 1 km land-cover datasets from NOAA AVHRR and GLC2000, respectively. The AEZ global land resources database incorporates spatial delineation and accounting of forest and protected areas. In terms of key socio-economic datasets, AEZ employs a global population data set calibrated for the year 2000, including estimates of spatially explicit population distribution and densities for each country.
In summary, the AEZ framework contains the following basic elements:
land resources database, containing geo-referenced climate, soil and terrain data;
land utilization types (LUT) database of agricultural production systems, describing crop-specific environmental requirements and adaptability characteristics, including input level and management;
mathematical procedures for matching crop LUT requirements with AEZs data, including potentially attainable crop yields estimates, by land unit and grid-cell (AEZ global assessment assesses 2.2 million grid cells, covering a 5′×5′ latitude/longitude grid, based on a 1 : 5 000 000 scale global soil map);
assessments of crop suitability and land productivity; and
applications for agricultural development planning.
As a part of its assessment, the AEZ model computes amounts of non-arable and arable land, as a function of environmental constraints. Land is classified as having severe constraints (either too cold, too wet, too steep or having serious soil quality constraints); moderate, slight or no constraints to cultivation. Classification is also made between rainfed and irrigated land, depending on water deficits computed internally as precipitation minus evapo-transpiration.
The AEZ model had been validated for use in agricultural resource assessment and employed in many studies, both regionally and globally (e.g. Fischer & Sun 2001; Fischer et al. 2002a; ). Importantly, AEZ is one of the main tools used by FAO for analyses of present and future land resources, both regionally and globally (e.g. FAO 2003).
In this study, following the approach of several previous assessments of world food production, we have chosen to focus on cereal-production (including wheat, maize and other coarse grains) as a proxy for global world agricultural production. Cereals, in fact account for over two-thirds of average caloric intake, and provide most human protein supply either via direct consumption or indirectly via cereal livestock feed (e.g. Fischer et al. 2002b; FAO 2003).
(b) World agricultural trade and economic modelling
In addition to land resource assessment and computation of potentially attainable yield, the analysis includes an agro-economic model for the estimation of actual regional production and consumption. The BLS developed at IIASA comprises a series of national and regional agricultural economic models. It provides a framework for analysing the world food system, viewing national agricultural components as embedded in national economies, which in turn interact with each other at the international trade level (e.g. Fischer et al. 2002a,b). The BLS model consists of 34 national and regional geographical components covering the globe, calibrated and validated over past time windows (e.g. Fischer et al. 1988, 1994) and successfully reproduces regional consumption, production and trade of major agricultural commodities in 2000. Several applications of the BLS to climate-change impact analysis have been published, e.g. in Rosenzweig & Parry (1994), Fischer et al. (1996) and Parry et al. (1999, 2004).
The individual national/regional models are linked together by means of a world market, where international clearing prices are computed to equalize global demand with supply. The BLS is formulated as a recursively dynamic system, working in successive annual steps. Each individual model component focuses primarily on the agricultural sector, but attempts to represent the whole economy as necessary to capture essential dynamics among capital, labour and land. For the purpose of subsequent international linkage, production, consumption and trade of goods and services are aggregated into nine main agricultural sectors, though individual regional models have more detail. The nine agricultural sectors include: wheat, rice, coarse grains, bovine and ovine meat, dairy products, other meat and fish, protein feeds, other food, non-food agriculture. The rest of the economy is coarsely aggregated into one simplified non-agricultural sector. Agricultural commodities may be used within BLS for human consumption, feed, intermediate consumption and stock accumulation. The non-agricultural commodity may contribute as investment, and for processing and transporting agricultural goods. All physical and financial accounts are balanced and mutually consistent: the production, consumption and financial ones at the national level and the trade and financial flows at the global level.
Within each regional unit, the supply modules allocate land, labour and capital as a function of the relative profitability of its different economic sectors. In particular, actual cultivated acreage is computed from agro-climatic land parameters (derived from AEZ) and profitability estimates. Once acreage, labour and capital are assigned to cropping and livestock activities, actual yields and livestock production is computed as a function of fertilizer applications, feed rates and available technology.
Population growth and technology are key external inputs to BLS. Population numbers and projected incomes are used to determine demand for food for the period of study. Technology affects BLS yield estimates, by modifying the efficiency of production per given units of input (e.g. Fischer et al. 2002a,b). For simulations of historical periods up to the present, population data are taken from official UN data at country-level, while the rate of technical progress can be estimated from past agricultural performance. For simulations into the future, scenarios of socio-economic development and population growth must be chosen in order to inform BLS computations. Another key external input to AEZ/BLS is climate and environment, which determine crop suitability and potential yields used by the economic model as an input in resource allocation. Thus, projected climate change affects BLS results indirectly yet significantly, via its impacts on agro-climatic land resources computed by AEZ.
(c) Socio-economic scenario generation
In order to assess agricultural development over this century, with or without climate change, it is necessary to first make some coherent assumptions about how key socio-economic drivers of food systems might evolve over the same period. To this end, we used plausible socio-economic development paths, as specified in the IPCC special report on emissions scenarios (SRES) (IPCC 2000, 2001a,b). The SRES scenarios have been constructed to explore socio-economic development and related pressures on the global environment in this century, with special reference to emissions of greenhouse gases into the atmosphere (see notes in table 1). Within this context, climate change is clearly seen as the consequence of complex social, economic and environmental interactions, possibly modulated by the capacity to mitigate and adapt regionally and globally. Emissions of greenhouse gases connected to specific SRES scenarios are translated into projections of climate change over this century by using GCMs. We used projections available from IPCC data distribution centre (DDC) and the CRU, corresponding to five emission scenarios: A1FI, A1B, A2, B1 and B2 (see table 1).
Table 1.
Summary of SRES development scenarios and GCM outputs used in this study.
| scenario/model | HADCM3 | ECHAM | CSIRO | CGCM2 | NCAR-PCM |
|---|---|---|---|---|---|
| A1FI | × | ||||
| A1B | × | ||||
| A2 | × | × | × | × | × |
| B2 | × | × | × | × | × |
| B1 | × | × |
A total of 14 combinations of socio-economic and climate scenarios were used. Notes on climate models: HadCM3 is a coupled atmosphere–ocean GCM developed at the UK Hadley Centre for Climate Prediction and Research and is described by Gordon et al. (2000) and Pope et al. (2000). The coupled global model ECHAM4/OPYC3 was developed in co-operation between the Max-Planck-Institut Für Meteorologie (MPI) and Deutsches Klimarechenzentrum (DKRZ) in Hamburg, Germany. (Roeckner et al. 1992; Oberhuber 1993; Roeckner et al. 1996). The Commonwealth Scientific and Industrial Research Organization (CSIRO) coupled model involves global atmospheric, oceanic, sea-ice, and biospheric sub-models (Gordon & O'Farrell 1997; Hirst et al. 1997). The Canadian Center for Climate Modelling and Analysis obtained results for SRES emission scenarios with the second version of the Canadian Global Coupled Model (CGCM2) (Flato et al. 2000). The Parallel Climate Model (NCAR-PCM) operated at the National Center for Atmospheric Research (NCAR) has been sponsored by the US Department of Energy (DOE) and is a joint effort involving several research laboratories in the United States. Details of the PCM control run were described in Washington et al. (2000). Notes on SRES scenarios. Scenario A1 represents a future world of very rapid economic growth, low population growth, and rapid introduction of new and more efficient technologies. Major underlying themes are economic and cultural convergence and capacity building, with a substantial reduction in regional differences in per capita income. The A1 scenario family develops into three groups that describe alternative directions of technological change in the energy system: fossil-intensive (A1FI), non-fossil energy sources (A1T), or a balance across all sources (A1B). Scenario A2 portrays a very heterogeneous world. The underlying theme is that of strengthening regional cultural identities; with high population growth rates, and less concern for rapid economic development. Scenario B1 represents a convergent world with rapid change in economic structures, ‘dematerialization’, and introduction of clean technologies. The emphasis is on global solutions to environmental and social sustainability, including concerted efforts for rapid technology development, dematerialization of the economy, and improving equity. Scenario B2 depicts a world in which the emphasis is on local solutions to economic, social and environmental sustainability. It is again a heterogeneous world with less rapid, and more diverse technological change.
The following methodology was developed for application of GCM and SRES scenarios to the AEZ–BLS framework. For use in AEZ, projected GCM changes were interpolated to a grid of 0.5°×0.5° latitude/longitude and applied to the baseline climate period of 1961–1990 (see also following section). Application of SRES scenarios to BLS were realized via the following steps. First, UN-based SRES population growth rates were either incorporated for individual countries or aggregated to BLS regions. In order to maintain consistency with SRES structure, the BLS 34 regions were further aggregated to 11, following SRES. We then let BLS dynamically compute allocation of labour and capital between agriculture and non-agriculture as a function of specified economic conditions. Second, BLS runs were harmonized with SRES specifications. The approach chosen was to harmonize rates of economic growth generated in the BLS with those projected in the IPCC-SRES scenarios, through adjustment of capital investment (saving rates) and of rates of technical progress in non-agricultural sectors. The harmonization of production factors and GDP, individually for each decade during the period 1990–2080, was carried out on a region-by-region basis.
In order to address the research questions formulated in the introduction of this paper, namely the impacts of climate change on agriculture and the interactions with concomitant socio-economic pressures over this century, we devised a two-step simulation strategy involving AEZ–BLS simulations under different SRES scenarios, with and without climate change. The latter set includes the combined impacts of socio-economic variables and climate, in particular higher temperature, modified rainfall patterns and elevated carbon dioxide (CO2) concentrations, with respect to current conditions. In either case, modifications to potentially attainable yields computed in AEZ were input into the BLS, and resulting changes were analysed globally and regionally, with special attention to food balances in sub-Saharan Africa.
(d) Climate change scenario generation
GCMs represent one powerful tool to generate characteristics of future climates under anthropogenic forcing, i.e. under present and projected future emissions of greenhouse gases (e.g. IPCC 2001a). Their use in climate-change impact assessment studies is widespread (e.g. Reilly et al. 2001; IPCC 2001b). Importantly, GCMs provide internally coherent climate dynamics, by solving globally all climate-relevant physical equations. Yet, it is well known that GCM projections present significant uncertainties, due in part to issues of scale resolution, leading to incomplete model representation of regional climate systems; and in part to imperfect understanding of key climate dynamics, such as water vapour–cloud feedbacks (e.g. IPCC 2001a). For instance, the earth climate sensitivity, defined as mean global planetary temperature response to a doubling of CO2 levels (ca 560 ppm) in the atmosphere, is thought to be in the 1.5–4.5 °C range (IPCC 2001a). Though GCMs simulations fall squarely within this range, future climate projections with GCMs corresponding to lower and upper values may be different in terms of projected global warming. More importantly, even among GCMs with similar temperature change simulations, predictions of regional precipitation responses may vary significantly, due in part to the intrinsic chaotic nature of climate, and in part to differences in model approach to resolving local to regional atmospheric dynamics.
As a final methodological issue, we developed climate change scenarios based on five GCMs: HadCM3, ECHAM4, CSIRO, CGCM2 and NCAR, for application to AEZ (table 1). Climate sensitivity of the first four sets of models is in the upper range previously discussed, while the NCAR model has lower climate sensitivity (R. Dickinson 2003, personal communication). This climate sensitivity factor and related temperature–CO2 correlation were shown visually by pooling mean annual temperature predictions of all models against CO2 concentrations (a proxy for time, as CO2 may increase at a rate of 0.5–1% per annum over this century) over land. At the same time, there was some correlation between climate projections of mean annual temperature and precipitation over land at mid-to-high latitudes (figure 2a), where most developed countries are located, but none at tropical latitudes (figure 2b), where most developing countries are located.
Figure 2.

GCM-predicted mean annual temperature change over land, as a function of corresponding CO2 concentrations (a proxy for time from 1990 to 2080) and against GCM-predicted mean annual precipitation change. Graphs show results for all 14 scenarios considered in this study, computed for all land in (a) developed world and (b) developing world.
In order to run simulations with the AEZ model under climate change, for each GCM considered we applied the following standard methodological solution. For three 30-year periods up to 2100 (the 2020s: years 2010–2040, the 2050s: years 2040–2070 and the 2080s: years 2070–2100), climate change parameters were computed at each grid point by comparing GCM monthly mean prediction for that decade, to those corresponding to the GCM ‘baseline’ climate 1960–1990. Such changes (i.e. delta differences for temperature; ratios for precipitation, etc.) were then applied to the observed climate of 1960–1990, used in AEZ, to generate future climate data. AEZ was then run for each future period, and its results compared to its climatic baseline.
(e) Limitations of modelling framework
Simulation models provide a valid, and often the only available, tool used in investigations of complex interactions and feedbacks of many variables. As discussed, simulation impact assessment studies are widely used for projecting climate change and socio-economic effects on human activities. It is thus important to discuss limits and uncertainties linked to such exercises, so that results can be better interpreted and used by the wider public.
First, as discussed in §2d, there is uncertainty in the magnitude of climate change and its spatial and temporal distribution. For these reasons, GCMs results must be considered as representative of physically plausible future climates, rather than exact predictions. As a consequence, when developing assessment studies for climate change for agriculture, and given the prominent role played by rainfed production worldwide, it is very important not to depend on one GCM alone, but to use several climate predictions (Tubiello & Ewert 2002). Particularly in agriculture, the direction of predicted precipitation can largely shape regional results. At the same time, the GCM simulations used herein do not contain information on potential changes in the frequency of extreme events, so that our projected results might be greatly modified, probably in negative terms, had climate variability changes been included.
Second, the AEZ modelling simulations have been validated in many places, but the global nature of simulations signifies that validation has of course not been possible at every grid point considered. In addition, the gap between current actual yields and potentially attainable yields in many developing countries is much larger than the impacts of climate changes on potential yields, which increases uncertainty as to what actual effects of climate change on yields will be. Likewise, AEZ-simulated crop response to elevated CO2, derived from experimental data, may be larger than actually possible at farm levels.
Third, our simulation results depend strongly on BLS dynamics. Although this model has been validated for past periods, various additional and uncertain assumptions are needed to obtain food system projections (e.g. technical progress in crop yields; regional irrigation development; changes in food preferences, etc.). Nonetheless, as discussed for GCM models, BLS provides an internally coherent picture of socio-economic dynamics, so that its predictions represent plausible futures for scenario analysis.
Finally, the SRES scenarios considered herein have recently been criticized for their regional economic growth patterns, regarded as too strong when compared to historical data (e.g. Nakicenovic et al. 2003). It may be noted that we have also simulated lower economic growth scenarios. In these, the ability to adjust to climate change computed by BLS has been smaller, leading to more negative impacts than those presented herein. In addition, SRES A2 is regarded as having population growth rates beyond the current UN high projections. The results obtained under this socio-economic path may thus be regarded as providing a worst case scenario for our food system analysis.
3. Analysis of results
(a) Impacts of climate change on agricultural resources
We first employed climate change projections from five GCMs to investigate how higher temperatures, modified precipitation patterns and elevated CO2 level predicted for the next decades, up to 2100, might combine to affect key agronomic parameters such as land suitability of cereal-production and attainable yields, in combination with management responses. Specifically, AEZ automatically simulated new crop calendars and altered planting and harvesting operations based on the new climate scenarios. In addition, AEZ allowed for automatic shifting of crops and cultivars, based on changes in temperature, precipitation and soil moisture conditions. The latter is computed as the difference between precipitation and evapo-transpiration, including infiltration and runoff as a function of soil type.
(i) Land resources
The agro-climatic assessment with climate projections of five GCMs shows a northward shift of thermal regimes, reducing significantly boreal and arctic ecosystems (60% reduction of current total 2.1 billion hectares). In contrast, tropical zones expand, which means, for example, that apart from a very small stretch in South Africa and a narrow fringe along the Mediterranean coast, the tropics will cover almost all of Africa.
Four of five major GCMs project consistent expansion of arid areas in developing countries. Currently, almost 1 billion people live worldwide in arid lands; more than 180 million people in Africa alone. In Africa, under current climate, AEZ estimates 1.1 billion hectares of arid and dry semi-arid land, i.e. with less than 120 days length of growing period, defined as the number of days in a year with temperature and soil moisture conditions favourable to crop cultivation (Fischer et al. 2002a). Under the climate change scenarios considered, and by 2080s, AEZ estimates of arid and dry semi-arid areas in Africa increase by about 5–8%, or 60–90 million hectares.
Environmental constraints
Under current climate, AEZ computes that two-thirds of the global land surface—some 8.9 billion hectares—suffer severe constraints for crop cultivation: 13.2% is too cold, 26.5% is too dry, 4.6% is too steep, 2.0% is too wet and 19.8% has poor soils. Climate change will have positive and negative impacts, as some constraints will be alleviated while others may increase. The results for the Hadley HadCM3 climate model and the IPCC A1F1 scenario, representing a high-emission scenario, indicate that with rapid climate change these constraints may change respectively to 5.2, 29.0, 1.1, 5.7 and 24.5%. The agro-ecological changes due to climate change will result in water deficits in some areas and surplus in others as well as increased or reduced infestation of disease pathogens and parasites.
Under climate change and by the 2080s, regional analyses of AEZ results indicate expansions of land area with severe constraints as follows: Central America and Caribbean (1–3% increase; AEZ simulations for current climate: 270 million hectares); Oceania and Polynesia (0.5–4.5%), northern Africa (2–3.5%; AEZ simulations for current climate: 550 million hectares) and Western Asia (up to 1%; AEZ simulations for current climate: 435 million hectares). In southern Africa, AEZ projects up to an additional 11% of a total land area of 265 million hectares to be at risk of being severely constrained for crop agriculture.
The case of sub-Saharan Africa
Simulations with AEZ suggest the following overall picture for sub-Saharan Africa: decrease of constraint-free prime land with highest suitability for crop cultivation; increase in land with moisture stress; and expansion of land with severe climate, soil or terrain constraints, by 30–60 million hectares, in addition to the 1.5 billion hectares already unfit for rainfed agriculture under current climate.
Under the rather dramatic climate changes of scenario SRES A2, AEZ computes a decrease of good land (the sum of very suitable and suitable land) under all five GCM climate projections, by an average of −6.3%, ranging from −8.2 million hectares (NCAR) to −27.3 million hectares (CSIRO). Land with severe climate, soil or terrain constraints, increases in 12 of the 14 climate projection considered, by 26–61 million hectares. Under the NCAR model, the extent of sub-Saharan land with severe environmental constraints to crop agriculture declines by about 15 million hectares for both the simulated A2 and B2 scenarios, due to significant increases in precipitation and milder temperature increases compared to the other GCM results considered in this study.
A snapshot of AEZ-derived environmental constraints in sub-Saharan Africa is presented in table 2, showing a transition matrix from current baseline climate to the 2080s, as projected by HadCM3-A1FI. Current conditions are summarized in the transition matrix by the row totals shown in the first numeric column. Column totals, in the last row of the matrix, denote class extents calculated for future climate. The values in each row of the transition matrix indicate for different land classes the fate of extents classified under current conditions. For instance, AEZ results indicate that only 8 million hectares of land currently under severe environmental constraints are expected to improve under climate change, whereas more than 60 million hectares of land currently under moderate constraints would further degrade to severe environmental constraints.
Table 2.
Transition matrix of changes in agro-ecological constraints to agriculture in sub-Saharan Africa, predicted by AEZ for the 2080s under scenario HadCM3-A1FI.
| reference climate | 1000 km2 | HadCM3-A1FI, 2080s | |||
|---|---|---|---|---|---|
| no constraint | slight | moderate | severe | ||
| no constraint | 535 | 457 | 66 | 6 | 6 |
| slight | 2704 | 11 | 2395 | 262 | 36 |
| moderate | 6061 | 3 | 67 | 5379 | 612 |
| severe | 15 128 | 0 | 0 | 80 | 15 048 |
| 471 | 2528 | 5727 | 15 702 | ||
Current land conditions are summarized in the first column. The values in each row indicate, for each different land classes, the projected change to different conditions.
Cultivated land
Under the climate change scenarios considered, the AEZ model predicts gains in potential agricultural land globally. In particular, large gains are predicted for North America and the Russian Federation, due to longer planting windows and generally more favourable growing conditions under warming. Significant losses are by contrast predicted in northern and southern Africa, due to a worsening of growing conditions from increased heat and water stresses.
Specifically, for the developed nations AEZ predicts under all climate projections an expansion of potential land suitable for crop cultivation, mostly at higher latitudes. Increases are mainly located in North America (40% increase over the 360 million hectares under current baseline climate); northern Europe (16% increase over current 45 million hectares); Russian Federation (64% increase over 245 million hectares) and in East Asia (10% increase over 150 million hectares).
(ii) Rainfed cereal-production
For developing countries, under NCAR climate projections, AEZ computes substantial gains in potential cereal-production in both developed and developing countries (figure 3). Under climate projections with the other GCMs, AEZ simulations produce mixed results for developing countries. For instance, on average among GCMs and specifically for wheat production in the 2080s, AEZ projects substantial decreases in attainable wheat production, in the order of 15–45% (figure 4). Specifically, AEZ computed decreases in south Asia (20–75%); southeast Asia (10–95%); and in South America (12–27%); the same simulation results suggest that land suitable for wheat production might virtually disappear in Africa.
Figure 3.

Changes in potentially attainable cereal-production predicted by AEZ under different GCM climate change scenarios, versus CO2 concentration. Projections are for either current cultivated land (right), or all available under future climates (left), and pooled into developed (top) and developing (bottom) countries. Results are expressed against an index of climate change (=100 in 1990), a proxy for time from 1990 to 2080.
Figure 4.

Changes in potentially attainable wheat production predicted by AEZ under different GCM climate change scenarios, versus CO2 concentration. Projections are for either current cultivated land (right), or all available under future climates (left), and pooled into developed (top) and developing (bottom) countries. Results are expressed against an index of climate change (=100 in 1990), a proxy for time from 1990 to 2080.
Under all climate change scenarios, AEZ results indicated that declines in cereal-productivity potentials of more than 5% will be realized by 2080 in a group of more than 40 countries worldwide, with mean losses of about −15%. Cumulative population projected for these countries ranges between 1.6 and 3.8 billion people by 2080 (depending on simulated impacts for India and thus whether India is included in this group). Fourteen countries account for 80% of current cereal-production of the developing world. China, the world's largest cereal producer, is projected by AEZ to increase its cereal-production potential by 5–23% across climate projections, except for the CSIRO climate, under which AEZ predicts a loss of 5–7%. For India, the second-largest cereal producer, Brazil and Thailand, results vary across climate projection. Argentina gains production potential by 7–24% for the HadCM3 and NCAR models, while production potential decreases by 10–30% under both CSIRO and CGCM2 projections. AEZ computes cereal-production potential decreases in South Africa under all climate projections, except under NCAR-A2, where a small gain occurs.
Results obtained in this study thus indicate, in agreement with previous studies, that a wide range of outcomes is to be expected for many countries, due to heterogeneity of their agro-climatic resources as well as of projected climate change. In addition, grid-based simulations in AEZ make it possible to aggregate results spatially to any unit of interest. In particular, we derived within-country impact statistics. Results pooled in figure 5 show for select countries, under HadCM3 projections an for the 2080s, the distribution of impacts with respect to changes in cereal suitability under to climate change, considering currently cultivated land, as well as all land potentially available under future climates (where available, as in Russia). Such distributions clearly indicate the inherent heterogeneity of impacts, even within a country. National-level averaged results may thus correspond to narrow normal distributions around an impact-neutral mean, such as the case of AEZ projections for India; present asymmetries towards negative impacts, such as computed for South Africa; or present positive means, but with substantial winners and losers (Russia and China). In the case of the latter countries, strong positive ‘tails’ were also projected, owing to either additional land brought into cultivation in future, warmer climates (Russia) or to strong shifts within currently used land, from previous marginal to more suitable conditions (China), often brought about by more favourable precipitation regimes under the projected climates.
Figure 5.

AEZ-simulated distribution of climate impacts on cereal productivity in the 2080s, under HadCM3-A1FI climate projections. The diagrams show the distribution of land with respect to cereal suitability changes under climate change. Bars shown to the right of the red line indicate land pixels where suitability increased; bars to the left denote negative changes. SI=suitability index for potential cereal-production computed by AEZ.
Current food-insecure countries
The total population of the over 80 poor food-insecure countries currently amounts to some 4.2 billion, more than 70% of current world population (FAO 2001); about 20% of this population is considered undernourished. By the 2080s, the total population of these countries is projected to increase to 6.8 billion, or about 80% of the world population at that time. Individual country outcomes in this group are reason for concern. For example, the AEZ results based on a suite of HadCM3 projections (scenario A1FI to B1) indicate that 20–40 poor and food-insecure countries, totalling 1–3 billion people, may lose on average 10–20% of their cereal-production potential under climate change. Results for developing countries in terms of cereal-production potential for gaining and losing countries are highlighted in figure 6, showing broad groups of countries where production capacity increases or decreases by at least 5%, compared to current climate.
Figure 6.

Impacts of climate change on rainfed cereal-production potential of developing countries, for currently cultivated land in the 2080s, according to HadCM3 and CSIRO climate projections.
With the exception of the results for the NCAR model, simulations under all remaining climate scenarios indicated that Sudan, Nigeria, Senegal, Mali, Burkina Faso, Somalia, Ethiopia, Zimbabwe, Chad, Sierra Leone, Angola, Mozambique and Niger, would lose cereal-production potential by the 2080s, across all the emission scenarios. These countries currently have 87 million undernourished, equivalent to 45% of the total undernourished in sub-Saharan Africa. In contrast, Zaire, Tanzania, Kenya, Uganda, Madagascar, Côte d'Ivoire, Benin, Togo, Ghana and Guinea were all projected to gain cereal-production potential by the 2080s. These eight gaining countries currently have 73 million undernourished, equivalent to 38% of the undernourished population in sub-Saharan Africa. Figure 7 indicates the spatial heterogeneity of impacts on cereal-production capacity, allowing for crop-switching and changes in crop calendars, in the 2080s relative to current climate, for climate projections by different GCMs, under SRES A2. Two important factors arise from further aggregating such results. First, the net balance of changes in cereal-production potential for sub-Saharan Africa was projected to be negative, with net losses of up to 12%. Second, there will be large variations in outcomes, with up to 40% of sub-Saharan countries losing significant shares of their agricultural resources (tables 3 and 4).
Figure 7.

Geographic distribution of percentage changes of AEZ-simulated potentially attainable cereal output per grid cell in the 2080s, SRES A2, and different GCM climate projections, relative to current climate.
Table 3.
AEZ-estimated impacts on potentially attainable rainfed cereal-production in the 2080s HadCM3 climate projections, for currently cultivated land of sub-Saharan African countries.
| scenario | number of countries | projected population (billions) | change in cereal-production potential (%) | |||||||
|---|---|---|---|---|---|---|---|---|---|---|
| G | N | L | G | N | L | G | N | L | total | |
| A1FI | 17 | 8 | 16 | 0.62 | 0.43 | 0.55 | 5.1 | −0.6 | −8.6 | −4.1 |
| A2 | 14 | 11 | 16 | 0.58 | 0.23 | 0.78 | 5.3 | 0.7 | −7.9 | −1.9 |
| B2 | 13 | 15 | 13 | 0.56 | 0.57 | 0.46 | 4.4 | 0.1 | −7.1 | −2.6 |
| B1 | 17 | 10 | 14 | 0.65 | 0.22 | 0.72 | 5.0 | 0.1 | −6.4 | −1.3 |
G, countries gaining 5% or more; N, small change of −5 to +5%; L, countries losing 5% or more.
Table 4.
AEZ-estimated impacts on potentially attainable rainfed cereal-production in the 2080s, SRES A2, for currently cultivated land of sub-Saharan African countries.
| climate model | number of countries | projected population (billions) | change in cereal-production-potential (%) | |||||||
|---|---|---|---|---|---|---|---|---|---|---|
| G | N | L | G | N | L | G | N | L | total | |
| HadCM3 | 14 | 11 | 16 | 0.58 | 0.23 | 0.78 | 5.3 | 0.7 | −7.9 | −1.9 |
| CSIRO | 16 | 8 | 17 | 0.63 | 0.24 | 0.73 | 3.3 | 0.1 | −15.1 | −11.7 |
| CGCM2 | 13 | 14 | 14 | 0.79 | 0.32 | 0.49 | 6.0 | 0.0 | −8.7 | −2.7 |
| NCAR | 25 | 13 | 3 | 1.07 | 0.39 | 0.13 | 8.2 | 0.4 | −0.8 | 7.8 |
G, countries gaining 5% or more; N, small change of −5 to +5%; L, countries losing 5% or more.
(b) BLS projections of the world food system: 1990–2080
While climate and farm management are key determinants of food production locally, and can be computed via AEZ, agro-economics and world trade combine to shape regional productivity significantly. The following sections describe results obtained with BLS simulations of world food systems.
(i) Baseline simulations under SRES development paths, no climate change
We next assess the impacts of four SRES socio-economic scenarios on world agricultural economy using the BLS framework. First, we present results for simulations without climate change, representing a reference case against which simulations including climate change are analysed. In order to then run BLS with climate change, AEZ-derived projections of changes in land production potentials and attainable yields for future decades are used to modify in a simple multiplier fashion the BLS yield production function. In either set of simulations, BLS simulations start in 1990 and were carried out in 1-year increments from 1990–2080. Analyses of projected changes are made relative to the 1990s.
Global cereal-production
For the baseline decade 1990, BLS computes world cereal-production (rice is included as milled equivalent; conversion factor is 0.67 from rice paddy) at 1.8 billion metric tons (G ton), about equally divided between developed and developing countries, in good agreement with current statistics. Effects of socio-economic scenarios are substantial, and results vary in a range with lower and upper values corresponding to SRES B1 and A2, respectively. By 2080, BLS projects global cereal-production in the range 3.7–4.8 G ton, depending on SRES scenario. Production in the developed countries ranges 1.4–1.6 G ton; thus BLS computes for the developing countries up to threefold increases in production from the 1990 baseline levels, with fivefold and higher increases projected for Africa in all the scenarios, as a consequence of the substantial economic development assumed in SRES.
Cultivated land
Total cultivated land in developed countries in 1994–1996 amounted to about 600 million hectares. During the same period, land in developing countries amounted to 870 million hectares, 30% of which located in southeast Asia.
Under the four socio-economic scenarios considered, BLS results show that land under cultivation in developed countries likely remains close to the 1990 levels, while additional production comes from increased productivity. In developing countries, by contrast, cultivated land is projected by BLS to increase by 2080. Projected increases are about 10% globally in SRES A1 and B1; higher increases of cultivated land are projected under SRES A2 and B2, about 30 and 20%, respectively. BLS results locate most of the additional cropland either in Africa or Latin America. In southeast Asia, due to lack of suitable land and land-use competition from other sectors, only some 30–40 million hectares may additionally be brought under cultivation across socio-economic scenarios.
BLS calculations also show interesting time dynamics associated with changes in cultivated land, with land amounts and trends, generally, following population. For instance, the lowest and highest amounts of global cultivated land in 2080 are computed under SRES B1 (1.6 million hectares) and SRES A2 (1.8 million hectares) respectively, in correspondence to the lowest and highest population projections, respectively. In addition, in SRES A1 and B1, land under cultivation computed by BLS for the 2050s is higher than for the 2080s. This is in line with peaks in projected population numbers, which in A1 and B1 occur by mid-century, after which total population, and food demand, start declining.
Food security
The BLS estimates of the number of people at risk of hunger vary greatly with socio-economic SRES scenarios, in particular depending on projected income levels and their regional distribution, as well as on population projections.
The BLS estimate is based on FAO data (FAO 2001) and relies on a strong empirical correlation between the shares of undernourished in the total population and the ratio of average national food supply, including imports, relative to aggregate national food requirements, as plotted in figure 8. For instance, the diagram suggests that the share of undernourished in the total population will fall below 20% for an index value of about 130, i.e. when aggregate food supply exceeds aggregate national food requirements by 30%. Hunger is nearly eliminated for index values of food supply over requirements higher than 160.
Figure 8.
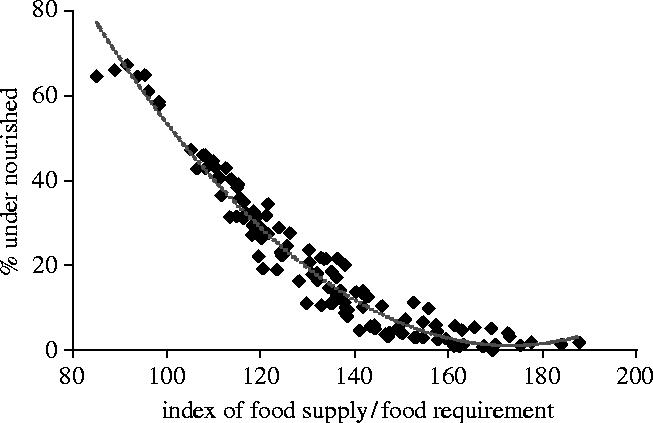
BLS-based estimation of the percent share of undernourished people in the total population of any given country, based on food balances, based on domestic production as well as on international trade.
The BLS simulation results indicate that in spite of relatively high levels of economic growth in SRES scenarios, there is only modest progress in reducing hunger to 2020. This implies, regardless of climate change, that specific targeted programmes for hunger reduction will be essential to meet the millennium goals (UN Millennium Project 2005) of reducing hunger by half in 2015 (figure 9).
Figure 9.

BLS-projected number of people undernourished, under all four SRES scenarios and no climate change, computed for (a) all developing countries and (b) African developing countries.
In the period 2020–2050, BLS results suggest that hunger is substantially reduced in scenarios A1, B1; somewhat less in B2. In the case of scenario A2, with (perhaps unrealistically) high-assumed population growth and thus slower per capita income growth compared to the other SRES scenarios, hunger persists.
(ii) Simulations under SRES development paths and climate change
The following section describes results of coupling BLS simulations of global and regional production with AEZ-derived climate-change impacts on land and crop potentials. To this end, percentage changes indicated in the text refer to comparisons of BLS results without and with climate change.
Some 60 simulations were performed with the AEZ–BLS framework (Fischer et al. 2002b). The simulations were related to four main research questions: magnitude of climate change for different future socio-economic paths, uncertainty of results in view of differences in climate projections of different GCM groups, robustness of results with regard to altered economic growth assumptions and sensitivity of results to different assumptions with regard to physiological effects of atmospheric CO2 enrichment on yields. As for the ‘no climate change’ case described in §3b(i), BLS simulations with climate change started in the base year 1990 and proceeded up to 2080. Three separate snapshots are provided for concise discussion of results: 2020s, 2050s and 2080s.
In general, in these simulations, modifications to food production caused by climate change create market imbalances with respect to the baseline case, modifying international prices leading to reallocation of capital and human labour. Thus, BLS computes certain adaptation strategies automatically, by searching for solutions that optimize new opportunities under climate-change via model-calculated economic adjustments.
Impact of climate change on prices and agricultural GDP
Generally, BLS simulated crop price changes under climate change are moderate, due to relatively small net global impacts on crop-production potentials. For the range of scenarios, in the case of HadCM3 climate projections, cereal prices increase 2–20% (scenario B1 to A1FI); for CSIRO the increase is 4–10%, relative to baselines BLS projections. For the remaining GCM projections aggregate price changes due to climate-change impacts were even less.
BLS simulation results suggest that impacts of climate change on agricultural GDP are also small at global level, i.e. between −1.5% (in HadCM3-A1FI scenario) and +2.6% (in NCAR-A2 scenario); this comparison refers to total global GDP of agriculture in BLS baseline projections, ranging from US$ 2.9 to 3.6 trillion (1990 US $).
At the same time, BLS results indicated that agriculture in developed countries as a group would benefit under climate change. Among developed regions, simulations indicate that North America gains in all GCM scenarios (in particular, 3–13% under SRES A2, for different GCM projections); agricultural GDP mostly increases in the Former Soviet Union (up to 23% in scenario A2); while only Western Europe loses agricultural GDP, across all GCM scenarios (−6 to −18% under SRES A2).
By contrast, BLS results indicated decreases in agricultural GDP in most developing regions, with the exception of Latin America. For Asia, by 2080, agricultural GDP losses amount to about −4%, under SRES A1 and A2, and HadCM3 and CSIRO climate (BLS baseline projections: US$ 1.1–1.3 trillion). Aggregate projections for Africa are also negative, −2 to −8% for HadCM3 and CGCM2 climate, and −7 to −9% for CSIRO (BLS baseline projections: US$ 0.6–0.7 trillion).
Impact of climate change on cereal-production
AEZ–BLS model results present a fairly consistent response pattern of regional cereal-production to climate change. At the global level, taking into account economic adjustments of actors and markets, simulated cereal-production changes fall within 2% of the results for the reference simulations without climate change. However, aggregation produces deceivingly small numbers. The developing countries consistently experience reductions in cereal-production in all climate scenarios. Decreases of 5–6% are most pronounced in simulations based on CSIRO climate projections. In this case, production moves to developed regions, notably North America and the Former Soviet Union, where increases of 6–9% are observed. The most significant negative changes occur in Asian developing countries, where production declines in all scenarios, ranging from about −4% for CGCM2 and NCAR to −6 to −10% for HadCM3 and CSIRO.
Impact of climate change on cereal consumption and trade
In the SRES worlds of the 2080s, consumers are assumed to be much richer than they are today; they are largely separated from agricultural production processes, dwelling in cities and earning incomes in the non-agricultural sectors. As in today's developed countries, consumption levels depend largely on food prices and incomes rather than on changes in domestic agricultural production.
BLS simulations for 2080 predicted, in response to climate change across all climate models and emission scenarios—with the exception of the NCAR climate projections, a fairly uniform decline in direct human consumption of cereals in developing countries. For HadCM3, human cereal consumption in developing countries declines by 2–4%, i.e. in the order of 40–80 million metric tons, compared to simulated total direct consumption between 1.6 G ton (scenario B1) and 2.1 G ton (scenario A2) in the BLS reference projections. Consumption changes in Asian developing countries accounted for two-thirds of this amount. Consumers in Latin America were least affected in model simulations.
Simulations of the SRES reference scenarios (without climate change) revealed a growing dependence of developing countries on net cereal imports, totalling in 2080 between 170 million ton (B1) and 430 million ton (A2). According to the AEZ–BLS runs, climate change will add to this dependence, increasing net cereal imports of developing regions by 10–40% across GCM climate projections. The largest increases occurred under CSIRO climate projections. Even under NCAR projections, resulting in overall positive impacts on agricultural productivity, the comparative advantage for producing cereals is predicted to shift towards developed countries, and net imports of developing countries increase by about 25%, i.e. around 90 million tons of additional cereal imports in scenario B1, and an additional 110 million tons in scenario A2.
Climate change and food security: number of people at risk of hunger
Some fairly robust conclusions emerge from the analysis of climate-change impacts on the number of people at risk of hunger. First, climate change will most likely increase the number of people at risk of hunger. Second, the importance and significance of the climate-change impact on the level of undernourishment depends entirely on the level of economic development assumed in the SRES scenarios.
For the wealthy societies of SRES scenario A1, where even currently poor regions are assumed to reach economic levels exceeding in per capita terms current OECD incomes, hunger is a marginal issue and remains so even with climate change. In contrast, the outcome of simulations is quite different for the high-population SRES scenario A2. Under this set of demographic and economic assumptions, the level of undernourished, even without considering climate change, remains at a high level throughout the entire simulation period to 2080. In the reference projection (without climate change), the number of undernourished was estimated at 768 million for 2080. With considering climate change, this number increases by nearly 120 million, equivalent to some 15%, under both HadCM3 and CSIRO climate projections. Climate change projections with the Canadian CGCM2 model result in an additional 50 million undernourished.
In the simulation experiments, it is possible to impose different levels of climate change (i.e. for the full range of emission scenarios and climate model outputs) on any socio-economic development path. This allowed us to establish a relationship between level of climate change and estimated number of people at risk of hunger with regard to different development path assumptions. The full range of climate-change impacts on crop suitability and productivity for all four IPCC emission scenarios was assessed in AEZ. For all four levels of climate change, production impacts were imposed on the socio-economic development path of scenario A2. For instance, for the large climate changes projected by the HadCM3-A1FI scenario for the 2080s, additional undernourished people amount to 175 million. This indicates that under socio-economic conditions of development path A2, the number of undernourished may increase more than linear with the level of climate change. Figure 10 summarizes the results, showing the additional number of people at risk of hunger in 2080 plotted against different levels of atmospheric CO2 concentrations and associated climate changes.
Figure 10.
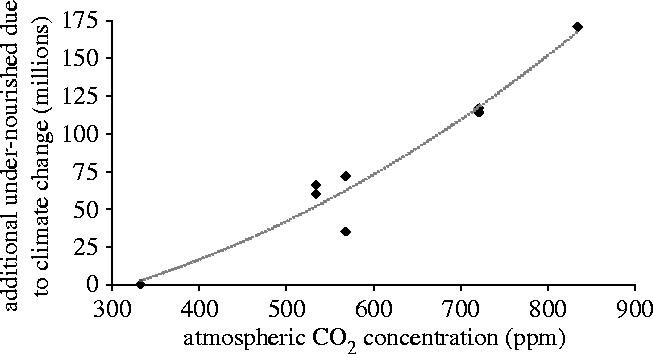
Additional number of people at risk of hunger in 2080, plotted against different levels of atmospheric CO2 concentrations and associated climate change, for SRES A2 development path and simulation results with HadCM3 and CSIRO climate projections.
4. Discussion and conclusions
The extensive AEZ–BLS simulation results presented herein provide a full albeit lengthy analysis of the combined effects of alternative socio-economic development paths and associated climate change on agricultural production worldwide. A number of conclusions can be gathered and are offered in this section. We then conclude by making a number of more generic considerations on the nature of future agricultural needs in order to improve long-term sustainability of food systems under multiple challenges.
In general, our simulations were carried out under the assumption that assessment studies simply based on current agricultural economies, over which climate signals are superimposed without economic re-adjustment, cannot produce sensible results vis à vis the state of global agricultural economics over coming decades, as climate change and socio-economic pressures progressively become interlinked. Within a coherent agro-ecological and economic framework, the question of relative importance among these different drivers can be properly analysed. Specifically, the baseline BLS runs without climate change provided a way to set a reference, against which climate-change impacts could be assessed in their absolute and relative importance. It should be noted here that current opinion considers the population component of SRES A2 ‘out of the range’, as its associated population growth rates seem now too high (e.g. W. Lutz 2004, personal communication). We nonetheless chose to include it alongside the other SRES scenarios, as the scope of this work was to test the sensitivity of the world food system under ‘what-if’ type questions, including the full range of scenarios considered by IPCC. The reader is advised to interpret results from A2 discussed herein as being representative of a worst case scenario.
BLS baseline results indicated that differences in assumed socio-economic development—in this study represented by the four IPCC-SRES scenarios—can significantly impact global agriculture. Against the current backdrop of about 1.8 G metric tons of cereal-production worldwide, BLS computed by 2080 a range between 3.7 and 4.8 G metric tons, with scenarios B1 and A2 representing the lower and upper prediction limits. These projections represent a near doubling of current global production, in response to the projected rise in population and incomes. The context behind these figures is that globally, land and crop resources, together with technological progress, appear to be sufficient to feed a world population of about 9 billion people (13 billion in A2) in 2080 (nevertheless with great uncertainty in some developing regions).
The impact of different SRES scenarios is significant at both global and regional levels. Globally, BLS projects cereal-production of 4.3±0.5 G metric tons. The variation across scenarios is thus about 10–15%. Regionally, BLS results show a more heterogeneous picture, as discussed. Of particular relevance to regional food security is the case of sub-Saharan Africa, where a growing share of people considered undernourished is located. BLS baseline results indicate a significant reduction in both the absolute number and percentage (compared to world population) of undernourished people, i.e. at risk of hunger, for all SRES scenarios by 2080, except for A2, due to significantly larger populations and slower per capita income growth in that scenario. Under A2, BLS predicts the number of undernourished in 2080 to be 768 million, virtually equivalent to today's figures. Even taking A2 out of the picture, BLS average results, across scenarios, indicate 150±50 million undernourished people by 2080. Variability across scenarios, of about 30%, is thus much larger than computed for global food production.
Importantly, all scenarios indicated that reduction of world hunger will be small, until 2030 globally, and perhaps not until 2040 for sub-Saharan Africa. These results are important in terms of UN millennium development goals, i.e. the current commitment of developed nations to reduce hunger by half by 2015. BLS results suggest that global economic development can ‘trickle down’ to poor regions to nearly eradicate world hunger by the 2050s and 2080s, provided high levels of economic growth are accompanied by moderate population increase. Yet, under all scenarios considered, BLS results indicate that millennium development goals cannot be met simply through market mechanisms, and that additional targeted actions would be necessary.
The impacts of climate change were found to be critically dependent upon SRES development scenario and on GCM regionally, but not so much globally. At the global level simulation results indicate only small percentage changes from the baseline reference case with respect to cereal-production. Analyses of the AEZ–BLS framework thus indicate that the two levels of adaptation considered in our simulations, i.e. autonomous adaptation at the field level, such as changing of crop calendars and cropping systems as a function of climate; and market adjustments at both regional (re-distribution of capital, labour and land) and global (trade) levels, can successfully combine to reduce otherwise larger negative impacts, as computed by AEZ alone. Regionally, climate change effects were to further widen the gap between developed and developing countries, in addition to results analysed under the BLS reference cases. The conclusion is that climate change impacts will be more severe in tropical semi-arid developing countries. The AEZ–BLS results suggest reductions in production in developing countries, in the 5–10% range, accompanied by similar increases of production in northern developed regions, especially North America and Russia. Finally, in terms of food security, AEZ–BLS results indicate significant climate change effects would occur only if levels of undernourishment were already high under ‘no climate change’ conditions, e.g. as in SRES A2. In particular for SRES A2, projected climate change resulted in an additional 15% increase in the number of undernourished people. Under the other three SRES scenarios, simulated climate-change impacts on food security were rather small (in absolute terms) due to projected demographic and socio-economic changes that substantially reduced the risk of under-nutrition.
In conclusion, the AEZ–BLS results provided for in-depth analysis of the potential interactions between socio-economic pressures and climate-change impacts over the coming decades. Results suggest that socio-economic development over this century will greatly alter production, trade, distribution and consumption of food products worldwide, as a consequence of population growth, economic growth, and diet changes in developing countries. Climate change will additionally modify agricultural activities, probably increasing any gaps between developing and developed countries. Adaptation strategies, both on-farm and via market mechanisms, will be important contributors to limiting the severity of impacts. Additional climate change pressures, not investigated in this study, may arise by changes in the frequency of extreme precipitation events such as floods and droughts, which may diminish the capacity of countries to adapt, especially in poor tropical regions.
The climate change issue is global, long-term and involves complex interaction between demographic, climatic, environmental, economic, health, political, institutional, social and technological processes. It has significant international and intergenerational implications in the context of equity and sustainable development. Climate change will impact on social, economic and environmental systems and shape prospects for food, water and health security (Steffen et al. 2004; WHO 2003). The capacity to mitigate and to adapt to climate-change impacts is strongly related to the future development paths. The socio-economic and, even more so, the technological characteristics of different futures strongly affect emissions, hence the extent and pace of the impacts of climate change, as well as the capability of societies to adapt to and mitigate climate change. Recent developments in geographical information systems, data acquisition by remote sensing, and the increasing quality and spatial coverage of global resource databases, has enabled modelling to identify potentials and environmental constraints to crop production at regional and national levels. The integration of these assessments in the global food economy together with projections of future climate change and variability enables evaluation of impacts of climate change on agriculture and provides a basis of prioritizing regional and commodity specific agricultural research for adaptation and mitigation.
Climate change and variability may result in irreparable damage to arable land and water resources in some regions, and with serious local consequences for food production. These losses will be felt most profoundly in developing countries with low capacity to cope and adapt. While the international community has focused on climate change mitigation, the issue of adaptation to climate change is an equally pressing issue and must be put on the international negotiation agenda. This is of critical importance to many developing countries that have contributed little to greenhouse gas emissions thus far and yet, it is these countries that will bear the brunt of the negative impacts of climate change and variability.
Acknowledgments
We thank two anonymous reviewers for their valuable comments, which greatly improved clarity and substance of this paper. F. N. T. was supported in part by NOAA Research grant GC02-333, and by a US–Italy Climate Change Grant from INGV-Bologna.
Footnotes
One contribution of 17 to a Discussion Meeting Issue ‘Food crops in a changing climate’.
References
- Ainsworth E.A, Long S.P. What have we learned from 15 years of free-air CO2 enrichment (FACE)? A meta-analysis of the responses of photosynthesis, canopy properties and plant production to rising CO2. New Phytol. 2005;165:351–372. doi: 10.1111/j.1469-8137.2004.01224.x. doi:10.1111/j.1469-8137.2004.01224.x [DOI] [PubMed] [Google Scholar]
- FAO 2001 The State of Food Insecurity in the World, 2001 Food and Agriculture Organization of the United Nations, Rome, Italy, ISBN 92-5-104628-X.
- FAO . World Agriculture: Towards 2015/1030. In: Bruinsma Jelle., editor. A FAO perspective. Food and Agricultural Organization of the United Nations; Rome: 2003. p. 432. [Google Scholar]
- Felzer B, Kicklighter D.W, Melillo J.M, Wang C, Zhuang Q, Prinn R. Effects of ozone on net primary production and carbon sequestration in the conterminous United States using a biogeochemistry model. Tellus. 2004;56B:230–248. [Google Scholar]
- Fischer G, Sun L. Model-based analysis of future land-use development in China. Agr. Ecosyst. Environ. 2001;85:163–176. doi:10.1016/S0167-8809(01)00182-7 [Google Scholar]
- Fischer G, Frohberg K, Parry M.L, Rosenzweig C. Climate change and world food supply, demand and trade: who benefits, who loses? Global Environ. Change. 1994;4:7–23. doi:10.1016/0959-3780(94)90018-3 [Google Scholar]
- Fischer G, Frohberg K, Parry M.L, Rosenzweig C. Impacts of potential climate change on global and regional food production and vulnerability. In: Downing E.T, editor. Climate change and world food security. xxx. vol. 137. Springer-Verlag; Berlin: 1996. pp. 115–159. [Google Scholar]
- Fischer G, Frohberg K, Keyzer M.A, Parikh K.S.Linked national models: a tool for international policy analysis1988Kluwer Academic; Dordrecht, The Netherlands [Google Scholar]
- Fischer G, van Velthuizen H, Shah M, Nachtergaele F.O.Global agro-ecological assessment for agriculture in the 21st century: methodology and results IIASA RR-02-022002aIIASA; Laxenburg, Austria [Google Scholar]
- Fischer, G., Shah, M., & van Velthuizen, H. 2002bClimate Change and Agricultural Vulnerability, Special Report to the UN World Summit on Sustainable Development, Johannesburg 2002. Laxenburg, Austria: IIASA.
- Flato G.M, Boer G.J, Lee W.G, McFarlane N.A, Ramsden D, Reader M.C, Weaver A.J. The Canadian centre for climate modelling and analysis global coupled model and its climate. Climate Dyn. 2000;16:451–467. doi:10.1007/s003820050339 [Google Scholar]
- Gordon H.B, O'Farrell S.P. Transient climate change in the CSIRO coupled model with dynamic sea ice. Mon. Weather Rev. 1997;125:875–907. doi:10.1175/1520-0493(1997)125<0875:TCCITC>2.0.CO;2 [Google Scholar]
- Gordon C, Cooper C.A, Sr., Banks H, Gregory J.M, Johns T.C, Mitchell J.F.B, Wood R.A. The simulation of SST, sea ice extents and ocean heat transports in a version of the Hadley centre coupled model without flux adjustments. Climate Dyn. 2000;16:147–168. doi:10.1007/s003820050010 [Google Scholar]
- Hirst A.C, Gordon H.B, O'Farrell S.P. Response of a coupled ocean-atmosphere model including oceanic eddy-induced advection to anthropogenic CO2 increase. Geophys. Res. Lett. 1997;23:3361–3364. doi:10.1029/96GL03234 [Google Scholar]
- IPCCSummary for policymakers, emissions scenarios A Special Report of IPCC Working Group III, Intergovernmental Panel on Climate Change2000Cambridge University Press; Cambridge, UK [Google Scholar]
- IPCC, 2001a Climate change 2001: the scientific basis Contribution of working group I to the third assessment report of the Intergovernmental panel on climate change, ISBN 0521-014-95-6.
- IPCCIPCC climate change 2001: impacts, adaptation, and vulnerabilityContribution of working group II to the third assessment report of the intergovernmental panel on climate change 2001Cambridge University Press; Cambridge, UK [Google Scholar]
- Jablonski L.M, Wang X, Curtis P.S. Plant reproduction under elevated CO2 conditions: a meta-analysis of reports on 79 crop and wild species. New Phytol. 2002;156:9–26. doi:10.1046/j.1469-8137.2002.00494.x [Google Scholar]
- Kimball B.A, Kobayashi K, Bindi M. Responses of agricultural crops to free-air CO2 enrichment. Adv. Agron. 2002;77:293–368. [PubMed] [Google Scholar]
- Millennium Ecosystem AssessmentEcosystems and human well-being: synthesis2005Island Press; Washington, DC [Google Scholar]
- Nakicenovic N, et al. IPCC SRES revisited: a response. Clim. Change. 2003;14:187–214. [Google Scholar]
- Oberhuber J.M. Simulation of the Atlantic circulation with a coupled sea-ice mixed layer-isopycnal general circulation model. Part I: model description. J. Phys. Oceanogr. 1993;13:808–829. doi:10.1175/1520-0485(1993)023<0808:SOTACW>2.0.CO;2 [Google Scholar]
- Olesen J.E, Bindi M. Consequences of climate change for European agricultural productivity, land use and policy. Eur. J. Agron. 2002;16:239–262. doi:10.1016/S1161-0301(02)00004-7 [Google Scholar]
- Parry M.L, Rosenzweig C, Iglesias A, Fischer G, Livermore M.T.J. Climate change and world food security: a new assessment. Global Environ. Change. 1999;9:51–67. doi:10.1016/S0959-3780(99)00018-7 [Google Scholar]
- Parry M.L, et al. Millions at risk: defining critical climate change threats and targets. Global Environ. Change. 2001;11:181–183. doi:10.1016/S0959-3780(01)00011-5 [Google Scholar]
- Parry M.L, Rosenzweig C, Iglesias A, Livermore M, Fischer G. Effects of climate change on global food production under SRES emissions and socio-economic scenarios. Global Environ. Change. 2004;14:53–67. doi:10.1016/j.gloenvcha.2003.10.008 [Google Scholar]
- Pope V.D, Gallani M.L, Rowntree P.R, Stratton R.A. The impact of new physical parametrizations in the Hadley Centre climate model—HadAM3. Climate Dyn. 2000;16:123–146. doi:10.1007/s003820050009 [Google Scholar]
- Reilly J, Tubiello F.N, McCarl B, Melillo J. Climate change and agriculture in the United States. In: Melillo J, Janetos G, Karl T, editors. Climate change impacts on the United States: foundation, USGCRP. Cambridge University Press; Cambridge, UK: 2001. pp. 379–403. [Google Scholar]
- Reilly J, et al. U.S. Agriculture and climate change: new results. Climatic Change. 2003;57:43–69. [Google Scholar]
- Roeckner et al 1992 Simulation of the present-day climate with the ECHAM 4 model: impact of model physics and resolution Max-Planck Institute for Meteorology, Report No. 93, p. 171, Hamburg, Germany.
- Roeckner, E. et al 1996 The atmospheric general circulation model ECHAM-4: model description and simulation of present-day climate Max-Planck Institute for Meteorology, Report No. 218, p. 90, Hamburg, Germany.
- Rosenzweig C, Parry M.L. Impacts of climate change on world food supply. Nature. 1994;367:133–138. doi:10.1038/367133a0 [Google Scholar]
- Rosenzweig, C. & Tubiello, F. N. In press. Interactions of adaptation and mitigation strategies in agriculture. Mitigation and adaptation strategies for climate change
- Rosenzweig C, Tubiello F.N, Goldberg R.A, Mills E, Bloomfield J. Increased crop damage in the U.S. from excess precipitation under climate change. Global Environ. Change. 2002;12:197–202. doi:10.1016/S0959-3780(02)00008-0 [Google Scholar]
- Rosenzweig C, Allen L.H, Jr, Harper L.A, Hollinger S.e, Jones J.W.Climate change and agriculture: analysis of potential international impactsASA Special Publication No. 591995ASA, CSSA and SSSA; Madison, WI [Google Scholar]
- Steffen W, Sanderson A, Tyson P.D, Jäger J, Matson P.A, Moore B III, Oldfield F, Richardson K, Schellnhuber H.J, Turner B.L, Wasson R.J, editors. Global change and the Earth system: a planet under pressure. Springer-Verlag; Berlin, Heidelberg, New York: 2004. [Google Scholar]
- Tsuji G.Y, Uehara G, Balas S, editors. DSSAT v3, volumes 1, 2 and 3. International Benchmark Sites Network for Agrotechnology Transfer, University of Hawaii; Honolulu, Hawaii: 1994. [Google Scholar]
- Tubiello, F. N. 2005 Climate variability and agriculture: perspectives on current and future challenges. In Impact of climate change, variability and weather fluctuations on crops and their produce markets (ed. B. Knight), Impact Reports, Cambridge, UK.
- Tubiello F.N, Jagtap S, Rosenzweig C, Goldberg R, Jones J.W. Effects of climate change on U.S. crop production from the National assessment. Simulation results using two different GCM scenarios. Part I: wheat, potato, corn, and citrus. Climate Res. 2002;20:259–270. [Google Scholar]
- Tubiello F.N, Ewert F. Modeling the effects of elevated CO2 on crop growth and yield: a review. Eur. J. Agr. 2002;18:57–74. doi:10.1016/S1161-0301(02)00097-7 [Google Scholar]
- Investing in development. A practical plan to achieve the Millenium development goals Report to the UN Secretary General. 2005. ISBN 1-884707-217-1, New York.
- Washington W.M, et al. Parallel climate model (PCM) control and transient simulations. Climate Dyn. 2000;16:755–774. doi:10.1007/s003820000079 [Google Scholar]
- Watson R.T, Noble I.R, Bolin B, Ravindranath N.H, Verardo D.J, editors. Land use, land-use change, and forestry. Special report of the intergovernmental panel on climate change. Cambridge University Press; Cambridge, UK: 2000. [Google Scholar]
- WHOClimate change and human health—risks and responses2003WHO; Geneva [Google Scholar]
- Williams J.R, Renard K.G, Dyke P.T. EPIC—a new model for assessing erosion's effect on soil productivity. J. Soil Water Conserv. 1984;8:381–383. [Google Scholar]