

RECENT studies employing single-sperm haplotyping (Jeffreys and Neumann 2002), pedigrees (Visser et al. 2005), and population studies using dense genetic marker data (Crawford et al. 2004; McVean et al. 2004; Myers et al. 2005) have shown that there is a large amount of local variation in recombination rate in the human genome. Methods to estimate fine-scale recombination rates from population data have been based upon coalescent-based models (Li and Stephens 2003; Fearnhead et al. 2004; McVean et al. 2004). Recently, Clarke and Cardon (2005) proposed a novel way to estimate recombination rate and the position of recombination hotspots by using information on haplotype frequencies from multiple closely linked marker loci from pedigree data. Recombination rate in Clarke and Cardon (2005) was defined as “the probability that a transmitted haplotype constitutes a new combination of alleles different from that of either parental haplotype” (Clarke and Cardon 2005, p. 2086). This method has appeal because it is “model free,” computationally fast, and applicable to pedigree structures (parents and progeny) that are widely available in human and animal populations. The authors claim that they can distinguish between linkage and linkage disequilibrium by this method. It was unclear to us how this critical information was obtained, however, for at the level of ≤10 kb, the size of a typical “hotspot,” the number of new recombinants in a sample of <100 individuals is very small; and, further, Clarke and Cardon (2005) give an example (their Figure 4) where the positions of purported hotspots seem unrelated to the positions of recombination events. In addition, as the authors clearly note, because this method worked when no additional recombination was simulated from parents to progeny, recombination in the current generation does not have a significant impact on their estimates of population recombination rates such that their method appears to capture historical recombination rate information. It was not clear to us how the Clarke and Cardon (2005) method accounts for linkage disequilibrium (LD) information and how it estimates recombination rate. In view of the analysis we show here, we conjecture that, because the authors constrain the estimates of the recombination fraction between each pair of markers to be nonnegative, their estimates of the recombination rate depend on the amount of LD. This dependence occurs because these constrained estimates depend on the sampling errors of the unconstrained estimates, which in turn depend on the magnitude of LD.
From a sample of individuals in the parental generation [Clarke and Cardon 2005 used Centre d'Etude du Polymorphisme Humain (CEPH) trio data from the HapMap project (Altshuler et al. 2005)] estimates are obtained of haplotype frequency at biallelic (SNP) loci 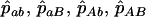 , with
 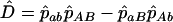 . (The following argument applies even if these frequencies are known exactly.) In a sample of n haplotypes in the offspring generation, the numbers observed are nAB, etc. Assuming the recombination fraction is c, the expected frequency of ab is
  in the offspring, giving the likelihood equation (Equation 4 of Clarke and Cardon 2005)
 |
(1) |
from which the maximum-likelihood (ML) estimate  of c is obtained. We note from Equation 1 that c can be estimated only when the estimated disequilibrium in the parental generation is nonzero. As
  from any single pair of loci has a very large sampling variance, Clarke and Cardon (2005) combine estimates from a number of adjacent pairs of loci to obtain an estimate for a genome region. To do this they weight estimates by the inverse of their sampling variance V(
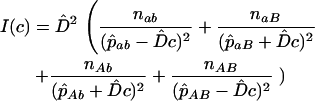
 ) = 1/I(c), where I(c) = −d2 ln[L(c)]/dc2 is the information content (their Equation 5):
 |
(2) |
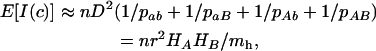
As an insight into the information content, we take expectations over numbers sampled. To define hotspots, Clarke and Cardon (2005) consider regions of <100 kb, and hence assuming average recombination rates of 1 cM/Mb (Kong et al. 2004), values of c are likely to be <0.001 even when hotspots are present within them; and they use a sample of size n < 100 as in the CEPH data. Therefore I(c) depends so little on c that we can ignore c in its calculation, e.g., assuming pab − Dc ∼ pab. Taking expectations over numbers sampled, e.g., E(nab) = npab, and, to simplify formulas, expectations over numbers in the parental generation,
 |
(3) |
where H is heterozygosity, r is the correlation of gene frequencies, and mh is the harmonic mean of the haplotype frequencies. Equation 3 shows that the information content becomes infinitely large as Lewontin's D′ → 1 (when one or more of the haplotype frequencies approaches zero) for any gene frequency. To get some “feel” for (3), if 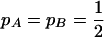 , then
  . When averaging over pairs of sites, estimates of c therefore receive more weight from those pairs of markers in high LD.
The information content plays a more important role here than in the weighting of the estimates, however. The approximate sampling error of c for gene frequencies of 0.5 is SE(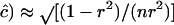 , e.g., 0.49, 0.23, and 0.075 for n = 100 and r = 4D = 0.2, 0.4, and 0.8. Consequently, if c is small, say <0.001, c ≪ SE(
 ) so there is a probability of nearly one-half that an unconstrained ML estimate of c from (1) would be negative. G. M. Clarke and L. R. Cardon (personal communication) constrain
  for each pair of markers, and negative estimates are set to zero. Hence estimates of c are biased and, if c is small, approximately half the estimates would be zero and half equal to a randomly sampled nonnegative variate,
 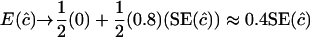 , because the expectation of
 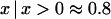 for a normal deviate. For example,
  for
for  , e.g., 0.20, 0.09, and 0.03 for n = 100 and r = 0.2, 0.4, and 0.8; thus the estimate is roughly proportional to the reciprocal of historical LD. In other words, when c is very small,
  does not estimate recombination rate but its expectation is a function of LD. When estimates of c are weighted over adjacent sites, such an estimate would get a weight of 1/SE(
 . Hence, for a pair of close markers
  estimates the reciprocal of historical LD between those markers and the larger the LD the more weight is given to the estimate. As individual estimates of c are biased by the constraint that
  , averages over pairs of loci in the same region will also be biased and depend on the LD in that region.
We illustrate these conclusions (Table 1) by simulation, taking as an example the case where gene frequencies are  at each locus and there is some linkage disequilibrium (D = r/4 = 0.1 or 0.2) in the parental generation; otherwise Equation 1 cannot yield a positive solution for c. Haplotype frequencies in the progeny generation were simulated from a multinomial distribution, given values of the allele frequencies at both loci (
 ), disequilibrium in the parental generation (D = 0.1, 0.2), and the recombination rate (c = 0, 0.001, and 0.01). Maximum-likelihood estimates for c were obtained using Equation 1, assuming that the parameters in the parental generation were known. Results show that if no restriction is placed on the sign of
  then estimates of c are unbiased. Their sampling error is large if the sample size is small and, as expected, becomes smaller as parental D increases. If, however, the estimates are constrained such that
  , the estimate of c is biased upward and depends little on the true value of c if nc < 1; but it is, however, a function of D. Indeed, as we predicted above, it is ∼0.4 times the SD of the unconstrained estimate of c.
TABLE 1.
Expectation of estimates of recombination rate (c) from Monte Carlo simulation each with 10,000 replicate samples of n offspring, with gene frequencies  and linkage disequilibrium D in the parents
Unconstrained 
|

|
|||||
|---|---|---|---|---|---|---|
| n | c | D |  |
SD( ) ) |
 |
SD( ) ) |
| 100 | 0 | 0.1 | 0.000 | 0.227 | 0.091 | 0.134 |
| 0.2 | 0.000 | 0.076 | 0.030 | 0.047 | ||
| 0.001 | 0.1 | 0.000 | 0.230 | 0.094 | 0.138 | |
| 0.2 | 0.000 | 0.074 | 0.029 | 0.046 | ||
| 0.01 | 0.1 | 0.013 | 0.232 | 0.099 | 0.143 | |
| 0.2 | 0.012 | 0.076 | 0.036 | 0.051 | ||
| 1000 | 0 | 0.1 | 0.000 | 0.072 | 0.029 | 0.043 |
| 0.2 | 0.000 | 0.024 | 0.009 | 0.014 | ||
| 0.001 | 0.1 | 0.002 | 0.072 | 0.029 | 0.043 | |
| 0.2 | 0.001 | 0.024 | 0.010 | 0.014 | ||
| 0.01 | 0.1 | 0.011 | 0.073 | 0.035 | 0.047 | |
| 0.2 | 0.010 | 0.024 | 0.016 | 0.018 | ||
Estimates of  are either unconstrained, i.e., may take positive or negative values, or are constrained such that
  ≥ 0.
≥ 0.
In the example given by Clarke and Cardon (2005), data are on trios of parents and offspring, but the likelihood equations they present (their Equation 4, our Equation 1) apply to samples of data on unrelated individuals from two generations in the same population. When the haplotype information is available on both parents and offspring, both the number of opportunities for detectable recombination, which is the number of parents heterozygous at both loci, and the number of recombinant gametes can be counted directly. The maximum-likelihood estimate of c is simply the ratio of these numbers, independent of D, which is binomially distributed with information proportional to the expected number of double-heterozygote parents, e.g., n(1 + r2)/2 for gene frequencies  . This would formally provide better estimates of the recombination fraction than Equation 1. Estimates of c from each pair of loci would be weighted differently as the information content is a different function of D, and if constrained to be nonnegative they would also be approximately proportional to the corresponding sampling error and identify regions of high LD. Indeed, the likelihood Equation 1 that applies to a sample drawn in the progeny generation is essentially equivalent to taking a subsample of parental haplotypes and the pedigree design is not pertinent to the method.
For long regions of the genome, on the megabase scale, in which several recombination events have occurred between the generations, c exceeds the SE of its estimate, and the method of Clarke and Cardon (2005) may become an increasingly better estimate of c and discriminator between historical and recent recombination. But, for small regions of the genome, the probability of observing recombination events within the pedigree is so low that their estimate of the parameter c is not an estimate of the local recombination rate but is proportional to an estimate of its sampling error, which is then scaled to recombination rate using values estimated over longer regions of the genome. As the sampling variance is approximately inversely proportional to the amount of LD between markers, Clarke and Cardon's (2005) method utilizes historical LD. It therefore detects hotspots by differentiating between high and low areas of LD in the genome as do other methods; but those are designed to make best use of the information on LD (Li and Stephens 2003; McVean et al. 2004). When data on both population LD and enough independent recombinations in parent–offspring trios are available, it seems to us that their combination should make formal use of their separate sampling properties.
Acknowledgments
We thank Geraldine Clarke, Lon Cardon, Bruce Weir, and Mike Goddard for discussions and five referees for comments. P.M.V. acknowledges support from National Health and Medical Research Council of Australia grant 389892.
References
- Altshuler, D., L. D. Brooks, A. Chakravarti, F. S. Collins, M. J. Daly et al., 2005. A haplotype map of the human genome. Nature 437: 1299–1320. [DOI] [PMC free article] [PubMed] [Google Scholar]
- Clarke, G. M., and L. R. Cardon, 2005. Disentangling linkage disequilibrium and linkage from dense single-nucleotide polymorphism trio data. Genetics 171: 2085–2095. [DOI] [PMC free article] [PubMed] [Google Scholar]
- Crawford, D. C., T. Bhangale, N. Li, G. Hellenthal, M. J. Rieder et al., 2004. Evidence for substantial fine-scale variation in recombination rates across the human genome. Nat. Genet. 36: 700–706. [DOI] [PubMed] [Google Scholar]
- Fearnhead, P., R. M. Harding, J. A. Schneider, S. Myers and P. Donnelly, 2004. Application of coalescent methods to reveal fine-scale rate variation and recombination hotspots. Genetics 167: 2067–2081. [DOI] [PMC free article] [PubMed] [Google Scholar]
- Jeffreys, A. J., and R. Neumann, 2002. Reciprocal crossover asymmetry and meiotic drive in a human recombination hot spot. Nat. Genet. 31: 267–271. [DOI] [PubMed] [Google Scholar]
- Kong, X., K. Murphy, T. Raj, C. He, P. S. White et al., 2004. A combined linkage-physical map of the human genome. Am. J. Hum. Genet. 75: 1143–1148. [DOI] [PMC free article] [PubMed] [Google Scholar]
- Li, N., and M. Stephens, 2003. Modeling linkage disequilibrium and identifying recombination hotspots using single-nucleotide polymorphism data. Genetics 165: 2213–2233. [DOI] [PMC free article] [PubMed] [Google Scholar]
- McVean, G. A., S. R. Myers, S. Hunt, P. Deloukas, D. R. Bentley et al., 2004. The fine-scale structure of recombination rate variation in the human genome. Science 304: 581–584. [DOI] [PubMed] [Google Scholar]
- Myers, S., L. Bottolo, C. Freeman, G. McVean and P. Donnelly, 2005. A fine-scale map of recombination rates and hotspots across the human genome. Science 310: 321–324. [DOI] [PubMed] [Google Scholar]
- Visser, R., O. Shimokawa, N. Harada, N. Niikawa and N. Matsumoto, 2005. Non-hotspot-related breakpoints of common deletions in Sotos syndrome are located within destabilised DNA regions. J. Med. Genet. 42: e66. [DOI] [PMC free article] [PubMed] [Google Scholar]