

Abstract
We examined the association between α1-acid glycoprotein (AGP), all-trans-retinol (retinol), and albumin concentrations in a longitudinal animal model of IL-6–induced inflammation. Vitamin A–sufficient (VAS) male Sprague-Dawley rats were administered recombinant human IL-6 [n = 4, 65 μg/(kg·d)] or PBS (n = 4) continuously for 7 d via osmotic minipumps. Plasma samples were obtained daily and concentrations of retinol, AGP, albumin, and total protein were measured. Compared with both baseline and controls, retinol and albumin decreased (P < 0.05), AGP increased (P < 0.05), and total protein concentrations were unaffected in IL-6–treated rats. In vitamin A–deficient (VAD) rats, AGP concentrations were significantly lower at all time points and increased only to one-third of that in VAS rats. The AGP cut-off value indicative of inflammation was 0.11 g/L (i.e., 95% upper limit of baseline concentrations). After 20.5 h, there was an inverse linear correlation between AGP concentrations and the relative change in retinol to baseline (y = −0.18x + 0.48, r = −0.84, P < 0.001). However, changes in AGP and albumin were not correlated (P = 0.94). The application of this function to retinol concentrations in rats from separate experiments showed that hyporetinolemia cannot be adjusted using plasma AGP in VAD or vitamin A–supplemented rats. In conclusion, correcting inflammation-induced hyporetinolemia using an acute-phase protein requires longitudinally derived data, knowledge of vitamin A status, and a common underlying mechanism of change.
Keywords: α1-acid glycoprotein, correction factor, hyporetinolemia, inflammation, vitamin A
Vitamin A is a fat-soluble micronutrient essential in various biological functions including vision, growth, and immunity. Although vitamin A deficiency is defined as having liver stores of vitamin A <0.07 μmol/g (20 μg/g) (1), the routine biochemical method for assessing vitamin A status is to measure serum or plasma concentrations of all-trans-retinol (retinol) (2); concentrations ≤0.70 μmol/L (20 μg/dL) indicate subclinical vitamin A deficiency (3). However, assessing vitamin A status using retinol concentrations alone in the presence of subclinical infections or inflammation is likely to overestimate the prevalence of vitamin A deficiency because inflammation causes hyporetinolemia by reducing the availability of retinol-binding protein (RBP)4 (4–6). Similarly, other micronutrients associated with positive or negative acute-phase proteins (APPs) can be affected, leading to a misclassification of micronutrient status in inflammation-prone areas if concentrations in plasma or serum are used alone (7–9). Therefore, the use of micronutrient status biomarkers that remain relatively unaffected by inflammation or the development of correction factors that account for the effect of inflammation using APPs is recommended (4,10).
For inflammation-induced hyporetinolemia, Thurnham and others (11–13) proposed using a correction factor for plasma retinol concentrations in patients with subclinical infections based on positive APPs, such as C-reactive protein (CRP) or α1-acid-glycoprotein (AGP), alone or in combination. Because RBP is downregulated (6) and CRP and AGP are upregulated (14,15) during the inflammatory response, possibly through similar signals (i.e., IL-6), they are inversely correlated. Thus, it is possible to correct for the reduction of plasma retinol concentrations by using the increased concentrations of APPs. However, the accuracy and precision of these correction factors are questionable because they are based on cross-sectional data obtained from studies that were not designed for this purpose (4). Alternatively, the authors proposed assessment of the prevalence of vitamin A deficiency using the proportion of the ‘‘healthy’’ population without elevated plasma or serum APP concentrations that have hyporetinolemia as an estimate for a community (11). However, Maqsood and colleagues (16) noted that this exclusion process does not improve the prevalence of the estimates and introduces a sampling bias because of differences between the 2 populations (i.e., age, sex, anemia, and morbidity history). Thus, it is necessary to examine this association in a prospective longitudinal study under controlled conditions using a standardized inflammatory stimulus to determine the precision of the association by allowing each animal to be his or her own control.
We propose that the development of a correction factor or function requires the assessment of factors involved in establishing the correlation between changes in concentrations of plasma retinol and a species-specific APP. For this purpose, we developed a correction function based on a set of data from rats with inflammation induced by continuous infusion of recombinant human IL-6 (rhIL-6) and tested this correction function on a set of data from rats with inflammation who received preformed or provitamin A supplements [i.e., retinyl palmitate or β-carotene (BC)]. Our results suggest that it is possible to develop a correction function for vitamin A–sufficient (VAS) rats using concentrations of plasma AGP.
MATERIALS AND METHODS
Materials
Unless otherwise noted, chemical reagents were purchased from EMD Chemicals, Fisher Chemicals, Mallinckrodt Baker, Pharmco, and Sigma Chemical. rhIL-6 was purchased from Austral Biologicals. AGP single radial immunodiffusion (RID) kits were purchased from Tridelta. CRP ELISA kits were purchased from ALPCO. Albumin ELISA kits were purchased from Bethyl Laboratories. Osmotic minipumps were purchased from Alzet. Trimethylmethoxyphenyl (TMMP)-retinol was a generous gift from Hoffmann-La Roche.
Animals, diet, and experimental design
Male pathogen-free Sprague-Dawley rats were purchased from Charles River Breeding Laboratories. All experimental procedures were approved by the Institutional Animal Care and Use Committee at The Pennsylvania State University, University Park. Blood samples and analyte measurements for the present analysis were obtained from a study in which we examined the effect of inflammation on the distribution of retinoids among different tissues (5). Briefly, 6-wk-old VA rats weighing 177–199 g were housed in individual hanging metal wire cages and provided unpurified diet in a feeding jar (Lab Diet 5001 Rodent Diet) containing 0.02 μmol retinyl palmitate/g diet (17). The proximate composition of the diet was 23.4 g protein, 10.0 g fat, 49.9 g carbohydrate and 5.3 g crude fiber/100 g of diet and provided 12.7 kJ of metabolizable energy/g. rhIL-6 [n = 4, 65 μg/(kg·d)] or PBS (n = 4) in 200 μL was adminstered continuously by s.c. infusion for 7 d at 1 μL/h by osmotic minipumps implanted after the induction of anesthesia with isoflurane (4% by volume + oxygen at 0.4 L/min). Blood was collected at baseline and at 7.5, 21, 44, 68, 95, 119, 140, and 164 h after pump implantation.
To test the external validity of the correction factor, we used blood samples and data obtained from a study that examined the effect of inflammation on the intestinal absorption and cleavage of oral pre- or provitamin A supplements (18). Briefly, we used VAS (n = 12) and vitamin A–deficient (VAD; n = 16) male Sprague-Dawley rats that were administered rhIL-6 or PBS at the same dosage as those in the present study. However, blood samples were collected on d 3 of inflammation and 4 h after administration of an oral supplement of 5.6 μmol/L of BC (18).
VAD rats (n =4) were utilized to test the effects of rhIL-6–induced inflammation on the plasma AGP response. Briefly, 3-wk-old rats were fed a VAD diet for 6 wk (19). At 9 wk of age, rats were treated with rhIL-6 via osmotic minipumps implanted s.c. (0 h) for 3 d. Blood samples were collected at 0, 7.5, 21.5, 44, and 68 h after pump implantation.
Blood collection
Whole blood was collected from a caudal blood vessel into heparinized tubes (20 kU heparin/L blood) after nicking the tail with a 10 scalpel blade. After centrifugation (Sorvall RT6000B, H-1000B rotor) at 1300 × g for 15 min at 4°C, plasma was collected, purged with nitrogen gas, and stored at −80°C until analysis (up to 1 mo for retinol and up to 3 mo for the other analytes).
Plasma all-trans-retinol extraction and analysis
Retinol concentrations in plasma were determined using TMMP-retinol as an internal standard (20) after extraction with hexanes; the condition for retinol analysis was a modification of the procedure by Green et al. (21) as described previously by Gieng et al. (5). The reversed-phase system included a Zorbax Eclipse XDB-C8 (5 μm, 4.6 × 150 mm) with a C8 guard column (Agilent Technologies) and a multiple wavelength UV light detector (retinol λ: 325 nm). Briefly, methanol:water (90:10, v:v) was run through the column for 5.25 min after 50 μL of the sample was injected (TMMP-retinol and retinol eluted at ~3 and 4 min, respectively). The flow rate was 1 mL/min and the column temperature was maintained at 25°C.
Plasma AGP, CRP, albumin, and total protein analyses
Plasma AGP concentrations were determined by single RID using a commercial kit. Briefly, 5-μL samples in duplicate were randomly added to precut wells of an agar gel containing anti-rat AGP antibody. Plates were kept in a humidified box and allowed to incubate at room temperature (25°C) for 24 h. Rings were read with a RID ruler, and AGP concentrations were based on a curve of calibrators supplied with the kit after a diameter-squared transformation. Plasma CRP and albumin concentrations were determined by ELISA using commercially available kits and procedures. Total plasma protein concentrations were determined using the modified method from Bio-Rad (Bio-Rad Protein Assay, Bradford method). Rat albumin was diluted to various concentrations with distilled/deionized water (ddH20, Milli-Q Water Purification System; 0.0525–3.36 g/L) and used as calibrators. Sample plasma was diluted 1:99 with ddH20, and 10 μL was added in duplicates to wells of a 96-well plate (Pierce). Bio-Rad Coomassie Blue (200 μL) was added to each well and allowed to incubate for at least 10 min before being read on a Bio-Tek Instruments ultra microplate reader at 630 nm. Calibrators were fit to a 4-parameter equation using the Kineticalc, v2.17 software (Bio-Tek Instruments) and sample protein concentrations were calculated. Methodological CVs for AGP, CRP, albumin and total protein analyses were 9, 2, 3, and 5%, respectively.
Statistical analysis
Values are presented as means ± SD. Pearson’s correlations were determined using SPSS 13.0 for Windows (Chicago, IL). Differences between groups were tested using Student’s t test at a 2-tailed level of P ≤ 0.05. If the SD in the 2 groups differed >2-fold, an approximate test for unequal SD was used (22). A paired t test analysis was used to compare means when they were correlated, i.e., when estimating the difference from baseline. A 1-way ANOVA was used when more than 2 groups were compared with Tukey’s post hoc adjustment for multiple comparisons.
The correction factor for plasma retinol was determined using the algorithm of the linear function between plasma AGP concentrations and the ratio of the retinol concentration to that at baseline at time points ≥20.5 h (y = −0.18x + 0.48). A ratio was utilized for retinol to simplify the process by allowing for the correction of plasma retinol concentrations based on 1 measurement of retinol and AGP. To correct for plasma retinol concentrations, the plasma AGP concentration (only if ≥0.4 g/L) first was entered into the equation in place of x to solve for y. Next, the plasma retinol concentration was divided by y to obtain the corrected value. The use of the ratio of the retinol concentration relative to baseline concentration allows adjustment for the repeated-measures autoregression that is inherent in longitudinal designs. To determine the usefulness of the correction function, it was applied to data from the rats in which the equation was derived (23). The corrected values for retinol did not differ between rhIL-6–treated and placebo controls.
RESULTS
Hyporetinolemia and dynamics of plasma AGP and CRP
Hyporetinolemia was induced with continuous infusion of rhIL-6 in VAS rats. Plasma retinol concentrations decreased 80% from baseline by 68 h and remained decreased for up to 7 d postsurgery as reported previously (5). Plasma concentrations of AGP increased rapidly ~18-fold from 0.08 to a peak of 1.54 g/L by 3 d and remained elevated for the rest of the experiment (Fig. 1). Plasma concentrations of CRP increased ~4-fold from 0.28 to 1.31 g/L by d 3. PBS-treated control rats had slightly elevated plasma AGP concentrations because of the surgical procedure (data not shown); however, there were no changes in CRP or retinol concentrations relative to baseline. The concentration of plasma AGP in control rats was ≤0.37 g/L. In VAD rats with inflammation, plasma AGP concentrations increased from baseline to 3 d; however, they were significantly lower at all time points compared with VAS rats. Mean plasma concentrations of AGP increased to levels approximately one-third that of VAS rats (0.53 vs. 1.54 g/L, P < 0.001) after 3 d of rhIL-6 treatment (Fig. 2).
FIGURE 1.
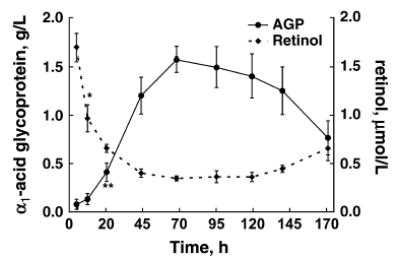
Changes in plasma retinol and AGP concentrations in VAS rats during 7 d of continuous infusion of rhIL-6. Values are means ± SD, n = 4. Asterisks indicate different from baseline (0 h): *P < 0.02; ** P < 0.01 (paired t test).
FIGURE 2.

Plasma AGP response to rhIL-6–induced inflammation in VAD and VAS rats. Values are mean ± SD, n = 4. Asterisks indicate differences between groups: *P ≤ 0.05; **P ≤ 0.01; ***P ≤ 0.001 (Student’s t test).
Determining a cut-off value of serum AGP to indicate inflammation
A cut-off value indicative of inflammation was determined using baseline plasma AGP concentrations from rats with and without inflammation. The mean (95% CI) was 0.09 g/L (0.07, 0.11) and the upper limit of this CI was chosen as the cut-off value. Using this value, all rats administered rhIL-6 had inflammation by 7.5 h that persisted through the remainder of the experiment (7 d). Sham-operated control rats administered PBS vehicle also had some degree of inflammation, most likely due to the surgical implantation of the osmotic minipumps.
Assessing the association between hyporetinolemia and AGP or CRP
In VAS rats, simple linear regression analysis showed an inverse correlation between the absolute concentrations of AGP >0.11 g/L and retinol in plasma during inflammation (r = −0.896, P < 0.001) (Fig. 3). However, there was a threshold in plasma AGP after which it was highly and inversely correlated with retinol concentrations. Therefore, using plasma AGP concentrations ≥0.4 g/L ensured a strong correction factor for plasma retinol (r = −0.843, P < 0.001). This linear function included all plasma AGP and retinol concentrations after 20.5 h. Applying the cut-off value of 0.11 g/L AGP revealed a 100% specificity and sensitivity to detect inflammation based on whether they were treated with rhIL-6 (data not shown). Similarly, we assessed the association between plasma retinol and CRP concentrations. Although plasma CRP concentrations were inversely correlated (r = −0.746, P < 0.001), the slope of the linear function was 67% lower than it was for AGP (−0.27 vs. −0.83, P < 0.001). That is, the linear association between retinol and AGP had a steep slope with a value closer to −1.0, indicating a very strong association between equivalent changes in AGP and retinol.
FIGURE 3.
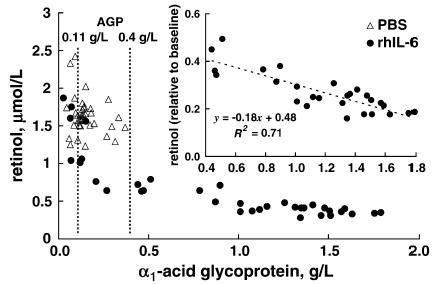
Association between changes in plasma retinol and AGP concentrations in VAS rats treated with rhIL-6 or PBS. Inset: Association between plasma AGP concentration ≥ 0.4 g/L and the ratio of plasma retinol to baseline concentrations. n = 4/group, 8 samples/rat.
Developing a correction factor (function) for inflammation-induced hyporetinolemia
The linear function describing the association of plasma AGP concentration to the relative change in plasma retinol remained inversely correlated (y = −0.18x + 0.48, r = −0.843, P < 0.001; Fig. 3, inset). In contrast, a similar function in PBS-treated control rats was not significant (data not shown). Applying the correction function to plasma retinol concentrations of rats in the supplementation study showed that only VAS rats administered BC had plasma AGP concentrations ≥0.4 g/L on d 3; therefore, the function was applicable only to them. The correction function adjusted the plasma retinol concentrations of VAS rats with inflammation that were administered BC (Fig. 4, VAS, rhIL-6, BC) to values that did not differ from control VAS rats without inflammation (Fig. 4, VAS, C) (P = 0.60). It is important to note that these corrected values were lower than those found in rats without inflammation tat were administered BC (Fig. 4, VAS, PBS, BC) (P = 0.006).
FIGURE 4.
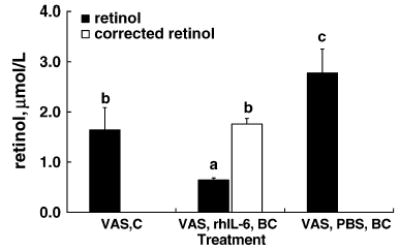
Application of the AGP correction factor in VAS rats that were or were not supplemented with BC and were administered 3 d of rhIL-6 or PBS control (C) treatment. Values are means ± SD, n = 4. Means without a common letter differ, P ≤ 0.05 (1-way ANOVA with Tukey’s post hoc test).
Correction of plasma albumin by AGP
Plasma albumin concentrations were significantly lower than control and baseline concentrations at 3 and 7 d in rhIL-6–treated rats (Table 1). However, the decrease in plasma albumin did not affect total protein concentrations, and protein concentrations on d 3 and 7 did not differ from baseline or between treatment groups (Table 1). To determine whether AGP can be used to correct for albumin, a simple linear regression analysis between plasma albumin and AGP concentrations was conducted. Unlike the relation of AGP and retinol, there was no linear association between plasma AGP and albumin concentrations (P = 0.94) (Fig. 5).
TABLE 1.
Plasma albumin and total protein concentrations in VAS rats treated with rhIL-6 or PBS control1
| Time, d |
||||
|---|---|---|---|---|
| Treatment | Baseline | 3 | 7 | |
| Albumin, g/L | PBS | 40.0 ± 4.8 | 37.0 ± 6.3 | 38.7 ± 5.2 |
| rhIL-6 | 18.0 ± 2.9* | 17.8 ± 4.3* | ||
| Total protein, g/L | PBS | 54.6 ± 24.1 | 48.1 ± 8.2 | 44.3 ± 4.1 |
| rhIL-6 | 52.5 ± 14.0 | 47.2 ± 11.1 | ||
Values are means ± SD, n = 4.
Different from PBS control, P ≤ 0.05.
FIGURE 5.
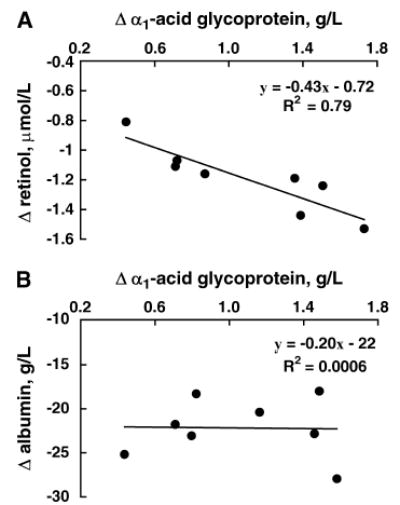
Correlation of the changes from baseline of plasma AGP concentrations with those of retinol (A) and albumin (B) in 4 VAS rats after 3 and 7 d of rhIL-6 treatment. The line is the best-fit line.
DISCUSSION
The purpose of the present study was to examine the association between APPs and hyporetinolemia to assess the factors involved in developing a correction factor or function aiding in its interpretation. In contrast to previous studies, we conducted a longitudinal study and provided a standardized stimulus to induce inflammation, rhIL-6. It has several advantages in that it induces APP synthesis (24), modulates the degree of inflammation, and does not cause tolerance, whereas repeated doses of lipopolysaccharide induce an endotoxin tolerance effect (25). It is important to note that this model of inflammation does not cause anorexia, fever, or growth faltering, nor does it reduce the plasma concentration of vitamin E, a proxy for oxidative stress (5). In addition, we chose AGP as opposed to CRP because in rats, AGP increased rapidly, and for the present purpose, it was the best available indicator of inflammation. However, in human population studies, the benefits of using 2 APPs such as CRP and AGP in combination were well demonstrated in diagnosing inflammation status (11,26).
The diagnosis of inflammation was based on the upper limit of the 95% CI of baseline AGP concentrations. This cut-off value excluded rats that were not experiencing inflammation (e.g., baseline plasma samples) and detected inflammation in rats treated with rhIL-6 and also in rats that underwent surgery and received PBS (i.e., control group). In the latter group, inflammation was generally mild and brief (5). The rise of plasma AGP was observed by 7.5 h postsurgery, suggesting that AGP concentrations may be used both as an early (<24 h) and later indicator of inflammation. It is noteworthy that the selected cut-off value was similar to values reported by others in rats with turpentine-induced inflammation (27). Compared with humans, AGP concentrations in rats were ~90% lower (14). In part, this could be due to the relative homogeneity of the study population, the standardized inflammatory stimulus, or the existence of a different function for AGP in rodents than in humans.
The plasma AGP concentration was inversely associated with hyporetinolemia, as was shown in humans (12,28). In addition, we noted that there was a lag period between increasing AGP concentrations and ensuing low retinol concentrations. This period was characterized by retinol concentrations that had high variability and low correlation with plasma AGP. Once AGP concentrations were ≥0.4 g/L, the association between AGP and plasma retinol was linear and highly correlated. This suggested that a threshold of inflammation must be reached before an adequate correction factor can be developed. In this experiment, plasma AGP concentrations had to increase to at least 3-fold from baseline before AGP was clearly correlated with changes in retinol. The correction function was: [corrected retinol (μmol/L)] = [measured retinol (μmol/L)]/{ 0.48 − 0.18 [AGP (g/L)]}, when AGP is ≥0.4 g/L. For example, at AGP = 0.4 g/L, retinol decreased to 40% of baseline, and for each 0.1 g/L of AGP increase, retinol decreased an additional 1.8%.
In cross-sectional studies in humans, the Pearson correlation coefficients between AGP and retinol concentrations ranged from −0.19 to −0.40 (12,16,28–32), whereas in the present study, the correlation coefficient was greater (AGP concentrations ≥0.4 g/L vs. ratio of retinol to baseline concentrations, r = −0.84, P < 0.001). Hence, correction factors or linear functions based on longitudinal studies of human populations may more accurately adjust for the effect of inflammation-induced hyporetinolemia and aid in its interpretation in relation to vitamin A status.
Virtually all plasma samples of VAS rats had concentrations of AGP ≥0.4 g/L by 20.5 h, indicating that after ~1 d of inflammation, plasma retinol can be corrected using AGP concentrations. In contrast, this was not the case in VAD rats with inflammation, where most plasma AGP concentrations remained <0.4 g/L. This impeded using the correction function to adjust the plasma retinol concentrations of VAD rats with inflammation that were administered BC supplements. Additionally, the dynamics of AGP’s response to inflammation was reduced by vitamin A deficiency (Fig. 2), although previously it was suggested that an increase in AGP during infection is independent of vitamin A status (33). Consequently, a correction function may be useful only for rats that are vitamin A sufficient. In VAD rats, the correlation coefficient was low between plasma AGP and retinol concentrations; thus, developing a correction function to account for the effect of inflammation was not practical. A possible mechanism for this may be the ability of retinoids to affect AGP gene expression directly (34).
The reliability of this correction function was tested by adjusting plasma retinol concentrations from VAS rats with inflammation who were administered a BC supplement. However, the function did not affect the plasma retinol concentrations of rats with inflammation because the corrected values were significantly lower than those of rats without inflammation who were administered BC (Fig 4). This indicated that either correcting retinol concentrations may not be accurate during vitamin A supplementation, or that the corrected value indicated the true set-point of plasma retinol concentration in light of supplementation and that the elevated concentration was transient. An explanation may be that the low-level supplement did not change the rat’s vitamin A status (i.e., elevated concentrations of plasma retinol in rats administered oral BC were transient); thus, it is plausible that the corrected concentrations were similar to those of untreated control rats. However, this same effect was reported in children with infections in which an increase in plasma BC was observed without an increase in plasma retinol after BC supplementation (35). In addition Wieringa et al. (13) demonstrated a reduction in serum retinol concentrations in children with inflammation (i.e., high CRP or AGP levels) who were administered BC for 6 mo. Moreover, these results indicate that correcting for the effect of inflammation may not be possible during vitamin A supplementation. Human studies have not assessed or determined the lack of reliability of APPs in correcting for inflammation-induced hyporetinolemia during vitamin A supplementation or in vitamin A deficiency because they lacked the means of controlling for these factors during inflammation.
Albumin is a negative APP; in the present study it decreased significantly during inflammation without affecting total protein concentrations. The generation of APPs during the acute-phase response usually involves the reprogramming of plasma protein gene expression in hepatocytes either positively or negatively (14,36). Examples of this include the reduction of RBP [the cause of inflammation-induced hyporetinolemia (5,6)] and the increase in AGP (37). However, for albumin, the mechanism is an increased transcapillary escape rate (38), where it diffuses from the intravascular space into the extra-vascular space more rapidly than in the reverse direction, leading to its net decrease in plasma. Thus, the correlation between albumin and AGP was not significant unlike that between RBP and AGP. Nonetheless, because albumin is considered to be a carrier of many nutrients in the blood, its reduction during inflammation may have secondary consequences to the availability of other micronutrients such as zinc (39) and all-trans-retinoic acid (40).
In summary, plasma AGP concentrations ≥0.4 g/L and measured >20.5 h after initial rhIL-6–induced inflammation were used to make accurate corrections of retinol concentrations in VAS rats. VAD rats, however, had attenuated plasma AGP responses; thus, their retinol concentrations could not be corrected for in the present study. In addition, in VAS and supplemented rats, the correction function did not adjust retinol concentrations. Thus, vitamin A status, similar underlying mechanisms, a longitudinal design, and a threshold of inflammation are all important factors in developing a correction factor or function for inflammation-induced hyporetinolemia.
Footnotes
Some data were published previously [Gieng SH, Raila J, Rosales FJ. Accumulation of retinol in the liver after prolonged hyporetinolemia in the vitamin A-sufficient rat. J Lipid Res. 2005;46:641–9].
Supported by the National Institute of Diabetes and Digestive and Kidney Diseases (RO3 DK-062166).
Abbreviations used: AGP, α1-acid-glycoprotein; APP, acute-phase protein; BC, β-carotene; CRP, C-reactive protein; RBP, retinol-binding protein; rhIL-6, recombinant human IL-6; RID, radial immunodiffusion; TMMP, trimethylmethoxyphenyl; VAD, vitamin A–deficient; VAS, vitamin A–sufficient.
References
- 1.Sommer A, Davidson FR. Assessment and control of vitamin A deficiency: the Annecy Accords. J Nutr. 2002;132:2845S–50. doi: 10.1093/jn/132.9.2845S. [DOI] [PubMed] [Google Scholar]
- 2.World Health Organization. Indicators for assessing vitamin A deficiency and their application in monitoring and evaluating intervention programmes. Geneva, Switzerland: WHO/NUT/96.10; 1996.
- 3.de Pee S, Dary O. Biochemical indicators of vitamin A deficiency: serum retinol and serum retinol binding protein. J Nutr. 2002;132:2895S–901. doi: 10.1093/jn/132.9.2895S. [DOI] [PubMed] [Google Scholar]
- 4.Tomkins A. Assessing micronutrient status in the presence of inflammation. J Nutr. 2003;133:1649S–55. doi: 10.1093/jn/133.5.1649S. [DOI] [PubMed] [Google Scholar]
- 5.Gieng SH, Raila J, Rosales FJ. Accumulation of retinol in the liver after prolonged hyporetinolemia in the vitamin A-sufficient rat. J Lipid Res. 2005;46:641–9. doi: 10.1194/jlr.M400415-JLR200. [DOI] [PubMed] [Google Scholar]
- 6.Rosales FJ, Ritter SJ, Zolfaghari R, Smith JE, Ross AC. Effects of acute inflammation on plasma retinol, retinol-binding protein, and its mRNA in the liver and kidneys of vitamin A-sufficient rats. J Lipid Res. 1996;37:962–71. [PubMed] [Google Scholar]
- 7.Brown KH, Lanata CF, Yuen ML, Peerson JM, Butron B, Lönnerdal B. Potential magnitude of the misclassification of a population’s trace element status due to infection: example from a survey of young Peruvian children. Am J Clin Nutr. 1993;58:549–54. doi: 10.1093/ajcn/58.4.549. [DOI] [PubMed] [Google Scholar]
- 8.Abraham K, Muller C, Gruters A, Wahn U, Schweigert FJ. Minimal inflammation, acute phase response and avoidance of misclassification of vitamin A and iron status in infants—importance of a high-sensitivity C-reactive protein (CRP) assay. Int J Vitam Nutr Res. 2003;73:423–30. doi: 10.1024/0300-9831.73.6.423. [DOI] [PubMed] [Google Scholar]
- 9.Kaestel P, Lewis FJ, Willingham AL, Bogh HO, Eriksen L, Michaelsen KF, Sandstrom B, Hoy CE, Friis H. Schistosoma japonicum infection and serum and tissue concentrations of retinol and zinc in pigs. Ann Trop Med Parasitol. 1999;93:489–99. [PubMed] [Google Scholar]
- 10.Rosales FJ, Ross AC. A low molar ratio of retinol binding protein to transthyretin indicates vitamin A deficiency during inflammation: studies in rats and a posterior analysis of vitamin A-supplemented children with measles. J Nutr. 1998;128:1681–7. doi: 10.1093/jn/128.10.1681. [DOI] [PubMed] [Google Scholar]
- 11.Thurnham DI, McCabe GP, Northrop-Clewes CA, Nestel P. Effects of subclinical infection on plasma retinol concentrations and assessment of prevalence of vitamin A deficiency: meta-analysis. Lancet. 2003;362:2052–8. doi: 10.1016/s0140-6736(03)15099-4. [DOI] [PubMed] [Google Scholar]
- 12.Christian P, Schulze K, Stoltzfus RJ, West KP., Jr Hyporetinolemia, illness symptoms, and acute phase protein response in pregnant women with and without night blindness. Am J Clin Nutr. 1998;67:1237–43. doi: 10.1093/ajcn/67.6.1237. [DOI] [PubMed] [Google Scholar]
- 13.Wieringa FT, Dijkhuizen MA, West CE, Northrop-Clewes CA, Muhilal Estimation of the effect of the acute phase response on indicators of micronutrient status in Indonesian infants. J Nutr. 2002;132:3061–6. doi: 10.1093/jn/131.10.3061. [DOI] [PubMed] [Google Scholar]
- 14.Fleck A. Clinical and nutritional aspects of changes in acute-phase proteins during inflammation. Proc Nutr Soc. 1989;48:347–54. doi: 10.1079/pns19890050. [DOI] [PubMed] [Google Scholar]
- 15.Lyoumi S, Tamion F, Petit J, Dechelotte P, Dauguet C, Scotte M, Hiron M, Leplingard A, Salier JP, et al. Induction and modulation of acute-phase response by protein malnutrition in rats: comparative effect of systemic and localized inflammation on interleukin-6 and acute-phase protein synthesis. J Nutr. 1998;128:166–74. doi: 10.1093/jn/128.2.166. [DOI] [PubMed] [Google Scholar]
- 16.Maqsood M, Dancheck B, Gamble MV, Palafox NA, Ricks MO, Briand K, Semba RD. Vitamin A deficiency and inflammatory markers among preschool children in the Republic of the Marshall Islands. Nutr J. 2004 December 8;3:21. doi: 10.1186/1475-2891-3-21. 2004. doi:10.1186/1475-2891-3-21. [DOI] [PMC free article] [PubMed] [Google Scholar]
- 17.LabDiet [homepage on the internet]. PMI Nutrition International; c1996–2002 [cited 2004 Oct 8]. Laboratory Rodent Diet 5001. Available from: http://www.labdiet.com
- 18.Rosales FJ, Gieng SH. Interleukin-6-induced inflammation neither impairs intestinal absorption/cleavage of beta-carotene nor the absorption of retinyl palmitate in male Sprague-Dawley rats, abstract 451.5. [database on the Internet]. Experimental Biology and XXXV International Congress of Physiological Sciences meeting abstracts. c2005 [cited 2005 Dec 17]. Available from: http://select.biosis.org/faseb
- 19.Reeves PG, Nielsen FH, Fahey GC., Jr AIN-93 purified diets for laboratory rodents: final report of the American Institute of Nutrition ad hoc writing committee on the reformulation of the AIN-76A rodent diet. J Nutr. 1993;123:1939–51. doi: 10.1093/jn/123.11.1939. [DOI] [PubMed] [Google Scholar]
- 20.Ross AC. Separation and quantitation of retinyl esters and retinol by high-performance liquid chromatography. Methods Enzymol. 1986;123:68–74. doi: 10.1016/s0076-6879(86)23010-4. [DOI] [PubMed] [Google Scholar]
- 21.Green MH, Snyder RW, Akohoue SA, Green JB. Increased rat mammary tissue vitamin A associated with increased vitamin A intake during lactation is maintained after lactation. J Nutr. 2001;131:1544–7. doi: 10.1093/jn/131.5.1544. [DOI] [PubMed] [Google Scholar]
- 22.Armitage P, Berry G. Statistical methods in medical research. 3rd ed. London: Blackwell Scientific Publications; 1994. p. 112–3.
- 23.Gieng SH, Dorward JL, Rosales FJ. Prolonged inflammation-induced hyporetinemia by recombinant human interleukin-6 (IL-6) [abstract] FASEB J. 2003;17:A314. [Google Scholar]
- 24.Geiger T, Andus T, Klapproth J, Hirano T, Kishimoto T, Heinrich PC. Induction of rat acute-phase proteins by interleukin 6 in vivo. Eur J Immunol. 1988;18:717–21. doi: 10.1002/eji.1830180510. [DOI] [PubMed] [Google Scholar]
- 25.Dominguez Fernandez E, Flohe S, Siemers F, Nau M, Schade FU. Endotoxin tolerance in rats: influence on LPS-induced changes in excretory liver function. Inflamm Res. 2002;51:500–5. doi: 10.1007/pl00012419. [DOI] [PubMed] [Google Scholar]
- 26.Sankaranarayanan S, Untoro J, Erhardt J, Gross R, Rosales FJ. Daily iron alone but not in combination with multimicronutrients increases plasma ferritin concentrations in Indonesian infants with inflammation. J Nutr. 2004;134:1916–22. doi: 10.1093/jn/134.8.1916. [DOI] [PubMed] [Google Scholar]
- 27.Ikawa M, Shozen Y. Quantification of acute phase proteins in rat serum and in the supernatants of a cultured rat hepatoma cell line and cultured primary hepatocytes by an enzyme-linked immunosorbent assay. J Immunol Methods. 1990;134:101–6. doi: 10.1016/0022-1759(90)90117-e. [DOI] [PubMed] [Google Scholar]
- 28.Dancheck B, Nussenblatt V, Ricks MO, Kumwenda N, Neville MC, Moncrief DT, Taha TE, Semba RD. Breast milk retinol concentrations are not associated with systemic inflammation among breast-feeding women in Malawi. J Nutr. 2005;135:223–6. doi: 10.1093/jn/135.2.223. [DOI] [PubMed] [Google Scholar]
- 29.Adelekan DA, Northrop-Clewes CA, Owa JA, Oyedeji AO, Owoeye AA, Thurnham DI. Use of biomarkers of sub-clinical infection, nutrition and neonatal maturity to interpret plasma retinol in Nigerian neonates. Br J Nutr. 2003;90:353–61. doi: 10.1079/bjn2003907. [DOI] [PubMed] [Google Scholar]
- 30.Paracha PI, Jamil A, Northrop-Clewes CA, Thurnham DI. Interpretation of vitamin A status in apparently healthy Pakistani children by using markers of subclinical infection. Am J Clin Nutr. 2000;72:1164–9. doi: 10.1093/ajcn/72.5.1164. [DOI] [PubMed] [Google Scholar]
- 31.Semba RD, Muhilal, West KP, Jr, Natadisastra G, Eisinger W, Lan Y, Sommer A. Hyporetinolemia and acute phase proteins in children with and without xerophthalmia. Am J Clin Nutr. 2000;72:146–53. doi: 10.1093/ajcn/72.1.146. [DOI] [PubMed] [Google Scholar]
- 32.Rosales FJ, Topping JD, Smith JE, Shankar AH, Ross AC. Relation of serum retinol to acute phase proteins and malarial morbidity in Papua New Guinea children. Am J Clin Nutr. 2000;71:1582–8. doi: 10.1093/ajcn/71.6.1582. [DOI] [PubMed] [Google Scholar]
- 33.Filteau SM, Morris SS, Abbott RA, Tomkins AM, Kirkwood BR, Arthur P, Ross DA, Gyapong JO, Raynes JG. Influence of morbidity on serum retinol of children in a community-based study in northern Ghana. Am J Clin Nutr. 1993;58:192–7. doi: 10.1093/ajcn/58.2.192. [DOI] [PubMed] [Google Scholar]
- 34.Mouthiers A, Mejdoubi N, Baillet A, Amelie PA, Porquet D. Retinoids increase alpha-1 acid glycoprotein expression at the transcriptional level through two distinct DR1 retinoic acid responsive elements. Biochim Biophys Acta. 2004;1678:135–44. doi: 10.1016/j.bbaexp.2004.03.005. [DOI] [PubMed] [Google Scholar]
- 35.Persson V, Ahmed F, Gebre-Medhin M, Greiner T. Increase in serum beta-carotene following dark green leafy vegetable supplementation in Mebendazole-treated school children in Bangladesh. Eur J Clin Nutr. 2001;55:1–9. doi: 10.1038/sj.ejcn.1601108. [DOI] [PubMed] [Google Scholar]
- 36.Baumann H, Gauldie J. The acute phase response. Immunol Today. 1994;15:74–80. doi: 10.1016/0167-5699(94)90137-6. [DOI] [PubMed] [Google Scholar]
- 37.Fournier T, Medjoubi NN, Porquet D. Alpha-1-acid glycoprotein. Biochim Biophys Acta. 2000;1482:157–71. doi: 10.1016/s0167-4838(00)00153-9. [DOI] [PubMed] [Google Scholar]
- 38.Ruot B, Papet I, Bechereau F, Denis P, Buffiere C, Gimonet J, Glomot F, Elyousfi M, Breuille D, Obled C. Increased albumin plasma efflux contributes to hypoalbuminemia only during early phase of sepsis in rats. Am J Physiol Regul Integr Comp Physiol. 2003;284:R707–13. doi: 10.1152/ajpregu.00483.2002. [DOI] [PubMed] [Google Scholar]
- 39.Cousins RJ. Toward a molecular understanding of zinc metabolism. Clin Physiol Biochem. 1986;4:20–30. [PubMed] [Google Scholar]
- 40.Goodman DS. Overview of current knowledge of metabolism of vitamin A and carotenoids. J Natl Cancer Inst. 1984;73:1375–9. [PubMed] [Google Scholar]