

Abstract
Background
Methylmercury (MeHg) is a known neurotoxic agent, but the mechanisms by which MeHg may act on reproductive pathways are relatively unknown. Several studies have indicated potential changes in hormone levels as well as declines in vertebrates with increasing dietary MeHg exposure.
Objectives
The purpose of this study was to identify alterations in gene expression associated with MeHg exposure, specifically those associated with previously observed changes in reproduction and reproductive biomarkers. Fathead minnows, Pimephales promelas, were fed one of three diets that were similar to documented concentrations of MeHg in the diets of wild invertivorous and piscivorous fish. We used a commercial macroarray in conjunction with quantitative polymerase chain reaction to examine gene expression in fish in relation to exposure to these environmentally relevant doses of MeHg.
Results
Expression of genes commonly associated with endocrine disruption was altered with Hg exposure. Specifically, we observed a marked up-regulation in vitellogenin mRNA in individual Hg-exposed males and a significant decline in vitellogenin gene expression in female fish with increasing Hg concentrations. Other genes identified by the macroarray experiment included those associated with egg fertilization and development, sugar metabolism, apoptosis, and electron transport. We also observed differences in expression patterns between male and female fish not related to genes specifically associated with reproduction, indicating a potential physiological difference in the reaction of males and females to MeHg.
Conclusion
Gene expression data may provide insight into the mechanisms by which MeHg affects reproduction in fish and indicate how MeHg differs in its effect from other heavy metals and endocrine-disrupting compounds.
Keywords: endocrine disruption, gene expression, mercury, methylmercury, microarray, Pimephales promelas, reproduction, toxicogenomics, vitellogenin
Mercury is prevalent in the environment as a result of both natural processes and emissions from anthropogenic sources (Keating et al. 1997; Wiener et al. 2003). However, atmospheric deposition from anthropogenic emissions such as coal power plants is frequently the major source of Hg in aquatic systems (Landis and Keeler 2002). After deposition, inorganic Hg is methylated by microbes, then biomagnified in aquatic food webs. Subsequently, the greatest concentrations of methylmercury (MeHg) are found in piscivorous fish and wildlife (Spry and Wiener 1991; Watras and Bloom 1992). MeHg is the most toxic form of Hg, and nearly all (95–99%) Hg in fish is MeHg (Bloom 1992; Grieb et al. 1990).
The environmental risks associated with MeHg have been explored mainly in relationship to the risks to human health associated with consumption of contaminated fish. The main route of MeHg exposure in humans is through fish consumption, and the body burden of MeHg in humans is directly correlated to the quantities of fish consumed (Bjornberg et al. 2005; Cole et al. 2004). Hg in its methylated form is neurotoxic, particularly to developing nervous systems, and has been associated with many different neurological problems, from learning disabilities and behavioral changes to death (National Research Council 2000; Zelikoff et al. 1995). However, the mechanistic effects of MeHg on other physiological processes such as reproduction are relatively unknown, and there are comparatively few studies that examine risks of MeHg exposure on fish populations themselves (Armstrong 1979; Spry and Wiener 1991; Wiener et al. 2003).
The few studies on the impact of MeHg contamination on fish have shown consequences for reproduction. For example, fat-head minnows (FHM), Pimephales promelas, fed MeHg-contaminated diets that simulated concentrations found in zooplankton, invertebrates, and small fish in North America showed a delay in spawning, a decline in spawning activity, and a decline in the number of eggs laid (Hammerschmidt et al. 2002) with increasing MeHg. Dietary MeHg impairs gonadal development in walleye (Sander vitreus; Friedmann et al. 1996), FHM (Hammerschmidt et al. 2002) and walking catfish (Clarias batrachus; Kirubagaran and Joy 1988, 1992) and causes testicular atrophy in guppies (Wester 1991).
The mechanism by which MeHg alters reproduction is unclear. However, there is some indication that MeHg suppresses sex hormones that elicit secondary sex characteristics and stimulate gonadal development and game-togenesis. In the companion study (Drevnick and Sandheinrich 2003) to the present article, exposure to environmentally relevant concentrations of MeHg inhibited gonadal development and suppressed estrogen production in female FHM and testosterone in male FHM. Male fish fed a control diet had mean testosterone concentrations that were 20 and 116% greater than those fed low-MeHg (0.87 μg/g dry wt) and medium-MeHg (3.93 μg/g dry wt) diets, respectively. Female fish fed a control diet had mean estrogen concentrations that were 164 and 416% greater than those fed low- and medium-MeHg diets. Other studies have found similar results in fish at various concentrations (Arnold et al. 1998; Fynn-Aikins et al. 1998). MeHg also interferes with vitellogenesis (Kirubagaran and Joy 1988) and spermatogenesis (Kirubagaran and Joy 1992).
Genomic markers provide a useful tool to examine the physiological mechanisms that may be affected by toxicant exposure [for review see Klaper and Thomas (2004)]. Genomic techniques allow simultaneous measurement of multiple biochemical pathways at levels of sensitivity not available with other biomarkers. Moreover, they provide information that cannot be obtained with currently available tests such as traditional ELISA assays (Klaper and Thomas 2004).
Recent evidence has demonstrated the utility of genomic techniques in assessing the effects of dietary MeHg on fish. Using real-time quantitative polymerase chain reaction (qPCR), Gonzalez et al. (2005) examined the expression of 13 genes in muscle, liver, and brain tissue of zebrafish (Danio rerio). Dietary exposures of 5 and 13.5 μg MeHg/g dry wt increased expression of genes cytochrome c oxidase subunit I (coxI) and cytoplasmic superoxide dismutase (sod) associated with mitochondrial metabolism and production of reactive oxygen species (ROS) in liver and skeletal muscle. The specific changes in gene expression in that study provide an indication of the potential mechanisms by which MeHg may be affecting these tissues. However, the study did not examine gene expression in relation to a specific physiological response and did not examine genes involved in reproduction pathways, and exposures were higher than normal environmental exposures.
In the research presented here we assessed gene expression in FHM fed diets contaminated with environmentally relevant concentrations of MeHg as a continuation of the previous study by Drevnick and Sandheinrich (2003) that found altered reproduction associated with increased MeHg exposure. We used a combination of genomic techniques, including a commercial macroarray, a suppressive subtraction hybridization, and qPCR, to identify differentially expressed genes associated with MeHg exposure in the FHM. The goal of this research was to begin to examine the mechanistic relationship between reproductive changes and gene expression and to identify potential endocrine changes that may be linked to MeHg exposure.
Materials and Methods
Test organisms
We obtained embryos of FHM from the Upper Midwest Environmental Sciences Center (U.S. Geological Survey, La Crosse, WI) and raised them to maturity. Before exposure, larvae were fed Artemia nauplii for 60 days and then fed Sterling Silver Cup Fish Food (Nelson and Sons Inc., Murray, UT) for 30 days. Subsequently, 200 fish were transferred to each of fifteen 180-L flow-through aquaria for exposure studies. Aquaria were filled with well water, temperature was maintained at 23.6 ± 0.1°C, and each received a 16/8-hr light/dark photoperiod cycle. Additional information on the experimental design and culturing of FHM can be found in Drevnick and Sandheinrich (2003).
MeHg exposure treatments and RNA extraction
Minnows were fed food containing one of three concentrations of MeHg at 5% body mass per day: control (0.058 ± 0.004 μg/g dry wt), low MeHg (0.87 ± 0.02 μg/g dry wt), or medium MeHg (3.93 ± 0.08 μg/g dry wt). All three concentrations were designed to represent the diets of insectivorous and piscivorous fish from some midcontinental low-alkalinity lakes contaminated with Hg from non-point sources (Hammerschmidt et al. 2002). Diets were prepared by mixing food with methyl-mercuric chloride in alcohol. Control diets were mixed with alcohol alone. Alcohol was evaporated from the food, and the diet was frozen until use. Fish were fed their respective food treatment for 600 days. Fish in this study were used in accordance with protocols approved by the University of Wisconsin–La Crosse Institutional Animal Care and Use Committee. Animals used were treated humanely and with regard for the alleviation of suffering. After 600 days the fish were euthanized. The liver was harvested, placed in 2 mL of Trizol reagent (Invitrogen, Carlsbad, CA) and kept at –80°C until extraction. RNA was extracted per manufacturer’s intructions for Trizol.
Macroarray construction and analysis
The macroarray used in the experiment was a commercially available 200-gene FHMinnow array from EcoArray, Inc. (Alachua, FL; http://www.ecoarray.com/). Arrays were constructed, hybridized, and analyzed at EcoArray as previously described (Larkin et al. 2002, 2003). Arrays consisted of cDNA spotted in duplicate onto 11.5 × 7.6-cm neutral nylon membranes. Controls included water blanks, Cot-1 repetitive sequences, M13 sequence, and exogenous spiking genes from Arabidopsis thaliana used for normalization purposes (SpotReport 3; Stratagene, La Jolla, CA). Total RNA was DNase treated (Ambion, Austin, TX) and radiolabeled with (α-33P)dATP (Strip-EZ RT; Ambion), and 0.6 ng of spiking RNA was added to each labeling reaction. After hybridization, we quantitatively evaluated the arrays using a Typhoon 8600 imaging system (Amersham Pharmacia Biotech, Molecular Dynamics, Sunnyvale, CA).
Macroarray experimental design
We exposed sixteen membranes for the macroarray experiment. Four fish of each sex were chosen from both the control and highest MeHg dose treatment based on highest RNA quality as determined by absorbance at 260/280 nm and gel electrophoresis. Each sample was separately exposed to array. For each cDNA clone represented on the membrane, we substracted the general background of each membrane from the average value of the duplicate spots on the membrane. The values were then normalized to the average value of two spiking genes that were spotted on the membranes. Data from control and MeHg-treated fish were compared with a t-test. Additional information about genes found on the 200-gene FHMinnow array is provided in the Supplemental Material available online for this article (http://www.ehponline.org/members/2006/8786/supplemental.pdf).
qPCR analysis
qPCR was performed for 10 individuals from each treatment for a select number of genes. Genes were selected by cross-referencing differentially expressed genes in the macroarray data with genes found in a suppressive subtraction hybridization. Because gene sequence is necessary to design primers for qPCR, genes identified through suppressive subtractions that also showed significant differential expression on macroarrays were chosen for qPCR analysis. These included FHM vitellogenin [vtg, GenBank accession no. AF130354; http://www.ncbi.nih.gov)] and zona pellucida 2 (zp2, GenBank accession no. EB684274). In addition apolipoprotein (apo, GenBank accession no. EB684272) and nuclear autoantigenic sperm protein (nasp, GenBank accession no. EB684273 ) were also identified through suppressive subtraction and were chosen because of their role in reproduction.
Primers for PCR were selected in areas of intron/exon junctions (where possible) to minimize the potential for DNA amplification during qPCR. To determine splice sites, each gene sequence was aligned to zebrafish sequences [ZFIN database (Zebrafish Information Network; http://zfin.org)] using bl2seq (Tatusova and Madden 1999] and compared to intron–exon junctions on the ZFIN database. Primers (Table 1) were chosen to amplify approximately 150 bp of each target gene and designed to have approximately similar melting temperatures (52–58°C) and a guanine and cytosine content of 40–60% with minimal repeats. All primers were synthesized and HPLC purified at Integrated DNA Technologies (Coralville, IA).
Table 1.
Primers used for qPCR and RNA standards for qPCR.
| Gene locusa | Primer | Primer sequence | Product size (bp) |
|---|---|---|---|
| vtg | cRNA FP | TAATACGACTCACTATAGG | |
| CATCAAGGAGAAGTTCCTGGCT | 401 | ||
| cRNA RP | ATTTAGGTGACACTATAGAGGT | ||
| AGGAGCTTCATGATGGT | |||
| apo | cRNA FP | TAATACGACTCACTATAGG | |
| GCTTAGTTGAAGTAGTCAGTG | 426 | ||
| cRNA RP | ATTTAGGTGACACTATAGC | ||
| CTGACAAGGAGTTAGTTGAGA | |||
| nasp | cRNA FP | TAATACGACTCACTATAGG | |
| TCAGAGGATTCTTCTGGGACTC | 363 | ||
| cRNA RP | ATTTAGGTGACACTATAGC | ||
| GAGGAAACAGCATCTGCTTCA | |||
| zp2 | cRNA FP | TAATACGACTCACTATAGGGTA | |
| CACTTCCTACTACAGTG | 372 | ||
| cRNA RP | ATTTAGGTGACACTATAGAGATG | ||
| GTTTCCTGCAGAGGAG | |||
| vtg | FP | TGACAGCTAGTTTGGCTATG | 149 |
| RP | AATATCATGGATGGGCCTGA | ||
| apo | FP | CACTGGCCAGACCGCTGATAA | 155 |
| RP | GAGGATTGTCACTGCTTGGGA | ||
| nasp | FP | CTTCTCAGCTAGCATGGCACAA | 133 |
| RP | GCAGACAGCTCCGTCGATGTTA | ||
| zp2 | FP | GATGGATGCCCTTACCAGGATG | 157 |
| RP | AGATGGTTTCCTGCAGAGGAG |
Abbreviations: FP, forward primer; RP, reverse primer.
Primary sequences submitted to GenBank (http://www.ncbi.nih.gov/Genbank).
Recombinant cRNA standards were used for quantification using standard curves as described (Rees and Li 2004; Vanden Heuvel 1998). Briefly, cRNA standards for each of the genes listed above ranged in size from 321 to 448 bp (Table 1). A cRNA PCR product containing a 5′ T7 promoter, a region of targetgene–specific sequence including the region of the real-time amplicon, and an SP6 promoter at the 3′ end (Figure 1) was created using cDNA from a sample (GeneAmp RNA PCR Kit; Applied Biosystems, Foster City, CA). The cRNA product was reamplified, cleaned (QIAquick PCR Purification Kit; Qiagen, Valencia, CA), and transcribed using the Riboprobe In Vitro Transcription System (Promega Corp., Madison, WI) according to standard protocol. Each cRNA was DNase-treated (Promega Corp.) with RQ1 RNase-free DNase followed by phenol:chloroform extraction (24:1). The aqueous phase was isolated and extracted with chloroform–isoamyl alcohol (24:1) followed by an overnight ethanol precipitation at –20°C. Each cRNA pellet was resuspended in 20 μL RNase-free water (Gibco, Invitrogen, Grand Island, NY) and filtered through a NucAway Spin Column (Ambion) to remove free nucleotides. The size and quality of the cRNA standard were verified by analysis on an agarose gel and quantified at 260 nm.
Figure 1.

Diagram demonstrating design of cRNA standards for qPCR.
First-strand cDNA for samples was synthesized using the GeneAmp RNA PCR kit (Ambion). Reactions were incubated at room temperature for 10 min; incubated for 30 min at 42°C, 5 min at 99°C; then stored at –20°C until used for template in PCR. Products were quantified using Brilliant SYBR Green QPCR (Stratagene) according to manufacturer’s directions and 300 nM of each primer. PCR reactions were analyzed on an MJ Research DNA Engine Opticon System (BioRad Laboratories, Waltham, MA) under the following conditions: 1 cycle of 95°C for 5 min, 40 cycles of 94°C for 30 sec, 56°C for 30 sec, 72°C for 1 min, and 1 cycle at 72°C for 10 min. The cycle threshold [C(t)] was manually set at 0.005 for all plates. A melting curve was generated to check for presence of nonspecific PCR products. Target gene samples were performed in triplicate, and copy number was estimated against a standard curve. Negative PCR controls were used to check for genomic DNA contamination, and all real time-reverse transcriptase PCR products were run on agarose gels. Treatments were compared using a Kruskall-Wallis test as analyzed with SPSS (version 13.0; SPSS, Inc., Chicago, IL).
Results
Detection of changes in gene expression using macroarray
Dietary MeHg altered the expression of dozens of genes in liver tissue, including those related to reproduction. Using the EcoArray macroarray, we were able to identify 76 genes in female FHM and 42 in males that were differentially expressed (2-fold difference) between the highest-MeHg-exposed fish and controls as determined by comparing the average for each sex over each treatment. However, large variation in response among individual fish and small sample size (n = 4 macroarrays per sex, per treatment) resulted in a large number of statistically nonsignificant values (Tables 2, 3).
Table 2.
Macroarray gene expression resultsa for female FHM exposed to MeHg-contaminated diets (3.93 ± 0.08 μg MeHg/g dry wt) versus control diets (0.058 ± 0.004 μg MeHg/g dry wt).
| Gene name | Fold change | p-Value |
|---|---|---|
| vitellogenin 1 | 0.6 | 0.3113 |
| vitellogenin precursor | 0.6 | 0.4106 |
| glyceraldehyde 3-phosphate dehydrogenase | 1.7 | 0.0263 |
| novel retinal pigment epithelial gene (NORPEG) | 2.0 | 0.3606 |
| piwi protein | 2.0 | 0.5345 |
| phosphoenolpyruvate carboxykinase | 2.0 | 0.2376 |
| heat shock protein 90-beta | 2.0 | 0.2320 |
| L-pipecolic acid oxidase | 2.0 | 0.4516 |
| actin 1 | 2.0 | 0.0689 |
| heat shock protein Hsp70 | 2.0 | 0.5003 |
| dual specificity phosphatase 13; protein phosphatase | 2.0 | 0.4574 |
| cytosolic branched-chain amino acid aminotransferase | 2.0 | 0.4710 |
| histone H1-0 | 2.0 | 0.4968 |
| isocitrate dehydrogenase 2 (NADP+), mitochondrial | 2.0 | 0.4458 |
| G protein pathway suppressor 1; Arabimdopsis FUS6/COP11 homolog | 2.1 | 0.1854 |
| X-box-binding protein 1B | 2.1 | 0.4827 |
| cathepsin D precursor | 2.1 | 0.3563 |
| von Willebrand factor-cleaving protease precursor | 2.1 | 0.4257 |
| pyruvate kinase | 2.1 | 0.5065 |
| A-kinase anchoring protein-associated sperm protein | 2.1 | 0.4567 |
| oxysterol binding protein-like 9 isoform a | 2.1 | 0.2378 |
| mannose binding-like lectin | 2.1 | 0.4514 |
| bile salt export pump | 2.2 | 0.1110 |
| transcription factor JUN-B | 2.2 | 0.3334 |
| glutathione S-transferase 1 (GST-CL1) (GST CLASS-THETA) | 2.2 | 0.4336 |
| ventricular myosin heavy chain | 2.3 | 0.3905 |
| acyl carrier protein, mitochondrial precursor (ACP) | 2.3 | 0.4527 |
| succinyl CoA:3-oxoacid CoA transferase | 2.3 | 0.3305 |
| cell surface glycoprotein HT7 precursor | 2.3 | 0.2830 |
| ubiquitin-like protein SMT3A | 2.3 | 0.4100 |
| protein serine threonine kinase Clk4 | 2.3 | 0.4232 |
| cytosolic sulfotransferase | 2.3 | 0.3929 |
| spermatogenesis-preventing substance | 2.4 | 0.3869 |
| apolipoprotein Eb; apolipoprotein E | 2.4 | 0.1711 |
| gonadotropin-regulated long chain acyl-CoA synthetase | 2.4 | 0.4122 |
| GDP-mannose pyrophosphorylase B, isoform 2 | 2.4 | 0.4177 |
| ribosomal protein P2 | 2.4 | 0.2349 |
| acyl-coenzyme A dehydrogenase, C-4 to C-12 straight chain | 2.4 | 0.3715 |
| adenylate kinase 7 | 2.4 | 0.3979 |
| stathmin | 2.5 | 0.3786 |
| cytochrome P450 51 | 2.5 | 0.3985 |
| heat shock protein HSP 90-alpha (HSP 86) | 2.5 | 0.4709 |
| acyl-CoA oxidase type 1 | 2.5 | 0.3990 |
| ribophorin I | 2.5 | 0.3879 |
| matrix metalloproteinase 9 | 2.5 | 0.4384 |
| guanosine monophosphate reductase | 2.5 | 0.4486 |
| beta-ureidopropionase | 2.5 | 0.3735 |
| transposon-derived Buster1 transposase-like protein | 2.5 | 0.3560 |
| creatine kinase, testis isozyme | 2.6 | 0.2586 |
| lanosterol synthase (2,3-oxidosqualene-lanosterol cyclase) | 2.6 | 0.4240 |
| uridine-cytidine kinase 1 | 2.6 | 0.4133 |
| CPEB-associated factor Maskin | 2.6 | 0.3647 |
| eukaryotic translation elongation factor 2; polypeptidyl-tRNA translocase | 2.6 | 0.2497 |
| tubulin, alpha 3; tubulin alpha 3 | 2.6 | 0.2231 |
| glutathione reductase 1 | 2.7 | 0.3697 |
| zinc finger protein 151 (Zinc finger protein Z13) | 2.7 | 0.3620 |
| glucose-6-phosphate-1-dehydrogenase; G6PD | 2.7 | 0.3684 |
| glutamine synthetase | 2.7 | 0.3560 |
| alpha tubulin | 2.7 | 0.2810 |
| eukaryotic translation initiation factor 3, subunit 8 | 2.8 | 0.2724 |
| signal peptidase 25 kDA subunit | 2.8 | 0.2700 |
| tubulin beta-1 chain | 2.9 | 0.3540 |
| ependymin precursor (EPD) | 2.9 | 0.3219 |
| S100 calcium-binding protein, beta (neural) | 3.0 | 0.4088 |
| carboxypeptidase B | 3.0 | 0.3561 |
| axonemal dynein heavy chain 7 | 3.0 | 0.3940 |
| kainate receptor beta chain precursor | 3.0 | 0.3571 |
| fucosidase, alpha-L-1, tissue | 3.1 | 0.3476 |
| chloride intracellular channel 2 | 3.1 | 0.4201 |
| thyroid hormone receptor associated protein complex TRAP230/KIAA0192 | 3.2 | 0.2888 |
| angiotensinogen precursor | 3.3 | 0.2102 |
| UDP-glucuronic acid/UDP-N-acetylgalactosamine dual transporter | 3.4 | 0.3009 |
| androgen receptor 1 | 3.4 | 0.3362 |
| ubiquitin-conjugating enzyme E2D 2 | 3.5 | 0.2676 |
| cyclin A2 | 3.6 | 0.1748 |
| asparaginase and ankyrin repeat family member | 3.6 | 0.3353 |
| scavenger receptor cysteine-rich type 1 protein M160 | 3.8 | 0.3507 |
| ZP2 | 9.5 | 0.1554 |
| ZP3 | 11.1 | 0.1349 |
Commercial macroarray. Genes names are from GenBank (http://www.ncbi.nih.gov/GenBank) and the European Molecular Biology Laboratory of the European Bioinformatics Institute (EMBL-EBI; http://www.ebi.ac.uk/embl/).
Table 3.
Macroarray gene expressiona results male FHM exposed to MeHg-contaminated diets (3.93 ± 0.08 μg MeHg/g dry wt) versus control diets (0.058 ± 0.004 μg MeHg/g dry wt).
| Gene name | Fold change | p-Value |
|---|---|---|
| phosphoethanolamine methyltransferase | 0.2 | 0.0273 |
| transcription factor JUN-B | 0.3 | 0.3853 |
| fibronectin 1 | 0.3 | 0.1483 |
| polyunsaturated fatty acid elongase | 0.3 | 0.3617 |
| serine-pyruvate aminotransferase | 0.3 | 0.2567 |
| fatty acid synthase | 0.3 | 0.1857 |
| glucose-6-phosphatase | 0.4 | 0.0773 |
| intestinal fatty acid binding protein | 0.4 | 0.1941 |
| L-threonine 3-dehydrogenase | 0.4 | 0.3831 |
| annexin VI | 0.4 | 0.2342 |
| superoxide dismutase | 0.4 | 0.0870 |
| transferrin variant D | 0.4 | 0.2122 |
| ubiquitin specific protease 15 | 0.4 | 0.2228 |
| cytochrome P450 (2F2) | 0.4 | 0.1455 |
| 25-hydroxyvitamin D3 24-hydroxylase | 0.5 | 0.2357 |
| gonadotropin-regulated long chain acyl-CoA synthetase | 0.5 | 0.1703 |
| antithrombin | 0.5 | 0.1259 |
| lanosterol synthase | 0.5 | 0.5225 |
| bile salt export pump | 0.5 | 0.3028 |
| 3-hydroxy-3-methylglutaryl-Coenzyme A reductase | 0.5 | 0.3053 |
| cytochrome c oxidase subunit I | 0.5 | 0.2533 |
| 4-hydroxyphenylpyruvate dioxygenase | 1.9 | 0.0664 |
| alpha amylase | 1.9 | 0.0895 |
| zinc finger protein 151 (zinc finger protein Z13) | 2.0 | 0.2678 |
| pyruvate kinase | 2.0 | 0.3628 |
| hepatic glucose transporter GLUT2 | 2.0 | 0.2632 |
| retinol binding protein 4, plasma | 2.0 | 0.0159 |
| matrix metalloproteinase 9 | 2.2 | 0.2291 |
| ventricular myosin heavy chain | 2.3 | 0.2332 |
| biliverdin reductase B [flavin reductase (NADPH)] | 2.3 | 0.4626 |
| kinesin-like protein 2 | 2.4 | 0.3089 |
| tubulin beta-1 chain | 2.4 | 0.3005 |
| eukaryotic translation initiation factor 3, subunit 8 | 2.5 | 0.1936 |
| cyclin A2 | 2.5 | 0.2848 |
| homogentisate 1, 2-dioxygenase | 2.6 | 0.3151 |
| tubulin, alpha 3; tubulin alpha 3 | 2.8 | 0.1727 |
| zona pellucida 2 (ZP2) | 2.8 | 0.4347 |
| nucleoside phosphorylase | 2.9 | 0.1578 |
| protein serine threonine kinase Clk4 | 3.5 | 0.3601 |
| zona pellucida 3 (ZP3) | 14.7 | 0.3218 |
| vitellogenin precursor | 76.3 | 0.2971 |
| vitellogenin 1 | 142.8 | 0.3292 |
Commercial macroarray. Genes names from GenBank (http://www.ncbi.nih.gov/GenBank) and the European Molecular Biology Laboratory of the European Bioinformatics Institute (EMBL-EBI; http://www.ebi.ac.uk/embl/).
Gene expression differed by sex, and the effects of treatment on gene expression differed by sex. Vitellogenin mRNA, a phosphoglycolipoprotein associated with egg production and normally produced solely in female fish, increased an average 142.8-fold over controls in male fish. Macroarrays were spotted with multiples of this gene because it is of interest in endocrine disruption studies (circled in Figure 2B). Control male fish (Figure 2A) did not express vitellogenin RNA, although several treated males had large amounts of vitellogenin RNA (Figure 2B). This result was highly variable among treated males. In females, vitellogenin mRNA expression was down-regulated 0.6× on average in treated fish.
Figure 2.

EcoArray macroarray of 200 genes exposed to cDNA from (A) a single control male fish and (B) a fish exposed to a diet of 4 μg MeHg/g dry wt. Blue circles show location on the array where vitellogenin was spotted in duplicate in the shape of an “E.” Vitellogenin mRNA was expressed to a greater extent in the exposed fish (B) where the spots are clearly visible than in the control (A) where no spots are visible for vitellogenin.
Expression of RNA coding for zona pellucida proteins ZP2 and ZP3 also appeared to be up-regulated in individual male (2.8× and 14.7×, respectively) and female fish (9.5× and 11.1×, respectively), although the increase was statistically nonsignificant. Genes that were significantly down-regulated and statistically significant in males included phosphoethanolamine methyltransferase (0.2× change treated vs. control) and glucose 6-phosphatase (0.4×). In males, retinal binding protein 4 increased 2-fold (p = 0.0159) and 4-hydroxyphenylpyruvate dioxygenase and α-amylase were also up-regulated (1.9×), but the statistical significance was slightly > p = 0.05 (p = 0.0664 and p = 0.0895, respectively) (Table 3). Genes putatively up-regulated in females included glyceraldehyde 3-phosphate dehydrogenase (gapdh) (1.7×, p = 0.0263). Interestingly, gapdh is a common cellular component and is considered to be expressed constitutively; therefore it is often used as a gene for normalization of qPCR data. It was not used here because of its change with exposure.
qPCR analysis of differential gene expression
qPCR supported the results of macroarray experiments for vitellogenin, apolipoprotein, and nasp, with differences only in the scale of estimated up-regulation or down-regulation and the significance of the effect of treatment; macroarrays underestimated effects compared with qPCR results. MeHg-treated female fish showed significantly lower expression in vitellogenin RNA than in control fish (p = 0.004, χ2 = 10.835, df = 2; Figure 3). Both MeHg treatments down-regulated vitellogenin RNA production to almost the same magnitude. Using the macroarray, vitellogenin was down-regulated approximately 2-fold; however, qPCR estimated a 4-fold down-regulation in female fish. The significance of changes in female vitellogenin mRNA expression also increased with qPCR measurements either due to technique or to the inclusion of all of the individuals from the experiment (n = 10 vs. n = 4). From qPCR results, it appears that genes approaching 1.7× over controls may also be differentially regulated.
Figure 3.
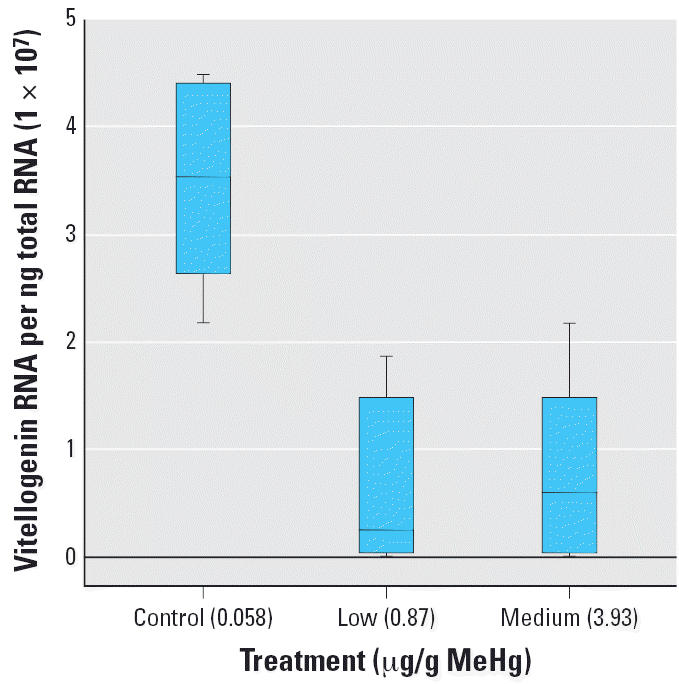
Box plot of molecules of vitellogenin RNA per nanogram of total RNA for female FHM treated with three different MeHg-contaminated diets at 5% body mass per day (10 fish per treatment); control, 0.058 ± 0.004 μg MeHg/g dry wt; low, 0.87 ± 0.02 μg MeHg/g dry wt; medium, 3.93 ± 0.08 μg MeHg/g dry wt. Data indicate suppressed vitellogenin RNA expression with increasing MeHg exposure (χ2 = 10.835, df = 2, p = 0.004). Boxes represent the interquartile range (first to third quartiles of data) with the middle lines indicating the median and bars indicating the range of data.
Dietary MeHg up-regulated expression of the vitellogenin gene in livers of several of the male fish in both MeHg treatments; none of the male fish fed control diets expressed the gene. However, there was significant variability in response in MeHg-fed males, with some of the treated fish showing no up-regulation and some with significant up-regulation (ranging from 0 to 200× over control males). This contributed to the overall average increase in expression and also to the lack of statistical significance (Table 4). This was similar to the findings of the macroarrays, where vitellogenin RNA was up-regulated 142× with variation among individuals leading to insignificant statistical measures across the group as a whole.
Table 4.
qPCR results for all FHM in all treatments measured as molecules per nanogram RNA for each gene product standardized to total RNA.
| Average female
|
Average male
|
||||
|---|---|---|---|---|---|
| Gene locus | Treatment | Molecules/ng (± SE) | Significance (χ2, df, p-value) | Molecules/ng (± SE) | Significance ((χ2, df, p-value) |
| vtg | Control | 4.0 × 10⁷ ± 4.8 × 10⁶ | (χ2 = 9.374, df = 2, | 6,756 ± 4,284 | (χ2 = 1.627, df = 2, |
| Low | 9.5 × 10⁶ ± 4.1 × 10⁶ | p = 0.009* | 22,443 ± 18,977 | p = 0.443 | |
| Medium | 8.2 × 10⁶ ± 2.8 × 10⁶ | 1.4 × 10⁶ ± 1.0 × 10⁶ | |||
| zp2 | Control | 2.8 × 10⁶ ± 1.4 × 10⁵ | (χ2 = 2.279, df = 2, | 3.0 × 10⁵ ± 74,376 | (χ2 = 2.920, df = 2, |
| Low | 9.2 × 10⁴ ± 3.0 × 10⁴ | p = 0.320 | 4.0 × 10⁵ ± 132,414 | p = 0.232 | |
| Medium | 1.4 × 10⁵ ± 3.7 × 10⁴ | 1.9 × 10⁵ ± 57,519 | |||
| apo | Control | 2.4 × 10⁵ ± 7.8 × 10⁵ | (χ2 = 8.861, df = 2, | 3.4 × 10⁶ ± 7.3 × 10⁵ | (χ2 = 0.608, df = 2, |
| Low | 5.2 × 10⁵ ± 1.1 × 10⁵ | p = 0.012* | 2.7 × 10⁶ ± 6.3 × 10⁵ | p = 0.997 | |
| Medium | 6.5 × 10⁵ ± 2.2 × 10⁵ | 3.0 × 10⁶ ± 9.4 × 10⁵ | |||
| nasp | Control | 527± 267 | (χ2 = 6.151, df = 2, | 540 ± 178 | (χ2 = 0.106, df = 2, |
| Low | 14,711 ± 9,459 | p = 0.046* | 3,079 ± 227 | p = 0.948 | |
| Medium | 21,351 ± 14,738 | 1,098 ± 494 | |||
Significant at p = 0.05
Dietary MeHg also altered expression of apolipoprotein in females, causing an increase in expression of approximately 4-fold in both treatments (χ2 = 8.861, df = 2, p = 0.012) and increased nasp by 20–40× (χ2 = 6.151, df = 2, p = 0.046). Zona pellucida expression, also commonly measured in association with endocrine disruption, did not appear to vary with exposure.
Discussion
In this study, we assessed gene expression in FHM fed diets with up to 4 μg MeHg/g dry wt—environmentally relevant concentrations that have been shown previously to suppress the production of sex hormones and alter reproduction in minnows (Drevnick and Sandheinrich 2003; Hammerschmidt et al. 2002). Many industrial chemicals have been linked to the disruption of endocrine function (Colborn et al. 1993), but research has focused primarily on compounds that are similar in structure to estrogens. It is possible that MeHg may act as an endocrine disruptor by binding to estrogen receptors and acting essentially as an estrogen mimic. Cadmium, cobalt, nickel, lead, and Hg have been shown to activate estrogen receptors and increase their production (Garcia-Morales et al. 2004; Henson and Chedrese 2004; Johnson et al. 2003; Martin et al. 2003; Stoica et al. 2000). However, there are notable differences between genes differentially expressed in this study and those identified in studies of other metals. Our data indicate that MeHg may have a different mode of action than other heavy metals, particularly at environmentally relevant exposure levels for MeHg. Studies have indicated that heavy metals may affect reproduction through interference with estrogen-responsive elements (Vetillard and Bailhache 2005) but invariably cause changes in ROS, which may also be the basis for changes in endocrine function with other Hg species and other heavy metals (Henson and Chedrese 2004; Martin et al. 2003). This is seen with cadmium, for example, which affects vitellogenin protein production but also induces sod and glutathione S-transferase (gst) (Olsson et al. 1995; Pereira et al. 1993; Sheader et al. 2006). We did not find significant genomic changes associated with ROS (e.g., changes in the expression of sod, gst) with MeHg exposure (these genes were on the macroarray) at these levels of MeHg. Instead, our array data indicated differential expression associated with apoptosis, phospholipid biosynthesis, sugar metabolism, interference with gonadotropin pathways, calcium regulation, phospholipid biosynthesis, and plasma transport of proteins. This may be a factor of dose, as Gonzalez et al. (2005) did find evidence of differential expression of ROS-related genes at much higher MeHg concentrations. Regardless, according to our data, there is a clear separation between the effects of oxidative stress and reproductive effects.
Differential gene expression in this study does overlap with gene expression patterns associated with known estrogenic compounds (e.g., Larkin et al. 2003), which lends support to the hypothesis of MeHg as a nonsteroidal endocrine disruptor. Of the genes that differed among treatments, vitellogenin is of particular interest due to the recommendation of assessment of vitellogenin in protocols for screening potential endocrine-disrupting chemicals (Endocrine Disruptor Screening and Testing Advisory Committee 1998; Marin and Motozzo 2004). This is due to its sensitivity as a biomarker and the correlation with adverse effects in male and female fish (e.g., Panter et al. 1998). Vitellogenin is a female-specific glucolipoprotein yolk precursor produced by all oviparous animals and is expressed specifically in the liver and transported to the gonad in females during egg development. It is up-regulated before yolk deposition and is important in egg production. Although not normally produced by male fish, its expression can be induced in males by injection of 17β-estradiol or exposure to chemicals that mimic estrogens (Byrne et al. 1989; Tong et al. 2004). When produced in males, vitellogenin is not readily removed from the bloodstream and can ultimately cause kidney and liver damage (Elliot et al. 1979; Herman and Kincaid 1988).
The presence of vitellogenin in some male fish in this experiment provides an indication that MeHg contamination may be causing an estrogenic-like effect; however, results for individual male fish were variable. Variable vitellogenin responses of males has also been found in other studies in which fish have been exposed to known endocrine-disrupting compounds in the field or laboratory (George et al. 2004; Sole et al. 2002). In each of these cases, of the total population sampled, up to 50% of fish express vitellogenin. Vitellogenin in males in the present study never reached the levels found in female fish.
In contrast, dietary MeHg significantly suppressed vitellogenin gene expression in sexually mature female fish (Figure 3), potentially affecting egg production. This is the first study to measure differences in the gene expression of vitellogenin and other genes associated with reproduction in response to environmentally realistic concentrations of MeHg. This was also associated with a decline in estrogen as well as a decline in reproduction (Drevnick and Sandheinrich 2003). In another study, Kirubagaran and Joy (1995) found that MeHg exposure decreased phospholipid content in ovarian tissue of fish and hypothesized that this is due to inhibition of vitellogenin synthesis in the liver. Vitellogenin gene expression declined in liver samples of fish exposed to MeHg, which supports this hypothesis.
Additional genomic biomarkers associated with endocrine disruption or reproduction that changed with MeHg exposure include genes responsible for proteins for egg fertilization and implantation (zp2 and zp3), cholesterol and lipid transport (apo), and cell division (nasp). Expression of apo and nasp was found to increase in females that had been exposed to MeHg.
Apoptosis, variance in sugar metabolism, and calcium regulation also appear linked to MeHg exposure in this study. The enzyme GAPDH is involved in glycolysis and is proposed to play an important role in apoptosis (Chuang et al. 2005). Hypoxia and diabetes increase the expression of this enzyme in various tissues (Beisswenger et al. 2003; Graven and Farber 1995; Wentzel et al. 2003), and it was up-regulated in female fish exposed to MeHg. This may indicate a link between changes in sugar metabolism and apoptosis in liver tissue after MeHg exposure. However, this change appeared to be female specific, potentially indicating sex-specific effects of MeHg on metabolism. Other genes associated with sugar metabolism included glucose 6-phosphatase, involved in the production of glucose, and α-amylase, an enzyme that converts starches to sugars. Genes for 4-hydroxyphenylpyruvate dioxygenase, α-amylase, and retinal binding protein were all up-regulated in male fish, whereas glucose 6-phosphatase was down-regulated with MeHg exposure. Because these genes are associated with sugar metabolism, insulin function, and diabetes in mammals, our data indicate that MeHg may disrupt these functions particularly in males, and there may be a link between MeHg exposure and certain metabolic diseases.
MeHg has been shown to affect bone cells, inducing hypercalcemia in goldfish and disrupting calcium homeostasis (Suzuki et al. 2004). Calcium levels in the blood are related to estrogen levels and affect the transport and metabolism of proteins. Because many of the differentially expressed genes identified in the macroarray analysis are associated with calcium, direct disruption of calcium transport or alteration in the levels of calcium may be responsible for some of these effects.
This study suggests that MeHg acts as an endocrine disruptor and affects not only gene expression associated with reproduction and endocrine function but other pathways as well. The genomic response to MeHg appears different than the response of vertebrates to other heavy metals. As more genomic data become available for other heavy metals and endocrine-disrupting compounds, continuation of this work to evaluate unique gene expression patterns will provide specific biomarkers that indicate the impact of MeHg versus that of other toxic compounds.
Footnotes
Supplemental Material is available online at http://www.ehponline.org/members/2006/8786/supplemental.pdf
We thank three anonymous reviewers that contributed suggestions to improve the manuscript.
This is paper 476 of the Great Lakes WATER Institute, University of Wisconsin–Milwaukee.
This research was supported by a pilot project grant from the National Institute of Environmental Health Sciences (NIEHS) Marine and Freshwater Biomedical Sciences Center (supported by NIEHS ES04184) at the University of Wisconsin–Milwaukee (R.K.), a grant from the Wisconsin Sea Grant College Program (M.S.), and a National Institutes of Health, Indian Health Service, Native American Research Centers for Health grant (M.J.C.).
Supplementary Material
References
- Armstrong FAJ. 1979. Effects of mercury compounds on fish. In: Biogeochemistry of Mercury in the Environment (Nriagu JO, ed). New York:Elsevier/North Holland Biomedical Press, 657–670.
- Arnold BS, Jagoe CH, Reinert R. 1998. Effects of methyl mercury on plasma estrogen and 11-keto testosterone in Nile tilapia (Oreochromis niloticus) [Abstract]. In: Abstracts of 19th Annual Meeting of the Society of Environmental Toxicology and Chemistry, 13–19 November 1998. Charlotte, NC. Pensacola, FL:SETAC Press, 145.
- Beisswenger PJ, Howell SK, Smith K, Szwergold BS. Glyceraldehyde-3-phosphate dehydrogenase activity as an independent modifier of methylglyoxal levels in diabetes. Biochim Biophys Acta. 2003;1637:98–106. doi: 10.1016/s09254439(02)00219-3. [DOI] [PubMed] [Google Scholar]
- Bjornberg KA, Vahter M, Grawe KP, Berglund M. Methylmercury exposure in Swedish women with high fish consumption. Sci Total Environ. 2005;341:45–52. doi: 10.1016/j.scitotenv.2004.09.033. [DOI] [PubMed] [Google Scholar]
- Bloom NS. On the chemical form of mercury in edible fish and marine invertebrate tissue. Can J Fish Aquat Sci. 1992;49:1010–1017. [Google Scholar]
- Byrne BM, Gruber M, Ab G. The evolution of egg yolk proteins. Prog Biophys Mol Biol. 1989;53:33–69. doi: 10.1016/0079-6107(89)90005-9. [DOI] [PubMed] [Google Scholar]
- Chuang DM, Hough C, Senatorov VV. Glyceradlehyde-3-phophate dehydrogenase, apoptosis, and neurodegenerative diseases. Annu Rev Pharmacol Toxicol. 2005;45:269–290. doi: 10.1146/annurev.pharmtox.45.120403.095902. [DOI] [PubMed] [Google Scholar]
- Colborn T, vom Saal FS, Soto AM. Developmental effects of endocrine disrupting chemicals in wildlife and humans. Environ Health Perspect. 1993;101:378–384. doi: 10.1289/ehp.93101378. [DOI] [PMC free article] [PubMed] [Google Scholar]
- Cole DC, Kearney J, Sanin LH, Leblanc A, Weber JP. Blood mercury levels among Ontario anglers and sport-fish eaters. Environ Res. 2004;95:305–314. doi: 10.1016/j.envres.2003.08.012. [DOI] [PubMed] [Google Scholar]
- Drevnick PE, Sandheinrich MB. Effects of dietary methylmercury on reproductive endocrinology of fathead minnows. Environ Sci Technol. 2003;37:4390–4396. doi: 10.1021/es034252m. [DOI] [PubMed] [Google Scholar]
- Elliot JAK, Bromage NR, Whitehead C. Effects of estradiol-17βon serum calcium and vitellogenin levels in rainbow trout. J Endocrinol. 1979;83:54–55. [PubMed] [Google Scholar]
- Endocrine Disruptor Screening and Testing Advisory Committee 1998. EDSTAC Final Report. Washington, DC:U.S. Environmental Protection Agency.
- Friedmann AS, Watzin MC, Brinck-Johnsen T, Leiter JC. Low levels of dietary methylmercury inhibit growth and gonadal development in juvenile walleye (Stizostedion vitreum) Aquat Toxicol. 1996;35:265–278. [Google Scholar]
- Fynn-Aikins K, Gallagher E, Ruessler S, Wiebe J, Gross TS. 1998. An evaluation of methyl mercury as an endocrine disruptor in largemouth bass [Abstract]. In: Abstracts of the 19th Annual Meeting of the Society of Environmental Toxicology and Chemistry, 13–19 November 1998, Charlotte, NC. Pensacola, FL:SETAC Press, 146.
- Garcia-Morales P, Saceda M, Kenney N, Kim N, Salomon DS, Gottardis MM, et al. Effect of cadmium on estrogen receptor levels and estrogen-induced responses in human breast cancer cells. J Biol Chem. 2004;269:16896–16901. [PubMed] [Google Scholar]
- George S, Gubbins M, MacIntosh A, Reynolds W, Sabine V, et al. A comparison of pollutant biomarker responses with transcriptional responses in European flounders (Platicthys flesus) subjected to estuarine pollution. Mar Environ Res. 2004;58:571–575. doi: 10.1016/j.marenvres.2004.03.047. [DOI] [PubMed] [Google Scholar]
- Gonzalez P, Dominique Y, Massabuau JC, Boudou A, Bourdinea JP, et al. Comparative effects of dietary methylmercury on gene expression in liver, skeletal muscle, and brain of the zebrafish (Danio rerio) Environ Sci Technol. 2005;39(11):3972–3980. doi: 10.1021/es0483490. [DOI] [PubMed] [Google Scholar]
- Graven KK, Farber HW. Hypoxia-associated proteins. New Horiz. 1995;3:208–218. [PubMed] [Google Scholar]
- Grieb TM, Driscoll CT, Gloss SP, Schofield CL, Bowie GL, Porcella DB. Factors affecting mercury accumulation in fish in the upper Michigan peninsula. Environ Toxicol Chem. 1990;9:919–930. [Google Scholar]
- Hammerschmidt CR, Sandheinrich MB, Wiener JG, Rada RG. Effects of dietary methylmercury on reproduction of fathead minnows. Environ Sci Technol. 2002;36:877–883. doi: 10.1021/es011120p. [DOI] [PubMed] [Google Scholar]
- Henson MC, Chedrese PJ. Endocrine disruption by cadmium, a common environmental toxicant with paradoxical effects on reproduction. Exp Biol Med. 2004;229:383–392. doi: 10.1177/153537020422900506. [DOI] [PubMed] [Google Scholar]
- Herman RL, Kincaid HL. Pathological effects of orally administered estradiol to rainbow trout. Aquaculture. 1988;72:165–172. [Google Scholar]
- Johnson MD, Kenney N, Stoica A, Hilakivi-Clarke L, Singh B, Chepko G, et al. Cadmium mimics the in vivo effects of estrogen in the uterus and mammary gland. Nat Med. 2003;9:1081–1084. doi: 10.1038/nm902. [DOI] [PubMed] [Google Scholar]
- Keating MH, Mahaffey KR, Schoeny R, Rice GE, Bullock OR, Ambrose RB. et al. 1997. Mercury Report to Congress. EPA-452/R-97-003. Washington, DC:U.S. Environmental Protection Agency.
- Kirubagaran R, Joy KP. Toxic effects of mercuric chloride, methylmercuric chloride, and Emisan 6 (an organic mercurial fungicide) on ovarian recrudescence in the catfish Clarias batrachus (L.) Bull Environ Contam Toxicol. 1988;41:902–909. doi: 10.1007/BF02021053. [DOI] [PubMed] [Google Scholar]
- Kirubagaran R, Joy KP. Toxic effects of mercury on testicular activity in the freshwater teleost, Clarias batrachus (L.) J Fish Biol. 1992;41:305–315. [Google Scholar]
- Kirubagaran R, Joy KP. Changes in lipid profiles and 32P uptake into phosphoprotein (vitellogenin) content of the ovary and liver in the female catfish, Clarias batrachus, exposed to mercury. Biomed Environ Sci. 1995;8:35–44. [PubMed] [Google Scholar]
- Klaper R, Thomas M. At the crossroads of genomics and ecology: the promise of a canary on a chip. BioScience. 2004;54:403–412. [Google Scholar]
- Landis MS, Keeler GJ. Atmospheric mercury deposition to Lake Michigan during the Lake Michigan Mass Balance Study. Environ Sci Technol. 2002;36:4518–4524. doi: 10.1021/es011217b. [DOI] [PubMed] [Google Scholar]
- Larkin P, Folmar LC, Hemmer MJ, Poston AJ, Denslow ND. Expression profiling of estrogenic compounds using a sheepshead minnow cDNA macroarray. Environ Health Perspect. 2003;111:29–36. [PubMed] [Google Scholar]
- Larkin P, Sabo-Attwood T, Kelso J, Denslow ND. Gene expression analysis of largemouth bass exposed to estradiol, nonylphenol, and p,p’-DDE. Comp Biochem Physiol B Biochem Mol Biol. 2002;133:543–557. doi: 10.1016/s1096-4959(02)00155-0. [DOI] [PubMed] [Google Scholar]
- Marin MG, Matozzo V. Vitellogenin induction as a biomarker of exposure to estrogenic compounds in aquatic environments. Mar Pollut Bull. 2004;48:835–839. doi: 10.1016/j.marpolbul.2004.02.037. [DOI] [PubMed] [Google Scholar]
- Martin MB, Reiter R, Pham T, Avellanet YR, Camara J, Lahm M, et al. Estrogen-like activity of metals in Mcf-7 breast cancer cells. Endocrinology. 2003;144(6):2425–2436. doi: 10.1210/en.2002-221054. [DOI] [PubMed] [Google Scholar]
- National Research Council 2000. Toxicological Effects of Mercury. Washington, DC:National Academy Press.
- Olsson P-E, Kling P, Petterson C, Silversand C. Interaction of cadmium and oestradiol-17βon metallothionein and vitellogenin synthesis in rainbow trout (Oncorhynchus mykiss) Biochem J. 1995;307:197–203. doi: 10.1042/bj3070197. [DOI] [PMC free article] [PubMed] [Google Scholar]
- Panter GH, Thompson RS, Sumpter JP. Adverse reproductive effects in male fathead minnows (Pimephales promelas) exposed to environmentally relevant concentrations of the natural oestrogens, oestradiol and oestrone. Aquatic Toxicol. 1998;40:335–360. [Google Scholar]
- Pereira JJ, Mercaldo-Allen R, Kuropat C, Luedke D, Sennefelder G. Effect of cadmium accumulation on serum vitellogenin levels and hepatosomatic and gonadosomatic indices of winter flounder (Pleuronectes americanus) Arch Environ Contam Toxicol. 1993;24:427–431. [Google Scholar]
- Rees CB, Li W. Development and application of a real-time quantitative PCR assay for determining CYP1A transcripts in three genera of salmonids. Aquat Toxicol. 2004;(66):357–368. doi: 10.1016/j.aquatox.2003.10.004. [DOI] [PubMed] [Google Scholar]
- Sheader DL, Williams TD, Lyons BP, Chipman JK. Oxidative stress response of European flounder (Platichthys flesus) to cadmium determined by a custom cDNA microarray. Mar Environ Res. 2006;62:33–44. doi: 10.1016/j.marenvres.2006.03.001. [DOI] [PubMed] [Google Scholar]
- Sole M, Barcelo D, Porte C. Seasonal variation of plasmatic and hepatic vitellogenin and EROD activity in carp, Cyprinus carpio, in relation to sewage treatment plants. Aquat Toxicol. 2002;60:233–248. doi: 10.1016/s0166-445x(02)00009-7. [DOI] [PubMed] [Google Scholar]
- Spry DJ, Wiener JG. Metal bioavailability and toxicity to fish in low-alkalinity lakes: a critical review. Environ Pollut. 1991;71:243–304. doi: 10.1016/0269-7491(91)90034-t. [DOI] [PubMed] [Google Scholar]
- Stoica A, Katzenellenbogen BS, Martin MB. Activation of estrogen receptor alpha by the heavy metal cadmium. Mol Endocrinol. 2000;14:545–553. doi: 10.1210/mend.14.4.0441. [DOI] [PubMed] [Google Scholar]
- Suzuki N, Yamamoto M, Watanabe K, Kambegawa A, Hattori A. Both mercury and cadmium directly influence calcium homeostasis resulting from the suppression of scale bone cells: the scale is a good model for the evaluation of heavy metals in bone metabolism. J Bone Miner Metab. 2004;22:439–446. doi: 10.1007/s00774-004-0505-3. [DOI] [PubMed] [Google Scholar]
- Tatusova TA, Madden TL. Blast 2 sequences—a new tool for comparing protein and nucleotide sequences. FEMS Microbiol Lett. 1999;174:247–250. doi: 10.1111/j.1574-6968.1999.tb13575.x. [DOI] [PubMed] [Google Scholar]
- Tong Y, Shan T, Poh YK, Yan T, Wang H, Lam SH, et al. Molecular cloning of zebrafish and medaka vitellogenin genes and comparison of their expression in response to 17β-estradiol. Gene. 2004;328:25–36. doi: 10.1016/j.gene.2003.12.001. [DOI] [PubMed] [Google Scholar]
- Vanden Heuvel JP. 1998. PCR Protocols in Molecular Toxicology. New York:CRC Press.
- Vetillard A, Bailhache T. Cadmium: An endocrine disrupter that affects gene expression in the liver and brain of juvenile rainbow trout. Biol Reprod. 2005;72:119–126. doi: 10.1095/biolreprod.104.029520. [DOI] [PubMed] [Google Scholar]
- Watras CJ, Bloom NS. Mercury and methylmercury in individual zooplankton: implications for bioaccumulation. Limnol Oceanogr. 1992;37:1313–1318. [Google Scholar]
- Wentzel P, Ejdesjo A, Eriksson UJ. Maternal diabetes in vivo and high glucose in vitro diminish GAPDH activity in rat embryos. Diabetes. 2003;52:1222–1228. doi: 10.2337/diabetes.52.5.1222. [DOI] [PubMed] [Google Scholar]
- Wester PW. Histopathological effects of environmental pollutants β-HCH and methylmercury on reproductive organs in freshwater fish. Comp Biochem Physiol. 1991;100C:237–239. doi: 10.1016/0742-8413(91)90160-u. [DOI] [PubMed] [Google Scholar]
- Wiener JGD, Krabbenhoft DP, Heinz GH, Scheuhammer AM. 2003. Ecotoxicology of mercury. In: Handbook of Ecotoxicology, Chapt 16. (Hoffman DJ, Rattner BA, Burton GA, Cairns J Jr, eds.). Boca Raton, FL:Lewis Publishers, 409–463.
- Zelikoff JT, Bertin JE, Burbacher TM, Hunter ES, Miller RK, Silbergeld EK, et al. Health risks associated with prenatal metal exposure. Fundam Appl Toxicol. 1995;25:161–70. doi: 10.1006/faat.1995.1052. [DOI] [PubMed] [Google Scholar]
Associated Data
This section collects any data citations, data availability statements, or supplementary materials included in this article.