

Abstract
Long-lasting increase in synaptic strength is thought to underlie learning. An explosion of data has characterized changes in postsynaptic (pstS) AMPA receptor cycling during potentiation. However, changes occurring within the presynaptic (prS) terminal remain largely unknown. We show that appearance of new release sites during potentiation between cultured hippocampal neurons is due to (a) conversion of nonrecycling sites to recycling sites, (b) formation of new releasing sites from areas containing diffuse staining for the prS marker Vesicle-Associated Membrane Protein-2 and (c) budding of new recycling sites from previously existing recycling sites. In addition, potentiation is accompanied by a release probability increase in pre-existing boutons depending upon their individual probability. These prS changes precede and regulate fluorescence increase for pstS GFP-tagged-AMPA-receptor subunit GluR1. These results suggest that potentiation involves early changes in the prS terminal including remodeling and release probability increase of pre-existing synapses.
Keywords: cultures, plasticity, synapse, terminal
Introduction
Studies on various hippocampal preparations such as slices, organotypic slices and dissociated cultures have shown evidences in favor of both presynaptic (prS) and postsynaptic (pstS) changes during synaptic plasticity (SP) (Malgaroli and Tsien, 1992; Arancio et al, 1995; Liao et al, 1995; Buchs and Muller, 1996; Ryan et al, 1996; Ma et al, 1999; Toni et al, 1999; Hayashi et al, 2000; Emptage et al, 2003; Humeau et al, 2003; Ninan and Arancio, 2004; Reid et al, 2004). PstS changes have been widely investigated and are thought to be linked to enhanced trafficking of receptors, spine development and pstS currents (Liao et al, 1995; Buchs and Muller, 1996; Toni et al, 1999; Hayashi et al, 2000; Matsuzaki et al, 2004). However, the type of changes occurring in the prS terminal leading to increased neurotransmitter release is not yet clear.
One of the suggested mechanisms for enhanced transmitter release during SP is recruitment of new release sites (Ma et al, 1999; Toni et al, 1999; Ninan and Arancio, 2004; Reid et al, 2004). However, no data are available on how these new release sites are formed. It has been shown that potentiation is accompanied by a long-lasting increase in cluster number of several prS proteins including synaptophysin (Syp), synapsin I (Syn) and α-synuclein (αSyn), suggesting that a series of coordinate changes occurs at prS level during plasticity (Antonova et al, 2001; Liu et al, 2004; Ninan and Arancio, 2004; Wang et al, 2005). Although it was hypothesized that these clusters correspond to redistribution of prS proteins around pre-existing silent (mute) synapses, it is not clear what these clusters represent in microstructural terms or how they originate. Furthermore, it is not known if there is a relationship between these new release sites and the pstS machinery.
Another cause of the long-lasting transmitter release increase is represented by a release probability increase at pre-existing prS boutons (btns). Limited number of studies on cultured hippocampal neurons suggested enhanced release turnover (Ryan et al, 1996) and readily releasable vesicle pool increase (Stevens and Sullivan, 1998). Earlier electrophysiological studies and statistical analysis suggested high variability in release probability among synapses (Hessler et al, 1993; Rosenmund et al, 1993; Allen and Stevens, 1994; Liu et al, 1999). However, the nature of changes at individual btns in the heterogeneous population of synaptic btns during SP is not clear. Moreover, these studies were inconsistent on whether low-probability or high-probability synapses undergo significant modulation during potentiation. Furthermore, it is not known whether and how such individual release properties affect the pstS machinery.
In the present study, we have used hippocampal neuronal cultures to investigate the nature of both new and pre-existing synapses before and after the tetanus by combining GFP-tagging of the prS marker Vesicle-Associated Membrane Protein (VAMP2-GFP) with staining of release sites using the activity-dependent marker FM4-64. We have found that new synapses arise from (a) conversion of nonrecycling sites, characterized by the presence of VAMP2-GFP puncta, to recycling sites, (b) formation of new releasing sites from areas containing a diffuse staining for VAMP2-GFP and (c) budding of new recycling sites from previously existing recycling sites. We have also found that pre-existing btns undergo increase in release probability during SP depending upon their initial individual release probability. These prS changes precede and regulate AMPA receptors at pstS sites.
Results
Tetanic stimulation of cultured hippocampal neurons (three tetani, 50 Hz, 2 s, 20 s interval, 0 Mg2+) modulates spontaneous excitatory pstS currents (sEPSCs), a mix of both miniature excitatory pstS currents (mEPSCs) and spontaneously occurring evoked currents. Tetanus caused an immediate and long-lasting increase of sEPSC frequency (180.2±13.6% at 60 min, n=8, F(1,9)=29.6, P<0.001, two-way analysis of variance (ANOVA) with repeated measures, Figure 1A, B and D) and amplitude (142.7±5.9% at 60 min, n=8, F(1,9)=23.4, P<0.001, Figure 1A, C and E). Interestingly, at ∼15–20 min we noticed a further increase in sEPSC frequency and curve fitting of the cumulative plotting by Graphpad software suggested at least two distinct phases in the sEPSC frequency increase after the tetanus. The N-methyl-D-aspartate (NMDA) receptor antagonist, D-AP5, blocked tetanus-induced potentiation of both sEPSC frequency (93.9±7.5%, n=5, F(2,13)=16.2, P<0.001, two-way ANOVA with repeated measures, Figure 1A, B and D) and amplitude (84.6±4.9%, n=5, F(2,13)=14.3, P<0.001, Figure 1A, C and E), confirming that tetanus-induced SP is NMDA-receptor dependent. Controls without tetanus showed a slight rundown of sEPSC frequency and amplitude presumably due to the whole-cell patch recording over a long duration (Arancio et al, 1995).
Figure 1.

Tetanus in 0 Mg2+ increases sEPSC frequency and amplitude in cultured hippocampal neurons. (A) Examples of sEPSCs before and after tetanus. D-AP5 blocked tetanus-induced increase in sEPCS frequency and amplitude. (B) Average changes in sEPSC frequency in control (n=3), tetanus (n=8) and D-AP5+tetanus (n=5) groups. D-AP5 reversed the tetanus effect on sEPSC frequency. *P<0.001 compared to control group. The mean frequency was 5.8±0.3, 8.9±0.5 and 5.5±0.6 Hz, for control, tetanus and D-AP5+tetanus groups, respectively. (C) Average changes in amplitude in control (n=3), tetanus (n=8) and D-AP5+tetanus (n=5) groups. sEPSC amplitude is increased after tetanus. D-AP5 reversed the tetanus effect on amplitude. *P<0.001 compared to control group. The mean amplitudes were 15.2±0.6, 22.1±0.9 and 15.1±0.2 pA for control, tetanus and D-AP5+tetanus groups, respectively. (D) Percentage change in sEPSC frequency after tetanus in control (n=3), tetanus (n=8) and D-AP5+tetanus (n=5) groups. Tetanus produced an immediate and long-lasting increase in sEPSC frequency. D-AP5 blocked tetanus-induced increase in sEPSC frequency (two-way ANOVA with repeated measures). (E) Percentage change in sEPSC amplitude after tetanus in control (n=3), tetanus (n=8) and D-AP5+tetanus (n=5) groups. Tetanus produced an immediate and long-lasting increase in sEPSC amplitude, which lasted for 60 min. D-AP5 blocked tetanus-induced increase in sEPSC amplitude (two-way ANOVA with repeated measures). Error bars indicate s.e.m. in this and the following graphs.
As previously shown with potentiation in cultures, long-lasting increase of sEPSC frequency and amplitude is dependent upon activation of the nitric oxide-cGMP-dependent protein kinase-calcium/calmodulin-dependent protein kinase II (NO-cGK-CaMKII) pathway (Ninan and Arancio, 2004). The NO-synthase inhibitor L-NMA (50 μM), a compound that blocks SP through a direct interaction and inhibition of NO-synthase (IC50=6 μM in isolated preparations; East and Garthwaite, 1991) blocked tetanus-induced increase in sEPSC frequency (97.3±10.7%, n=11, F(2,19)=24.6, P<0.001, two-way ANOVA with repeated measures; Supplementary Figure S1A and E) and amplitude (89.5±2.4%, n=11, F(2,19)=25.1, P<0.001; Supplementary Figure S1B and F). Similarly, KT5823, a specific cGK inhibitor (Ki=234 nM; Kase, 1988) that is also known to block SP suppressed tetanus-induced increase in sEPSC frequency (86.7±10.4%, n=5, F(2,12)=19.3, P<0.001, two-way ANOVA with repeated measures; Supplementary Figure S1A and E) and amplitude (85.6±5.9%, n=5, F(2,12)=17.5, P<0.001; Supplementary Figure S1B and F). Finally, KN-93, a membrane-permeable CaMKII inhibitor acting in a competitive fashion against calmodulin (inhibition constant of 0.37 μM, no significant effects on the catalytic activity of cAMP-dependent protein kinase, Ca2+/phospholipid-dependent protein kinase, myosin light chain kinase and Ca2+-phosphodiesterase; Sumi et al, 1991), blocked tetanus-induced increase in sEPSC frequency (84.5±5.8%, n=5, F(3,17)=13.7, P<0.001, two-way ANOVA with repeated measures; Supplementary Figure S1C and E) and amplitude (77.9±2.4%, n=5, F(2,12)=17.5, P<0.001, Supplementary Figure S1D and F). KN92, a KN-93 inactive analog, did not affect tetanus-induced increase in frequency (174.3±10.4%, n=5, Supplementary Figure S1C and E) or amplitude of sEPSCs (141.9±5.9%, n=5, Supplementary Figure S1D and F). As reported earlier (Ninan and Arancio, 2004), L-NMA, KT5823, KN-93 or KN-92 did not affect basal frequency and amplitude.
Tetani also increased number and fluorescence intensity of prS btns labeled with the cationic styrylpyridinium dye, FM4-64 (10 μM) (active btn number at 30 min: 191.9±14.7%, n=10, P<0.001, t-test, Figure 2A–D). There was no change in prS btn number (98.5±5.1%, n=8) in control nontetanized dishes (Figure 2D). Tetani also increased releasable fluorescence in pre-existing functional prS btns (209.2±11.7%; 216 btns; P<0.001, t-test, Figure 2A–C and E). There was no significant change in releasable fluorescence in control dishes (99.4±6.8%, 78 btns, Figure 2E). As the cumulative plot of sEPSC frequency suggested the possibility of two distinct SP phases, one immediately and the other one at approximately 15–20 min from the tetanus (Figure 1D), we examined if such phases could be detected in the vesicle cycling. Time-lapse imaging of FM4-64 btns before the tetanus and at 1, 15 and 30 min after it revealed an immediate (1 min) increase in number and fluorescence intensity of prS btns with no further changes at 15 and 30 min after the tetanus suggesting that the slight increase in sEPSC frequency observed at 15–20 after the tetanus is not due to changes in vesicle cycling (Supplementary Figure S2).
Figure 2.
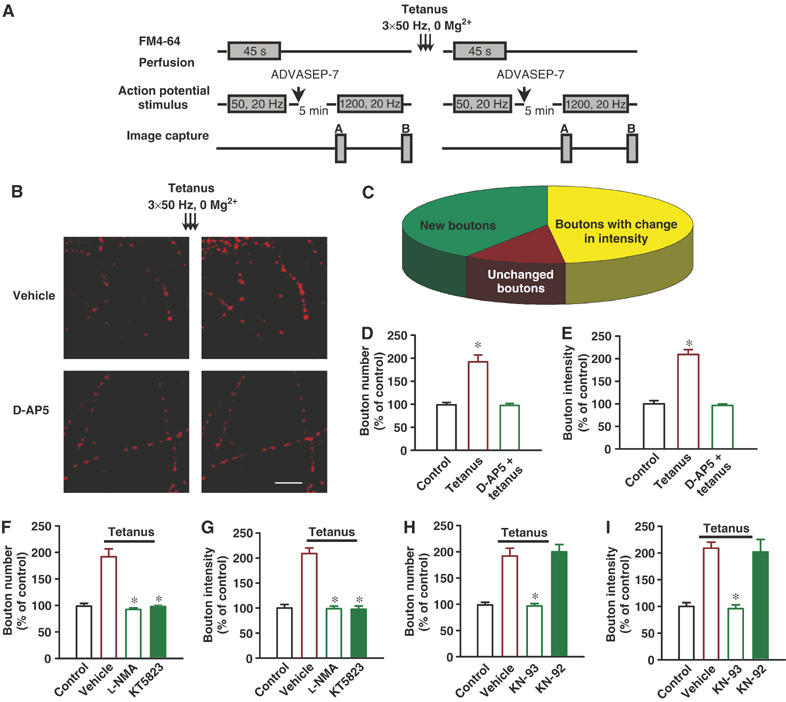
Tetanus in 0 Mg2+ increases functional prS btn number and releasable fluorescence in cultured hippocampal neurons. (A) Experimental protocol for staining, destaining and tetanus application using electrical stimulation. ADVASEP-7 (1 mM), an anionic cyclodextrin complexing agent with higher affinity for the dye than the plasma membrane was introduced in the washing bath solution for enhanced removal of the dye from the external medium to reduce background staining. (B) Examples of activity-dependent FM4-64 staining before and after tetanus. Tetanus in 0 Mg2+ increased prS btn number and releasable fluorescence intensity in pre-existing prS btns. D-AP5 (40 μM) blocked tetanus-induced plasticity. Scale bar 10 μm. (C) A pie chart representing percentage of new btns, btns that underwent changes in fluorescence intensity and unchanged btns, after tetanus (n=5). (D) Percentage increases in number of functional prS btns 30 min after tetanus. D-AP5 (40 μM) completely blocked tetanus-induced increase in recycling btn number (one-way ANOVA followed by LSD). *P<0.001 compared to control group. (E) Percentage increase in releasable fluorescence of pre-existing functional prS btns 30 min after tetanus. D-AP5 (40 μM) blocked tetanus-induced releasable fluorescence increase. *P<0.001 compared to control group. NO synthase inhibitor, L-NMA (50 μM) and cGK inhibitor, KT5823 (2 μM) blocked tetanus-induced increase in prS btn number (F) and releasable fluorescence (G) in pre-existing prS btns. CaMKII inhibitor, KN-93 (5 μM) but not its inactive analog, KN-92 (5 μM) blocked tetanus-induced increase in prS btn number (H) and releasable fluorescence (I) in pre-existing prS btns (one-way ANOVA followed by LSD). *P<0.001 compared to tetanus.
Tetanus-induced changes in the prS release apparatus were NMDA receptor-dependent. D-AP5 (40 μM) blocked increase in number (97.4±4.3%, n=9, F(2,24)=29.6, P<0.001, one-way ANOVA followed by LSD; Figure 2A, B and D) and releasable fluorescence (96.4±3.5%, 56 btns, F(2,348)=42.3, P<0.001; Figure 2A, B and E) of the prS btns. Tetanus increased only prS btn number but not releasable fluorescence in pre-existing functional synapses when staining was performed using high K+ solution instead of electrical stimulation confirming that detection of fluorescence intensity increase is not feasible under intense loading conditions (Ma et al, 1999; Ninan and Arancio, 2004) (Supplementary Figure S3).
Similar to long-lasting increase of sEPSC frequency and amplitude, tetanus-induced prS changes in functionally active btn number and releasable fluorescence involve the NO-cGK-CaMKII pathway. L-NMA (50 μM) or KT5823 (2 μM) blocked tetanus-induced increase in functionally active btn number (92.4±3.1%, n=12, F(2,27)=37.9, P<0.001, one-way ANOVA followed by LSD and 97.9±2.6%, n=10, F(2,25)=32.4, P<0.001; Figure 2F). Similarly, we observed complete blockade of tetanus-induced increase in releasable fluorescence by L-NMA or KT5823 (98.6±5.2%, n=69, F(2,361)=31.2, P<0.001, one-way ANOVA followed by LSD and 97.7±6.5%, n=71, F(2,363)=33.7, P<0.001; Figure 2G). KN-93 (5 μM), but not KN-92, blocked tetanus-induced increase in functional btn number (96.7±4.4%, n=10 and 199.9±13.7%, n=7, for KN-93 and KN-92 groups, respectively, F(3,31)=28.1, P<0.001, one-way ANOVA followed by LSD; Figure 2H) and releasable fluorescence (95.9±7%, n=77 and 202.4±23.2%, n=29, for KN-93 and KN-92 groups, respectively; F(3,397)=24.1, P<0.001, one-way ANOVA followed by LSD; Figure 2I). These findings confirm previous experiments showing an NO/cGK/CaMKII pathway-dependent increase in active btn number during SP (Ninan and Arancio, 2004). Most importantly, with the use of electrical stimulation, these experiments show the presence of NO/cGK/CaMKII-dependent increase in fluorescence of pre-existing active btns.
What is the origin of the new functional release sites? The increase in functional synapse number following tetanus suggests the occurrence of microstructural changes leading to the formation of a mature release apparatus. To provide proof in favor of such changes, we transfected cultured hippocampal neurons with plasmid for the prS marker VAMP2 labeled with GFP. VAMP2-GFP fusion protein incorporates into synaptic vesicles. As reported earlier (Ahmari et al, 2000; Sampo et al, 2003), most of VAMP2-GFP fluorescence appeared punctate (Figure 3A and B) along the axon in 10-day-old cultures. The remaining fluorescence appeared relatively diffuse (Figure 3A and C). Consistent with these studies, soma and dendrites showed lighter and diffused fluorescence. The size of VAMP2-GFP puncta was between 0.5 and –1.5 μm. When we examined recycling characteristics of VAMP2-GFP puncta by loading with FM4-64, we found that only 59.5±2.5% (22 dishes) of VAMP2-GFP puncta were functionally active btns (as shown by the conversion of green VAMP2-GFP puncta to yellow puncta after FM staining). Comparison of VAMP2-GFP-expressing neurites with control GFP-expressing neurites revealed no significant difference in functional btn number between VAMP2-GFP-transfected neurites and control neurites (4.3±0.4 btns/30 μm, n=28 and 4.4±0.6 btns/30 μm, n=31, respectively). Similarly, there was no significant difference in btn intensity at VAMP2-GFP-transfected and control neurites (37.8±2.7 arbitary units (au), n=51 and 37.5±2.9 au, n=59, respectively). Tetanus increased the number of VAM2-GFP puncta colocalized with recycling btns (99.2±6% of total VAMP2-GFP puncta, n=15), producing a 187.8±4.7% increase in recycling VAMP2-GFP puncta number (compare yellow puncta before and after tetanus in Figure 3D). This increase was due to (a) green puncta that were not FM stained by the first staining performed before the tetanus but were stained (appeared yellow) by the second staining performed after the tetanus (Figure 3E and H), (b) fusion of diffused VAMP2-GFP with no FM staining before the tetanus to become a recycling btn (appeared yellow after the tetanus) (Figure 3F and H) and (c) budding of new recycling btns from pre-existing recycling btns (Figure 3G and H). Although most of the nonrecycling green puncta that underwent conversion into recycling puncta following tetanus did not show a change in fluorescence, a minor number of these converted puncta showed a VAMP2-GFP staining intensity increase associated with a decrease in diffused GFP intensity at either sides of the btn suggesting mobilization of VAMP2 to synaptic sites from nonsynaptic sites. We also examined total area and average intensity of green fluorescence per 30 μm of transfected axons. There was no significant difference in either total area (57.4±14.6 and 53.4±12.2 pixel2, respectively, n=7) or average intensity (34.8±3.7 au, n=7 and 42.9±4 au, n=6, respectively) of green fluorescence before and after tetanus. However, adjusting the threshold to exclude low fluorescence intensity areas showed 23.6% decrease in total area of green fluorescence after tetanus suggesting mobilization of VAMP2 to synaptic sites. We also tested whether inhibitors of NO synthase, cGK or CaMKII could block tetanus-induced increase in number of FM4-64 positive and therefore recycling VAMP2-GFP puncta. Increase in FM4-64-positive VAMP2-GFP puncta number was blocked by L-NMA (4.8±0.3 and 5±0.4/30 μm, respectively before and after tetanus, n=12), KT5823 (4.7±0.4 and 4.5±0.5/30 μm, respectively before and after tetanus, n=11) and KN-93 (4.7±0.4 and 4.8±0.3/30 μm, respectively before and after tetanus, n=8; Figure 3I).
Figure 3.

Tetanus induces prS remodeling in cultured hippocampal neurons to enhance transmitter release. (A) Example of an axon expressing VAMP2-GFP fusion protein. Scale bar 10 μm. (B, C) Examples of punctated (B) and diffused (C) fluorescence from the axon expressing VAMP2-GFP fusion protein shown in (A). Scale bar 2 μm. (D) Examples of activity-dependent staining of FM4-64 before and after tetanus in cultures transfected with VAMP2-GFP. Tetanus increased number of yellow puncta (FM4-64 staining in VAMP2-GFP expressing axon) as well as red puncta (FM4-64 staining in nontransfected axons). Tetanus also increased releasable fluorescence in btns from both transfected and nontransfected axons. D-AP5 (40 μM) blocked tetanus-induced increase in btn number and releasable fluorescence (one-way ANOVA followed by LSD). Scale bar 10 μm. (E) Insets show a VAMP2-GFP punctum that becomes recycling after tetanus. Scale bar 1 μm. (F) An example of fusion of diffused VAMP2-GFP to become a recycling btn. The dashed line shows the diffused fluorescence. The arrow shows the new btn. Scale bar 1 μm. (G) An example of budding of new VAMP2-GFP btns from a pre-existing VAMP2-GFP btn. The yellow arrow shows the original btn whereas the white arrow shows the new btns. Scale bar 1 μm. (H) A pie chart representing percentage contribution of (1) conversion of nonrecycling pre-existing btns to recycling btns (74%), (2) fusion of nonsynaptic VAMP2-GFP (14.3%) and (3) budding from pre-existing recycling btns (11.7%) in tetanus-induced increase in VAMP2-GFP recycling btn number calculated from 15 samples. (I) Number of FM4-64 stained btns per 30 μm of VAMP2-GFP expressing axons in control (8), tetanus (15), L-NMA paired with tetanus (12), KT5823 paired with tetanus (11), KN-93 paired with tetanus (8) and KN-92 paired with tetanus (8) groups before (filled bar) and 30 min after (empty bar) the tetanus. The empty bar in the control group represents parallel measurement of number of FM4-64 positive VAMP2-GFP puncta at 30 min without tetanus. L-NMA, KT5823, KN-93 but not KN-92 blocked tetanus-induced increase in FM4-64 recycling btn number. In L-NMA, KT5823, KN-93 but not KN-92 groups, we neither observed fusion of nonsynaptic VAMP2-GFP nor budding from recycling VAMP2-GFP btns. *P<0.001 compared to pretetanus value.
Earlier studies have demonstrated a prS btn number increase after cAMP signaling activation in cultured hippocampal neurons (Ma et al, 1999). In preliminary studies, we found that elevating cAMP levels by perfusion of forskolin or IBMX produces similar results as our tetanus (Supplementary Results and Supplementary Figure S4). The occlusion of the effect of forskolin and IBMX on btn number and fluorescence intensity by tetanus suggests that these two SP processes share similar mechanisms (Supplementary Results and Supplementary Figure S4).
Earlier studies have suggested an inverse relationship between the initial release probability of a synapse and its ability to undergo plasticity changes (Hessler et al, 1993; Bi and Poo, 1998). However, technical difficulties prevented a direct analysis of release probability at the level of individual btns. As we found high variability of releasable fluorescence among individual prS btns when stained with 50 action potentials (Ninan et al, 2005) at 20 Hz corresponding to btns with different release probabilities, we wanted to examine whether initial release probability determines ability of individual prS btns to undergo potentiation. Calculation of releasable fluorescence of a single vesicle was based on the assumption that a single action potential causes release of one vesicle (Supplementary data). Synaptic vesicles were stained by perfusing FM4-64 (10 μM) for 10 s and eliciting one action potential. Releasable fluorescence of a single vesicle was calculated after destaining with 1200 action potentials at 20 Hz (Figure 4A and B). As described, probability of individual synapses was calculated by using the formula Pr=releasable fluorescence of a btn/number of action potentials × releasable fluorescence of a single vesicle (Slutsky et al, 2004). Measurement of release probabilities of 216 active btns (n=5 dishes) showed three categories of btns based on their initial probabilities: low (Pr=0.01–0.0999, n=114), medium (Pr=0.1–0.1999, n=70) and high-probability btns (Pr>0.2000, n=32) (Supplementary Figure S5A, B and C). Tetanus increased Pr values for the low (median 0.0727 and 0.1846 before and after tetanus) and medium (median 0.1451 and 0.1811 before and after tetanus)-probability populations (P<0.001, Wilcoxon's matched pairs test; Supplementary Figure S5C). The high-probability population did not undergo any significant change (median 0.2129 and 0.1892 before and after tetanus) in release probability. These results are consistent with the notion of an inverse relationship between initial release probability of a synapse and its ability to undergo SP changes (Hessler et al, 1993; Bi and Poo, 1998). Most importantly, they extend findings from synapses made of a population of heterogeneous btns to the level of individual btns. Thus, the present study suggests that tetanus increases number of vesicles available for release and thereby enhances release. Interestingly, we have observed that post-tetanus Pr values are identical in all the three populations suggesting a ceiling effect on number of vesicles available for release under our experimental conditions. L-NMA (post-tetanic median values 0.0717 and 0.1286, respectively, for low and medium-probability btns), KT5823 (post-tetanic median values 0.0786 and 0.1458, respectively, for low and medium-probability btns) and KN-93 (post-tetanic median values 0.0712 and 0.1522, respectively, for low and medium-probability btns) blocked tetanus-induced increase of release probability in low and medium-probability btns (Supplementary Figure S5D–F and G).
Figure 4.
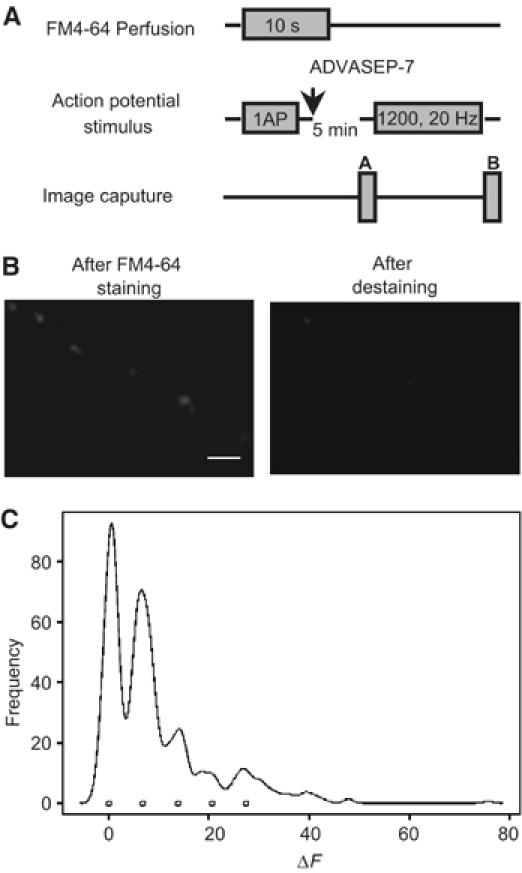
(A) Experimental protocol for the estimation of single vesicle fluorescence. Synaptic vesicles were loaded with FM4-64 by perfusing the neurons with bath solution containing FM4-64 for 10 s, and eliciting 1 action potential. (B) Examples of activity-dependent FM4-64 staining before and after destaining. Scale bar 5 μm. (C) A histogram of intensities of 546 active btns stained with 1 action potential. The first peak corresponds to btns showing nonspecific staining whereas the second peak represents btns that released one vesicle.
Previous studies have shown that SP is associated with pstS changes such as increase in AMPA receptors GluR1 subunit at synaptic sites (Shi et al, 1999; Lu et al, 2001; Pickard et al, 2001). Thus, we examined whether there was a relationship between prS and pstS changes at individual synapses. To follow pstS changes, neurons were transfected with GluR1-GFP plasmid. Similar to a previous study (Shi et al, 1999), the recombinant protein was distributed throughout the dendrite and the soma with a punctated pattern (Figure 5A). In the same study, GluR1 protein was colocalized with endogenous GluR2 and Syn, and homomeric recombinant receptors were functionally delivered to the surface. We found relatively more intense GluR1-GFP puncta at locations apposed to active prS btns that were stained with FM4-64. We did not see any difference in number or intensity of FM4-64 btns apposing the dendrites of GluR1-GFP-expressing cells compared to nonexpressing cells. Next, we examined whether tetanus affected fluorescence intensity of GluR1-GFP puncta at releasing sites. Time-lapse imaging revealed a GluR1-GFP intensity increase at releasing sites (135.3±10.5%, n=30, P<0.01, t-test) 10 min after the tetanus whereas there was no GluR1-GFP intensity increase at 1 (98.3±9.9%, n=30) or 5 min (99.6±8.5%, n=26; Figure 5B and C). This finding is consistent with experiments in organotypic cultures demonstrating insertion of the GluR1 subunit at 15–20 min after tetanus (Shi et al, 1999). Similar to the studies shown in Supplementary Figure S5, we found three release probability kinds of prS btns: low, medium and high probability. Fluorescence measurements of GluR1 puncta opposite to prS btns revealed an interesting relationship between release probability and changes in GluR1-GFP fluorescence. Release probability increase at low (median 0.0785 and 0.1599 before and after tetanus) and medium (median 0.1221 and 0.1846 before and after tetanus)-probability sites was associated with a GluR1-GFP fluorescence intensity increase at 30 min after the tetanus (141.5±12.9%, n=49, and 142.9±13.2%, n=34, respectively, P<0.05, t-test, Figure 5D). However, GluR1-GFP fluorescence at sites opposite to high-probability sites (median 0.2151 and 0.2180 before and after tetanus) did not change after tetanus (103.9±7.4%, n=23; Figure 5D). These results suggest an increase in GluR1-GFP fluorescence intensity at synaptic sites dependent upon release probability increase. Furthermore, analyses of the average basal fluorescence intensity for GluR1-GFP revealed lower fluorescence (54.4±6.7 au, n=23) at sites opposite to high-probability release sites compared to sites opposite to low-probability sites (69.4±5.5 au, n=49) and sites opposite to medium-probability sites (68.4±7.3 au, n=34) suggesting a possible compensatory decrease in GluR1 expression at high-probability sites.
Figure 5.
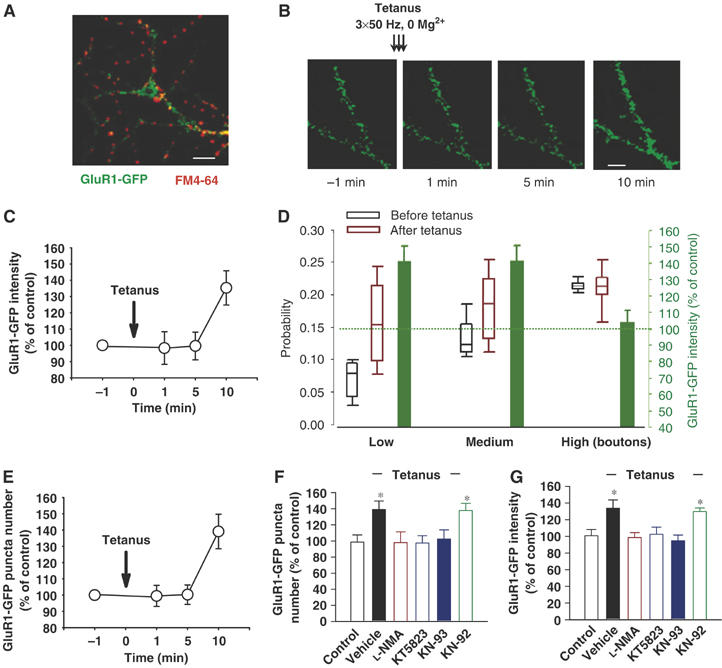
Tetanus produces a delayed increase in GluR1-GFP fluorescence intensity and puncta number in cultured hippocampal neurons. (A) Example of a GluR1-GFP fusion protein expressing culture stained with FM4-64. GluR1-GFP was distributed both in soma and dendrites. FM4-64 staining demonstrated relatively more intense GluR1-GFP fluorescence opposed to prS btns. Scale bar 10 μm. (B) Examples of GluR1-GFP-expressing dendrites at 1 min before the tetanus and 1, 5 and 10 min after it. A clear increase of GluR1-GFP fluorescence intensity and puncta number was visible at 10 min but not at 1 or 5 min after the tetanus. Scale bar 3 μm. (C) Time course of the percentage increase in GluR1-GFP fluorescence intensity before and after tetanus. (D) Tetanus-induced increase in release probability affects GluR1-GFP fluorescence at individual synapses. Probability increase at low (n=49) and medium (n=34)-probability sites was associated with a GluR1-GFP fluorescence increase (P<0.05, t-test). However, pstS sites opposite to high-probability sites (n=23) did not undergo any change in GluR1-GFP fluorescence after tetanus. Error bars above and below the empty box indicate the 90th and 10th percentiles whereas the error bars on the green box indicate s.e.m. (E) Time course of the percentage increase in GluR1-GFP puncta number before and after tetanus. (F) Percentage changes in GluR1-GFP puncta number in control (n=5), tetanus (n=8), L-NMA paired with tetanus (n=4), KT5823 paired with tetanus (n=4), KN-93 paired with tetanus (n=5) and KN-92 paired with tetanus (n=3) groups. L-NMA, KT5823 and KN-93 but not KN-92 reversed the tetanus effect on GluR1-GFP puncta number. *P<0.05 compared to control group. (G) Percentage changes in fluorescence intensity of GluR1-GFP puncta in control (n=41), tetanus (n=106), L-NMA paired with tetanus (n=43), KT5823 paired with tetanus (n=36), KN-93 paired with tetanus (n=37) and KN-92 paired with tetanus (n=23) groups. L-NMA, KT5823 and KN-93 but not KN-92 reversed the effect of tetanus on GluR1-GFP puncta fluorescence intensity. *P<0.05 compared to control.
Next, we studied if conversion of mute synapses affected pstS GluR1 fluorescence. We analyzed GluR1 fluorescence opposite to the newly converted btns (n=26) by retrospectively measuring GluR1 fluorescence at sites that were not stained with FM4-64 before the tetanus. We found 138.4±11.4% increase (P<0.01, t-test) in GluR1 intensity at sites opposite to the newly converted btns 10 min after the tetanus. Consistent with the earlier reports that glutamate increased GluR1 immunoreactive puncta number (Antonova et al, 2001), we found a GluR1-GFP puncta number increase 10 min after tetanus but not at 1 or 5 min (10 min: 139.1±10.6%, n=8, P<0.05, t-test; 1 min: 99.5±6.5%, n=8; 5 min: 100.3±5.7%, n=8; Figure 5E). Similar to tetanus-induced changes in prS btns, L-NMA, KT5823 or KN-93 completely blocked tetanus-induced increase in GluR1-GFP puncta number (98±13.3%, n=4; 97.5±9.1%, n=4; 102.4±11.4%, n=5; Figure 5F) and fluorescence at synaptic sites (98.5±5.9%, n=43, 102.5±8.5%, n=36 and 94.8±6.8%, n=37, respectively; Figure 5G). Thus, these findings strongly support the hypothesis that tetanus-induced prS changes in cultured hippocampal neurons precede and regulate postysynaptic changes at the level of the GluR1 subunit.
We finally determined whether probability conditions influence tetanus-induced SP in cultured hippocampal neurons both at the prS and pstS level. Ca2+/Mg2+ ratio increase from 2:2 to 3.5:0.5 (Figure 6A) increased release probability in both low (median 0.0698 and 0.1802 before and after changing calcium/magnesium ratio, n=47) and medium (median 0.1308 and 0.2093 before and after changing Ca2+/Mg2+ ratio, n=35)-probability btns (Figure 6B and C), augmented prS btn number (172.9±14%, n=8, P<0.05) (Figure 6B and D), and increased GluR1-GFP fluorescence apposed to low and medium-probability btns (140.8±6.9%, n=47 and 143.7±7.8%, n=35, respectively, P<0.01; Figure 6B and C). Furthermore, release probability increase enhanced GluR1-GFP puncta number (131.6±6.6%, n=5, P<0.05, t-test, Figure 6B and E). High-probability btns did not show any further increase (median 0.2180 and 0.2209 before and after changing Ca2+/Mg2+ ratio, n=19) in release probability (Figure 6C). Similarly, there was no increase in GluR1-GFP fluorescence apposed to high-probability btns (109.7±7.3%, n=19). Next, we applied tetanus to determine whether it is possible to induce potentiation under high-probability conditions. There was no further release probability increase in prS btns (median 0.1773, 0.2064 and 0.2180, respectively, for btns that were classified as low, medium and high probability before changing the Ca2+/Mg2+ ratio; Figure 6B and C), btn number (170.3±17.1%, n=8, Figure 6B and D) or GluR1-GFP fluorescence (141±6.5%, n=47 and 145.4±7.2%, n=35 and 104.9±7.2%, n=19, respectively, for low, medium and high-probability release btns; Figure 6B and C). Similarly, tetanus did not further increase GluR1-GFP puncta number (133.4±6.8%, n=5; Figure 6B and E) under high-probability conditions. These results suggest that high-probability conditions occlude tetanus-induced SP in cultured hippocampal neurons and further confirm that transmitter release at single synapses regulates the extend of pstS activation.
Figure 6.
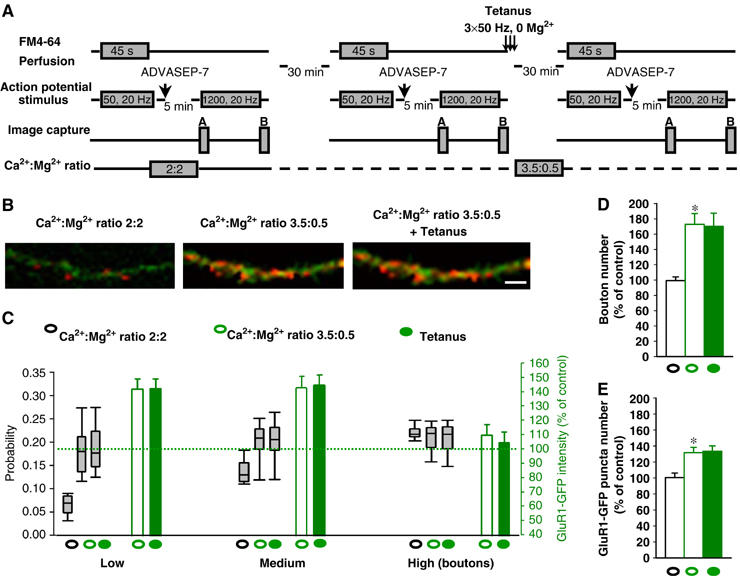
Release probability increase enhances GluR1-GFP fluorescence and puncta number in cultured hippocampal neurons and occludes tetanus-induced plasticity. (A) Experimental protocol under different Ca2+/Mg2+ ratio conditions. (B) Examples of FM4-64 staining in GluR1-GFP-expressing neurites under normal Ca2+/Mg2+ ratio (2:2), high Ca2+/Mg2+ ratio (3.5:0.5) and after the tetanus in high Ca2+/Mg2+ ratio (3.5:0.5). Scale bar 3 μm. (C) Increase in Ca2+/Mg2+ ratio enhanced release probability in both low (n=47) and medium (n=35)-probability btns and GluR1-GFP fluorescence apposed to low and medium-probability btns. High-probability btns did not show any increase in release probability. Similarly, there was no increase in GluR1-GFP fluorescence apposed to high-probability btns. There was no further increase of probability in prS btns or GluR1-GFP fluorescence when the same cultures bathed in high-probability release solution received a tetanus. Error bars above and below the grey empty box indicate the 90th and 10th percentiles whereas the error bars on both empty and filled green boxes indicate s.e.m. (D) Ca2+/Mg2+ ratio increase resulted in potentiation of prS btn number with no further increase in btn number when the same cultures bathed in high-probability release solution received a tetanus in 0 Mg2+. *P<0.001 compared to control group. (E) Ca2+/Mg2+ ratio increase resulted in potentiation of GluR1-GFP puncta number with no further increase in GluR1-GFP puncta number when the same cultures bathed in high-probability release solution received a tetanus in 0 Mg2+. *P<0.05 compared to control group.
Discussion
Our results demonstrate that potentiation in cultured hippocampal neurons is accompanied by a transmitter release increase through appearance of new prS release sites and release probability increase at pre-existing functional synapses in an NMDA receptor-dependent manner. These findings are in agreement with previous reports showing that glutamate increases functional prS release site number (Ninan and Arancio, 2004). However, in the same study, glutamate did not affect releasable fluorescence intensity in pre-existing prS btns, probably because of maximum staining evoked by the high K+ loading solution used in that experimental paradigm (Ma et al, 1999; Ninan and Arancio, 2004). In the present study to avoid maximum staining, we have used a different staining protocol in which electrical stimulation has been shown to selectively empty only readily releasable vesicle pool (Rosenmund and Stevens, 1996; Dobrunz and Stevens, 1997; Murthy and Stevens, 1998). Our results also agree with earlier reports showing an enhanced transmitter turnover using a different tetanus protocol (50 Hz, 30 s) (Ryan et al, 1996). However, this protocol failed to increase btn number in the presence of Mg2+. It is plausible that removal of NMDA receptor blockade by 0 Mg2+ solution during the tetanus in our experiments might activate conversion of mute synapses (Antonova et al, 2001; Ninan and Arancio, 2004). Thus, with our new experimental conditions, we have been able to provide a comprehensive analysis of the kinds of changes occurring during SP at synaptic btns.
Previous studies showed increase in functional prS btn number immediately after SP induction (Ninan and Arancio, 2004). However, these studies did not follow the behavior of these new sites over time and thus, did not include a retrospective analysis of their behavior before SP. Increase in cluster number for prS proteins Syp, Syn and αSyn was documented during potentiation (Antonova et al, 2001; Liu et al, 2004). However, it was not clear what these clusters represent in microstructural terms or how they originate. By transfection of cultured hippocampal neurons with VAMP2-GFP and subsequent FM staining, we have been able to show that these new functional release sites are either at their nascent state before the tetanus or formed from prS rearrangement to become releasing sites after the tetanus. The former are very similar to mature sites except that they have zero release probability. The latter are immature release sites and need release apparatus rearrangement, including (i) fusion of diffuse staining for VAMP2-GFP to become functionally active release sites and (ii) budding of new release sites from already existing functional release sites. These findings are consistent with the clustering of previously synthesized prS proteins Syn, Syp and αSyn, as well as pstS GluR1 during plasticity (Carroll et al, 1999; Lissin et al, 1999; Shi et al, 1999; Antonova et al, 2001; Liu et al, 2004; Wang et al, 2005). Interestingly, the percentage increase in ‘budding' in prS btns following tetanus was similar to the perforated synapse number increase during SP reported in other studies following induction of plasticity (Neuhoff et al, 1999; Toni et al, 2001; Stewart et al, 2005).
An earlier study on VAMP2-GFP-expressing hippocampal cells showed that vesicular packets containing cytoplasmic and membrane-associated protein precursors for synaptic vesicles are transported along axons and get stabilized at synaptic sites (Ahmari et al, 2000). Thus, our results suggest that tetanus accelerates mobilization of prS vesicular precursors to enhance transmitter release.
Consistent with the notion that release probability is nonuniform among synapses (Hessler et al, 1993; Rosenmund et al, 1993; Allen and Stevens, 1994; Liu et al, 1999), our study show a population of FM4-64 puncta with highly variable releasable fluorescence. There were inconsistent reports on whether low or high-probability synapses undergo significant modulation during potentiation (Hessler et al, 1993; Rosenmund et al, 1993; Bi and Poo, 1998). Thus, we classified the prS btns into low, medium and high-probability sites based on their initial release probability and then studied them individually. Tetanus potentiated release probability in low and medium-probability sites but not in high-probability sites. These results are consistent with the notion that SP at individual synapses is inversely related to the initial release probability at those synapses. In other words, our results suggest that low-probability sites offer a greater window for potentiation than high-probability sites. This finding agrees with a previous study on LTP in the CA1 pyramidal neurons showing a release probability increase only at synapses with low baseline probability (Palmer et al, 2004). Interestingly, the maximum release probability after tetanus in low and medium-probability btns was similar to the probability at high-probability btns, which did not undergo any significant probability increase after tetanus. This suggests that under our experimental conditions, there is a ceiling effect on the maximum release probability, which suggests that there is no increase in available pool of vesicles but enhanced transmitter turnover in the available pool of vesicles after the tetanus (Ryan et al, 1996).
Consistent with the results from FM4-64 staining studies, tetanus produced an immediate and long-lasting increase in sEPSC frequency and amplitude in an NMDA receptor-dependent fashion. As there is no change in GluR1-GFP fluorescence at synaptic sites immediately after tetanus, possible reasons for the immediate sEPSC amplitude increase might be either prS (Choi et al, 2000; Renger et al, 2001) or an increase in AMPA receptor conductance (Benke et al, 1998; Palmer et al, 2004). A possible relationship between prS modulation and the increased sEPSC amplitude depends on quanta released number and quantal size. Release site number as well as release probability influence the number of quanta released and tetanus increased both release site number and probability in pre-existing synapses strongly supporting the hypothesis that EPSC amplitude increase is due to prS modulation. However, it is not possible to exclude that pstS changes such as increased AMPA receptor conductance or changes in the AMPA receptor subunit distribution between the intracellular- and the surface-compartment (our technique does not distinguish between the two compartments) contribute to immediate sEPSC amplitude increase. The late AMPA receptor mobilization to synaptic sites as seen in our experiments and on tetanized organotypic slice experiments (Shi et al, 1999) might contribute to the maintenance of SP. Interestingly, we found two distinct phases during sEPSC frequency increase after the tetanus suggesting that two distinct mechanisms underlie SP. Given that the FM studies revealed no further changes in the increase in btn number and release probability after the initial changes, we infer that the observed biphasic increase in sEPSC frequency after the tetanus is not due to prS changes. Thus, the delayed increase in GluR1 activity might underlie the second SP phase.
Earlier studies using expression of the GluR1-GFP fusion protein in organotypic slices showed that the distribution of the GluR1-GFP fusion protein mimics intracellular endogenous GluR1 distribution (Shi et al, 1999; Hayashi et al, 2000). In the present study, we have confirmed this finding at synaptic sites of cultured hippocampal neurons. In addition, we have observed a GluR1-GFP fluorescence intensity increase at synaptic sites where there was a release probability increase and appearance of new GluR1 puncta dependent upon the retrograde messenger cascade activation. There was no GluR1-GFP fluorescence increase at high-probability synapses, which also remained unmodified. Our results under low and high-probability conditions show that the tetanus-induced increase in GluR1-GFP fluorescence at individual synapses depends on release probability increase at those synapses suggesting that the extent of prS potentiation determines the extent of pstS AMPA receptor activation. Thus, these results together with the demonstration that the GluR1-GFP intensity increase happens at 10 min after tetanus but not at 1 min after tetanus, suggest that tetanus-induced long-lasting potentiation in cultured hippocampal neurons primarily involves immediate prS changes that in turn modulate pstS machinery. As previous studies have shown membrane insertion of AMPA receptors during SP in both cultured hippocampal neurons (Lu et al, 2001; Pickard et al, 2001) and organotypic slice cultures (Shi et al, 1999), we infer that the GluR1-GFP increase at synaptic sites observed in our studies involves plasma membrane GluR1 insertion. Moreover, there was lower basal GluR1 fluorescence at high-probability sites reflecting compensatory phenomena at individual synapses. Such compensatory mechanisms have been observed in cultured hippocampal neurons in which the average size of synaptic currents and of responses to focal glutamate application varied four-fold across different cells, decreasing markedly with increasingly dense synaptic innervation (Liu and Tsien, 1995). In other words, our data suggest that an ongoing cross-talk between prS and pstS sites controls pstS activation during SP. Further, these data suggest how precisely release probability regulates synaptic strengthening at individual synapses.
Materials and methods
Cell cultures and transfection
Primary cultures were prepared from 1–2-day-old B6SJLF1/J mouse pups as described earlier (Arancio et al, 1995; Ninan and Arancio, 2004). Neurons were transfected on day 1 by electroporation using Nucleofector 1 (Amaxa Biosystems; Supplementary Materials and methods).
Electrophysiology
The glass coverslip containing 10–15-day-old hippocampal neurons was transferred to the recording chamber. Neurons were held under ruptured whole-cell voltage clamp throughout the experiment; sEPSCs were measured as described (Arancio et al, 1995; Ninan and Arancio, 2004) (Supplementary Materials and methods).
Vesicle cycling
Coverslips with neurons were mounted on a Plexiglas chamber on the stage of a laser scanning confocal microscope. Synaptic vesicles were stained with FM4-64 by perfusing the neurons with bath solution containing 10 μM FM4-64 and evoking action potentials (Supplementary Materials and methods, Supplementary Figure S6).
Data analysis
Statistical analyses were performed with Student's t-test, ANOVA and post hoc comparison. Most data were normalized to the basal values and results were expressed as mean±standard error mean (s.e.m.). Data on probability measurements are presented as a range with median and analyzed by WPMT.
Supplementary Material
Supplementary information
Supplementary Figures
Acknowledgments
This work was supported by NIH (NS 40045-49442). We thank Drs Richard Scheller and Yasunori Hayashi for providing the plasmids of VAMP2-GFP and GluR1-GFP, respectively.
References
- Ahmari SE, Buchanan J, Smith SJ (2000) Assembly of presynaptic active zones from cytoplasmic transport packets. Nat Neurosci 3: 445–451 [DOI] [PubMed] [Google Scholar]
- Allen C, Stevens CF (1994) An evaluation of causes for unreliability of synaptic transmission. Proc Natl Acad Sci USA 91: 10380–10383 [DOI] [PMC free article] [PubMed] [Google Scholar]
- Antonova I, Arancio O, Trillat AC, Wang HG, Zablow L, Udo H, Kandel ER, Hawkins RD (2001) Rapid increase in clusters of presynaptic proteins at onset of long-lasting potentiation. Science 294: 1547–1550 [DOI] [PubMed] [Google Scholar]
- Arancio O, Kandel ER, Hawkins RD (1995) Activity-dependent long-term enhancement of transmitter release by presynaptic 3',5'-cyclic GMP in cultured hippocampal neurons. Nature 376: 74–80 [DOI] [PubMed] [Google Scholar]
- Benke TA, Luthi A, Isaac JT, Collingridge GL (1998) Modulation of AMPA receptor unitary conductance by synaptic activity. Nature 393: 793–797 [DOI] [PubMed] [Google Scholar]
- Bi GQ, Poo MM (1998) Synaptic modifications in cultured hippocampal neurons: dependence on spike timing, synaptic strength, and postsynaptic cell type. J Neurosci 18: 10464–10472 [DOI] [PMC free article] [PubMed] [Google Scholar]
- Buchs PA, Muller D (1996) Induction of long-term potentiation is associated with major ultrastructural changes of activated synapses. Proc Natl Acad Sci USA 93: 8040–8045 [DOI] [PMC free article] [PubMed] [Google Scholar]
- Carroll RC, Lissin DV, von Zastrow M, Nicoll RA, Malenka RC (1999) Rapid redistribution of glutamate receptors contributes to long-term depression in hippocampal cultures. Nat Neurosci 2: 454–460 [DOI] [PubMed] [Google Scholar]
- Choi S, Klingauf J, Tsien RW (2000) Postfusional regulation of cleft glutamate concentration during LTP at ‘silent synapses'. Nat Neurosci 3: 330–336 [DOI] [PubMed] [Google Scholar]
- Dobrunz LE, Stevens CF (1997) Heterogeneity of release probability, facilitation, and depletion at central synapses. Neuron 18: 995–1008 [DOI] [PubMed] [Google Scholar]
- East SJ, Garthwaite J (1991) NMDA receptor activation in rat hippocampus induces cyclic GMP formation through the L-arginine-nitric oxide pathway. Neurosci Lett 123: 17–19 [DOI] [PubMed] [Google Scholar]
- Emptage NJ, Reid CA, Fine A, Bliss TV (2003) Optical quantal analysis reveals a presynaptic component of LTP at hippocampal Schaffer-associational synapses. Neuron 38: 797–804 [DOI] [PubMed] [Google Scholar]
- Hayashi Y, Shi SH, Esteban JA, Piccini A, Poncer JC, Malinow R (2000) Driving AMPA receptors into synapses by LTP and CaMKII: requirement for GluR1 and PDZ domain interaction. Science 287: 2262–2267 [DOI] [PubMed] [Google Scholar]
- Hessler NA, Shirke AM, Malinow R (1993) The probability of transmitter release at a mammalian central synapse. Nature 366: 569–572 [DOI] [PubMed] [Google Scholar]
- Humeau Y, Shaban H, Bissiere S, Luthi A (2003) Presynaptic induction of heterosynaptic associative plasticity in the mammalian brain. Nature 426: 841–845 [DOI] [PubMed] [Google Scholar]
- Kase H (1988) New inhibitors of protein kinases from microbial source. In Proceedings of Seventh International Symposium on Biology of Actinomycetes, Okami Y, Beppu T, Ogawara H (eds) pp 159–164. Tokyo: Japan Scientific Societies Press [Google Scholar]
- Liao D, Hessler NA, Malinow R (1995) Activation of postsynaptically silent synapses during pairing-induced LTP in CA1 region of hippocampal slice. Nature 375: 400–404 [DOI] [PubMed] [Google Scholar]
- Lissin DV, Carroll RC, Nicoll RA, Malenka RC, von Zastrow M (1999) Rapid, activation-induced redistribution of ionotropic glutamate receptors in cultured hippocampal neurons. J Neurosci 19: 1263–1272 [DOI] [PMC free article] [PubMed] [Google Scholar]
- Liu G, Choi S, Tsien RW (1999) Variability of neurotransmitter concentration and nonsaturation of postsynaptic AMPA receptors at synapses in hippocampal cultures and slices. Neuron 22: 395–409 [DOI] [PubMed] [Google Scholar]
- Liu G, Tsien RW (1995) Properties of synaptic transmission at single hippocampal synaptic boutons. Nature 375: 404–408 [DOI] [PubMed] [Google Scholar]
- Liu S, Ninan I, Antonova I, Battaglia F, Trinchese F, Narasanna A, Kolodilov N, Dauer W, Hawkins RD, Arancio O (2004) alpha-Synuclein produces a long-lasting increase in neurotransmitter release. EMBO J 23: 4506–4516 [DOI] [PMC free article] [PubMed] [Google Scholar]
- Lu W, Man H, Ju W, Trimble WS, MacDonald JF, Wang YT (2001) Activation of synaptic NMDA receptors induces membrane insertion of new AMPA receptors and LTP in cultured hippocampal neurons. Neuron 29: 243–254 [DOI] [PubMed] [Google Scholar]
- Ma L, Zablow L, Kandel ER, Siegelbaum SA (1999) Cyclic AMP induces functional presynaptic boutons in hippocampal CA3-CA1 neuronal cultures. Nat Neurosci 2: 24–30 [DOI] [PubMed] [Google Scholar]
- Malgaroli A, Tsien RW (1992) Glutamate-induced long-term potentiation of the frequency of miniature synaptic currents in cultured hippocampal neurons. Nature 357: 134–139 [DOI] [PubMed] [Google Scholar]
- Matsuzaki M, Honkura N, Ellis-Davies GC, Kasai H (2004) Structural basis of long-term potentiation in single dendritic spines. Nature 429: 761–766 [DOI] [PMC free article] [PubMed] [Google Scholar]
- Murthy VN, Stevens CF (1998) Synaptic vesicles retain their identity through the endocytic cycle. Nature 392: 497–501 [DOI] [PubMed] [Google Scholar]
- Neuhoff H, Roeper J, Schweizer M (1999) Activity-dependent formation of perforated synapses in cultured hippocampal neurons. Eur J Neurosci 11: 4241–4250 [DOI] [PubMed] [Google Scholar]
- Ninan I, Arancio O (2004) Presynaptic CaMKII is necessary for synaptic plasticity in cultured hippocampal neurons. Neuron 42: 129–141 [DOI] [PubMed] [Google Scholar]
- Ninan I, Liu S, Arancio O (2005) Tetanus-induced presynaptic remodeling in cultured hippocampal neurons. Soc Neurosci Abstracts, Washington, p 2005 2610.2012 [Google Scholar]
- Palmer MJ, Isaac JT, Collingridge GL (2004) Multiple, developmentally regulated expression mechanisms of long-term potentiation at CA1 synapses. J Neurosci 24: 4903–4911 [DOI] [PMC free article] [PubMed] [Google Scholar]
- Pickard L, Noel J, Duckworth JK, Fitzjohn SM, Henley JM, Collingridge GL, Molnar E (2001) Transient synaptic activation of NMDA receptors leads to the insertion of native AMPA receptors at hippocampal neuronal plasma membranes. Neuropharmacology 41: 700–713 [DOI] [PubMed] [Google Scholar]
- Reid CA, Dixon DB, Takahashi M, Bliss TV, Fine A (2004) Optical quantal analysis indicates that long-term potentiation at single hippocampal mossy fiber synapses is expressed through increased release probability, recruitment of new release sites, and activation of silent synapses. J Neurosci 24: 3618–3626 [DOI] [PMC free article] [PubMed] [Google Scholar]
- Renger JJ, Egles C, Liu G (2001) A developmental switch in neurotransmitter flux enhances synaptic efficacy by affecting AMPA receptor activation. Neuron 29: 469–484 [DOI] [PubMed] [Google Scholar]
- Rosenmund C, Clements JD, Westbrook GL (1993) Nonuniform probability of glutamate release at a hippocampal synapse. Science 262: 754–757 [DOI] [PubMed] [Google Scholar]
- Rosenmund C, Stevens CF (1996) Definition of the readily releasable pool of vesicles at hippocampal synapses. Neuron 16: 1197–1207 [DOI] [PubMed] [Google Scholar]
- Ryan TA, Ziv NE, Smith SJ (1996) Potentiation of evoked vesicle turnover at individually resolved synaptic boutons. Neuron 17: 125–134 [DOI] [PubMed] [Google Scholar]
- Sampo B, Kaech S, Kunz S, Banker G (2003) Two distinct mechanisms target membrane proteins to the axonal surface. Neuron 37: 611–624 [DOI] [PubMed] [Google Scholar]
- Shi SH, Hayashi Y, Petralia RS, Zaman SH, Wenthold RJ, Svoboda K, Malinow R (1999) Rapid spine delivery and redistribution of AMPA receptors after synaptic NMDA receptor activation. Science 284: 1811–1816 [DOI] [PubMed] [Google Scholar]
- Slutsky I, Sadeghpour S, Li B, Liu G (2004) Enhancement of synaptic plasticity through chronically reduced Ca2+ flux during uncorrelated activity. Neuron 44: 835–849 [DOI] [PubMed] [Google Scholar]
- Stevens CF, Sullivan JM (1998) Regulation of the readily releasable vesicle pool by protein kinase C. Neuron 21: 885–893 [DOI] [PubMed] [Google Scholar]
- Stewart MG, Medvedev NI, Popov VI, Schoepfer R, Davies HA, Murphy K, Dallerac GM, Kraev IV, Rodriguez JJ (2005) Chemically induced long-term potentiation increases the number of perforated and complex postsynaptic densities but does not alter dendritic spine volume in CA1 of adult mouse hippocampal slices. Eur J Neurosci 21: 3368–3378 [DOI] [PubMed] [Google Scholar]
- Sumi M, Kiuchi K, Ishikawa T, Ishii A, Hagiwara M, Nagatsu T, Hidaka H (1991) The newly synthesized selective Ca2+/calmodulin dependent protein kinase II inhibitor KN-93 reduces dopamine contents in PC12h cells. Biochem Biophys Res Commun 181: 968–975 [DOI] [PubMed] [Google Scholar]
- Toni N, Buchs PA, Nikonenko I, Bron CR, Muller D (1999) LTP promotes formation of multiple spine synapses between a single axon terminal and a dendrite. Nature 402: 421–425 [DOI] [PubMed] [Google Scholar]
- Toni N, Buchs PA, Nikonenko I, Povilaitite P, Parisi L, Muller D (2001) Remodeling of synaptic membranes after induction of long-term potentiation. J Neurosci 21: 6245–6251 [DOI] [PMC free article] [PubMed] [Google Scholar]
- Wang HG, Lu FM, Jin I, Udo H, Kandel ER, de Vente J, Walter U, Lohmann SM, Hawkins RD, Antonova I (2005) Presynaptic and postsynaptic roles of NO, cGK, and RhoA in long-lasting potentiation and aggregation of synaptic proteins. Neuron 45: 389–403 [DOI] [PubMed] [Google Scholar]
Associated Data
This section collects any data citations, data availability statements, or supplementary materials included in this article.
Supplementary Materials
Supplementary information
Supplementary Figures