Abstract
The present study was performed to elucidate the mechanisms responsible for the changes of melanin content/distribution we had previously discovered in the liver parenchyma of Rana esculenta during natural hibernation. Melanomacrophagic component response was analysed using morphocytochemical methods. The results demonstrated that during the prehibernation period (October–November) the melanomacrophages reach the highest proliferative activity (BrdU, PCNA labelling) which is accompanied by an evident melanosynthesis (dopa-oxidase activity). In contrast, after hibernation, the decrease of liver pigmentation was the consequence of a partial cell loss by apoptotic mechanisms (TUNEL labelling, pyknosis-karyorhexis) accompanied by a decrease of melanosome content by autophagy and low melanosynthetic activity. On the basis of these findings, there is evidence that liver melanomacrophages represent a metabolically (melanin synthesis/degradation) and cytokinetically (proliferation/death) active cell population during the annual cycle of the frog. The results are also discussed in relation to the functional synergism between hepatocytes and pigment cells in the adaptation to environmental changes.
Keywords: apoptosis, cell proliferation, frog liver, hibernation, melanomacrophages
Introduction
In previous studies, we demonstrated that during natural hibernation the liver parenchymal cells (hepatocytes) of amphibians undergo drastic structural and functional changes. As a consequence of the adaptation to the long winter period characterized by low environmental temperature and food deprivation, the frog hepatocytes become hypertrophic, presenting large amounts of storage material (e.g. glycogen and lipids), and contain scarce organelles, mainly in segregated areas (Barni & Bernocchi, 1991; Fenoglio et al. 1992). In addition to the morphofunctional modifications of the hepatocytes, changes in the amount and distribution of liver melanin during the circannual rhythm was reported in the melanomacrophagic cell component (pigmented Kupffer cells). In particular, melanin content of the frog liver was found to be at a maximum in the cold months and at a minimum content during the warmer period (Sichel et al. 1981; Corsaro et al. 1990; Barni et al. 1999). These findings were interpreted according to the functional role (e.g. phagocytosis, cytotoxic substance inactivation) played by the pigment cell component in the general physiology of the heterothermic vertebrate liver and, in particular, in relation to a compensatory engagement of these cells against hepatocellular hypoactivity during winter (Barni et al. 1999).
Upon this background of information, we investigated the possible mechanisms responsible for the changes to the amount/distribution of hepatic melanin during the different periods of the natural annual cycle of Rana esculenta. For this purpose, cytokinetic, metabolic and structural parameters, relative to the melanomacrophagic cells of the liver, were considered.
Materials and methods
Sampling of animals
Adult males of edible frog (Rana esculentaL.) were caught in their natural environment for two successive years during the active period (June, mean environmental temperature 21.4 °C), the pre-hibernating period (October/November, mean environmental temperature 9.2 °C), the hibernating period (December/January, mean environmental temperature 0.3 °C) and the post-hibernating period (March/April, mean environmental temperature 15.5 °C). These periods of the year were selected on the basis of previous investigations regarding hepatocyte morphofunctionality (Fenoglio et al. 1992). Edible frogs (total length 45–65 mm, weight 9–34 g) were collected from rice field drains and during winter from terrestrial hibernation sites in the countryside near Pavia (northern Italy).
To label DNA replicating cells, the animals were intraperitoneally injected with bromodeoxyuridine (BrdU) at a dose of 0.1 mg g−1body weight, 2 h before being killed. The animals were killed under anaesthesia with MS 222 by decapitation and the livers were immediately removed, excised and processed for morphological and cytochemical analysis employing both light and electron microscopy.
To avoid circadian variations, sampling was always conducted between 15:00 and 16:00 hours.
Light and electron microscopy morphology
Liver fragments of about 1 mm were fixed at 4 °C for 3 h by immersion in 1.5% glutaraldehyde buffered with 0.07 mcacodylate buffer (pH 7.4), washed in the same buffer plus 7% sucrose, post-fixed in 1% OsO4in 0.1 mphosphate buffer (pH 7.4) for 2 h at 4 °C, dehydrated in a graded series of ethanol and embedded in Epon 812. Semithin sections (1 µm thick) were stained with 1% borated methylene blue. Ultrathin sections (about 60 nm thick) were doubly stained with saturated uranyl acetate in 50% acetone and Reynold's lead citrate solution. The specimens were examined with a Zeiss EM 300 electron microscope operating at 80 kV.
Anti-BrdU and anti-PCNA immunocytochemistry
To evaluate the proliferation activity in the premelanic and melanic liver cells, immunohistochemical detection of bromodeoxyuridine (BrdU) uptake and proliferating cell nuclear antigen (PCNA) expression was performed using both light and electron microscopic approaches.
For the light microscopical studies, pieces of liver tissue were fixed for 12 h at room temperature with 2% (w/v) paraformaldehyde in 0.1 mphosphate buffer (pH 7.4), dehydrated through a graded series of ethanol, embedded in Paraplast-wax and sectioned at 6 µm. The anti-BrdU reaction was performed on specimens dewaxed in xylene and rehydrated in a graded series of ethanol to PBS, after endogenous peroxidase block by 3% H2O2in 10% methanol and DNA denaturation with 2 mHCl (15 min at room temperature) followed by quenching with boric acid buffer (pH 8). Non-specific binding was blocked by incubating the slides in 10% normal rabbit serum in PBS for 45 min at room temperature. In the immunostaining the PAP method was used. The sections were first incubated overnight with a mouse monoclonal antibody against BrdU (Dako, Glostrup, DK) diluted 1 : 20 at room temperature in a humidified chamber. In the second step, a rabbit antibody against mouse IgG diluted 1 : 50 was applied for 2 h, and finally the incubation with peroxidase–antiperoxidase complex (PAP) diluted 1 : 200 was performed for 2 h at room temperature.
For the PCNA detection a similar procedure was used, while the HCl incubation was omitted and the unmasking of antigen epitope was induced by heating the specimens at 95 °C for 10 min in 10 mmsodium citrate buffer (pH 6). Between each conjugation, sections were washed for 10 min with PBS buffer. The staining colour of the immunolabelling was developed using 0.05% aminoethylcarbazol (AEC) in 0.1 mTRIS buffer (pH 7.6) with 0.2% H2O2, which resulted in a reddish colour, clearly distinguishable from the brown melanin; in some specimens the reaction was developed using a 0.1% diaminobenzidine (DAB) solution. The sections were then lightly counterstained with Haematoxylin-Eosin (H&E). For negative controls, the primary antibodies were replaced with a solution containing phosphate-buffered saline and the immunostaining was carried out; in this case any specific immunoreactivity was found.
For the electron microscopical studies, small pieces of liver tissue were fixed for 2 h at 4 °C with 2% paraformaldehyde containing 0.2% glutaraldehyde in 0.07 mcacodylate buffer (pH 7.4), dehydrated with a graded series of ethanol, and embedded in LR-White resin. Ultrathin sections (about 60 nm thick) were obtained to perform the immunogold labellings. The anti-BrdU reaction was performed after DNA denaturation with 3 nHCl (45 min at room temperature). The sections were incubated overnight at 4 °C using a mouse monoclonal antibody against BrdU (Becton-Dickinson, Mountain View, CA, USA) diluted 1 : 5. The primary antibody was then revealed by the goat anti-mouse antibody, coupled with 25-nm gold particles (Aurion, Wageningen, The Netherlands), diluted 1 : 6. The PCNA was detected by incubation overnight at room temperature with a mouse monoclonal antibody (American Biotechnology, Plantation, USA) diluted 1 : 5. Primary antibody was revealed by the goat anti-mouse antibody, conjugated with 25-nm gold particles, diluted 1 : 6.
The specificity of the immunoreactions was controlled by omitting the incubation with the primary antibodies; in these conditions the sections were pratically devoid of immunogold particles at nuclear level.
The specimens were stained with saturated aqueous uranyl acetate and examined with a Zeiss EM 900 electron microscope operating at 80 kV.
Cytochemistry for apoptotic DNA fragmentation
In addition to morphological criteria, the apoptotic cell death was assayed by in situ detection of DNA fragmentation using the terminal deoxynucleotidyl-transferase (TUNEL) assay (Oncogene Res. Prod., Boston, MA, USA). Tissue sections (6 µm thick) of 4% paraformaldehyde-fixed material were incubated for 5 min with 20 µg mL−1proteinase-K solution at room temperature, followed by treatment with 3% H2O2to quench endogenous peroxidase activity. After incubation with the TUNEL solution (90 min with TdT/biotinylated dNTP and 30 min with HRP-conjugate streptavidin) in a humidified chamber at 37 °C, the reaction was developed using 0.05% AEC in 0.1 mTRIS buffer (pH 7.6) with 0.2% H2O2; in some specimens the reaction was developed using a 0.1% DAB solution.
The specimens were lightly counterstained with H&E. As a negative control, the TdT incubation was omitted.
Data analysis and statistics
Quantitative evaluation of BrdU, PCNA and TUNEL positive cells (BrdU-LI, PCNA-LI, TUNEL-LI) was calculated as the percentage (Labelling Index) in relation to a total number (about 300) of melanomacrophages for every animal in different representative microscopic fields.
Statistical comparisons among the different annual periods were performed using the one-way anova(multiple range test, Duncan procedure); differences between medians were considered significant at P< 0.05.
Ultrastructure of DOPA-oxidase activity
Small pieces of liver tissue were prefixed in a solution of 2% paraformaldehyde and 0.25% glutaraldehyde in 0.1 mcacodylate buffer (pH 7.4) supplemented with 7% sucrose. After a prolonged washing in the fixation buffer, the samples were incubated overnight at room temperature in 0.1% L-Dopa in 0.1 mcacodylate buffer (pH 7.4). After washing, the pieces were fixed with 1.5% glutaraldehyde in 0.1 mcacodylate buffer for 1 h, washed in the same buffer and post-fixed with 1% OsO4in 0.1 mphosphate buffer for 2 h at 4 °C.
As controls, some samples were incubated in: (a) medium without L-DOPA, and (b) medium containing 0.1 mg mL−1catalase (to eliminate peroxidase-dependent DOPA-oxidation).
The samples were then dehydrated in a graded series of ethanol and embedded in Epon 812. Ultrathin sections (about 60 nm thick) were either unstained or doubly stained with saturated uranyl acetate in 50% acetone and Reynold's lead citrate solution. The specimens were observed in a Zeiss EM 900 electron microscope operating at 80 kV.
No evident reaction products were found in the controls incubated in medium a; catalase-resistant reaction products were noticed in samples incubated in medium b.
Results
During the four periods of the natural annual cycle of Rana esculenta considered here (i.e. activity, pre-hibernation, hibernation, post-hibernation), evident changes to the cytokinetics (i.e. cell proliferation, cell death) and metabolic (e.g. melanosynthesis) activities of the liver pigment cell component were detected.
On the basis of our observations, more intense proliferative activity of the cells, as determined from immunocytochemical detection of bromodeoxyuridine (BrdU) uptake and expression of proliferating cell nuclear antigen (PCNA), was found to occur in October–November (pre-hibernating period) (Figure 1). PCNA LIs were always higher than BrdU LIs because PCNA is also expressed, in addition to the S-phase, during the G1and G2phases of the cell cycle. The nuclear labelling both for BrdU and PCNA was localized in the nuclei of both small and large macrophagic cells, preferentially distributed on the sinusoid walls, showing a different melanin content. Figure 2 shows some of the essential steps of cell differentiation from unpigmented macrophages (Kupffer cells) to fully differentiated melanomacrophages (pigment cells with a large melanin content) in the phase of DNA synthesis.
Fig. 1.
Changes in percentages of BrdU, PCNA and TUNEL labelling index (L.I.) of liver melanomacrophage nuclei during the annual cycle. The data are expressed as mean ± SE. Statistically significant differences (P< 0.01) were detected among the various periods (exception for the PCNA L.I. in the M/A-J comparison). October/November: O/N; December/January: D/Ja; March/April: M/A; June: Ju.
Fig. 2.
Light microscopy of nuclear anti-BrdU immunoreactivity (arrowheads) in the liver melanomacrophages (Kupffer and pigment cells) during the pre-hibernating phase. Labelled cells with increasing melanin content, up to completely melanized (various differentiation steps), are reported from a to d. Scale bars = 15 μm.
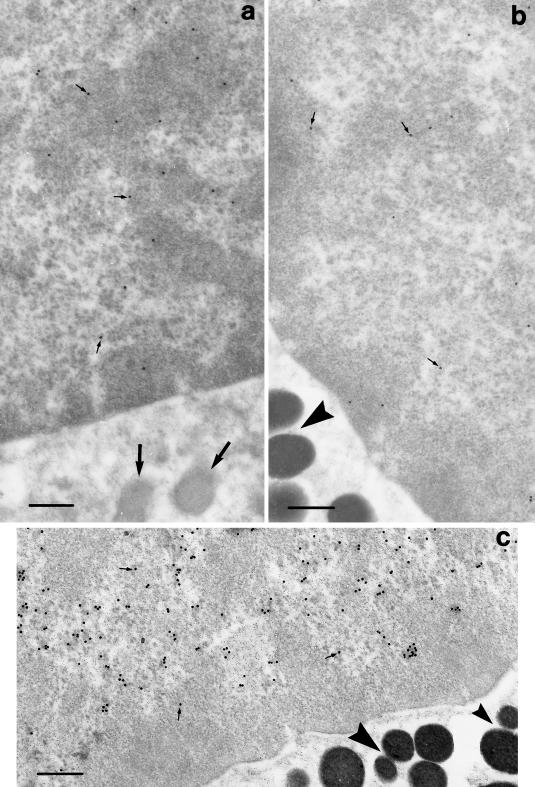
The immunogold reaction of ultrathin sections against BrdU and PCNA showed, at the ultrastructural level, the nuclear labelling of melanosome-free cells or melanosomes at different stages of maturation, i.e. premelanosomes with a typical filamentous matrix and low electron density, and uniformly strong electron-dense melanosomes (Figure 3).
Fig. 3.
Ultrastructure of BrdU (a, b) and PCNA (c) immunogold labelling of nuclei in immature (a) and mature (b, c) liver pigment cells during the pre-hibernation phase. The arrows (a) and arrowheads (b, c) indicate, respectively, the presence of premelanosomic and melanosomic cytoplasmic granules. The small arrows point to some immunogold particles. Scale bars = 0.5 μm.
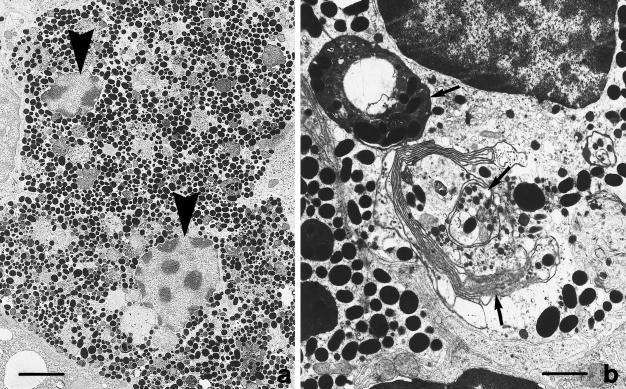
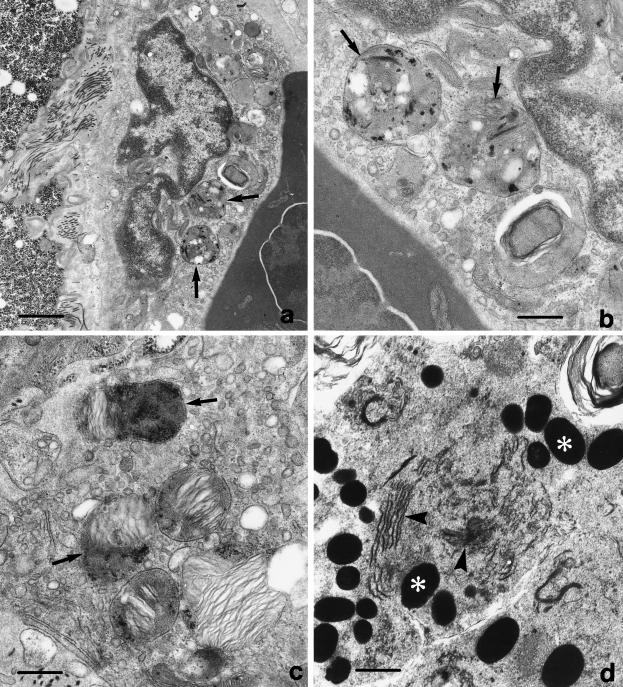
Nuclear division was not always automatically followed by cytoplasm cleavage; consequently, large binucleated pigment cells full of melanosomes were more frequently found during the winter period (Figure 4). In addition to the highest proliferative activity of the annual cycle, during the pre-hibernating phase the melanomacrophagic cells were found to be active in the melanosynthesis (highest levels of dopa-oxidase expression). In fact, in the cytoplasm of cells with a different degree of differentiation, dopa cytochemical analysis at the ultrastructural level revealed a marked reaction product (Figure 5). In general, the centre of melanogenesis was characterized by the presence of premelanosomes showing electron-dense reaction granules sometimes associated with an organized fibrillar network. The dopa reaction product appeared also typically localized in the Golgi cisternae and in the network of smooth-surfaced tubules sometimes associated with the Golgi apparatus (Figure 5d).
Fig. 4.
Ultrastructure of a large binucleated pigment cell full of melanosomes (a) found in the liver during pre-hibernation; the arrowheads point to the two nuclei localized in the same cell; (b) patterns of cytoplasm and melanosome loss by autophagy (arrows) during post-hibernation. Scale bars = a, 5 μm; b,1.5 μm.
Fig. 5.
Electron micrographs of dopa-oxidase activity in the liver pigment cells, at different stages of maturation, during pre-hibernation. The arrowheads indicate premelanosomes (a–c) characterized by the presence of electron-dense cytochemical reaction product and sometimes with the typical fibrillar network (c). In d the asterisks indicate mature melanosomes around a melanogenesis centre; the Golgi complex contains an electron-dense reaction product (arrowheads). Scale bars = a, d, 2 μm; b, c, 1 μm.
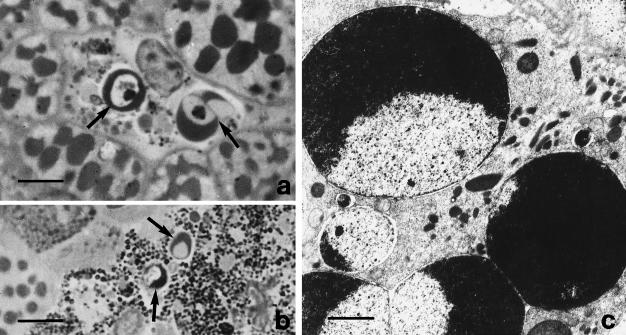
In comparison with pre-hibernation, during post-hibernation (May–April) the pigment cell cytokinetics revealed low proliferative activity, high cell loss (Figure 1) and melanosome resorption by autophagocytosis (Figure 4b). Cell loss was shown to occur through certain typical apoptotic expressions detectable by morphological (chromatin hypercondensation and margination, karyorexis) and cytochemical (TUNEL labelling of DNA fragmentation) criteria (Figures 6 and 7). Generally, apoptotic cell death was found in cells with a medium to high level of melanin pigment (Figure 6). In contrast with the ‘transitional’ periods (October–November and March–June), during the extreme periods of the annual cycle (winter and summer) reversed cell kinetic activities (i.e. cell proliferation and cell death) are seen (Figure 1). In the same period, cellular melanosynthesis, as revealed by dopa-oxidase activity, was scanty in comparison with that found in corresponding cells during the pre-hibernation phase.
Fig. 6.
Light microscopy of semithin sections (a, b) and electron microscopy (c) of liver pigment cells in apoptosis during post-hibernation. Arrows indicate the typical chromatin margination of the pyknotic and karyorrhetic nuclei. Scale bars = a, 10 μm; b, 20 μm; c, 2 μm.
Fig. 7.
Light microscopy of frog liver sections (March–April) processed for TUNEL labelling using two different reaction-developing substances (a: AEC; b: DAB). Arrows point to apoptotic nuclei belonging to pigment cells; asterisk shows the typical nuclear envelope dilatation. Scale bars = a, 25 μm; b, 8 μm.
Discussion
The liver of poikilothermic vertebrates is characterized by the presence of a phagocytic component (Kupffer cells) that is capable of synthesizing and demolishing the melanin pigment (Sichel et al. 1997); owing to this phenotype it is also known as the melanomacrophagic component (Agius, 1980; Zuasti et al. 1990).
In particular, studies performed on the liver of Rana esculenta have shown a direct relationship between Kupffer cell differentiation and melanin accumulation; in amphibians, therefore, a large amount of melanin is considered a marker of terminally differentiated Kupffer cells (Corsaro et al. 2000; Purrello et al. 2001).
The liver pigment cell component is a plastic population and can change its extension and dopa-oxidase activity both in natural (e.g. hibernation, ageing) and pathological (e.g. infections) situations (Vogelbein et al. 1987; Cicero et al. 1989; Corsaro et al. 1990; Christiansen et al. 1996; Barni et al. 1999).
The aim of this study was to define the mechanisms responsible for the increase of the melanin content/distribution that characterizes frog liver parenchyma during winter (Barni et al. 1999). For this reason, in addition to the two ‘extreme’ periods of the annual life cycle (i.e. summer and winter), the ‘transition’ phases, namely pre- and post-hibernation, were also considered.
The results demonstated that, in addition to the parenchymal and hemopoietic liver components (Barni & Bernocchi, 1991; Barni et al. 1992; Fenoglio et al. 1992), the melanomacrophagic cells also represent a population characterized by an evident plasticity both at cytokinetic (cell proliferation–death) and metabolic (melanosome building–demolition) levels. Moreover, the entirety of these cellular activities appeared to be present mainly in the transitional periods of the year. In particular, during the pre-hibernating period, the melanomacrophages were characterized by proliferation, hypertrophy and melanosynthetic activity, sometimes resulting in large binucleated cells filled with melanosomes. In contrast, during post-hibernation, mechanisms of cell loss through controlled cell death (apoptosis) and hypotrophy through partial autophagy were responsible for the return of the cell population to a normal size, thus restoring the typical pigmentation pattern seen during the active period.
With regard to cell proliferation, the large majority of pre-existing macrophagic cells, independently from the differentiation stage (stem component: unpigmented Kupffer cells; or terminally differentiated component: fully pigmented cells), were able to contribute to the process of cell population increase, undergoing cell division and growth. In contrast, cellular apoptotic mechanisms, more frequent during post-hibernation, prevailed in the melanin-containing histiocytic cells. In this regard, Purrello et al. (2001) have shown that liver pigment cells containing melanin may more easily undergo programmed cell death in comparison with cells with low pigment content. The presence of proliferating unpigmented macrophagic cells and the absence of the same kind of cell showing an apoptotic morphocytochemical phenotype throughout the year corroborate earlier studies regarding the derivation of amphibian liver pigment cells from the Kupffer cells by the tyrosinase gene expression (Guida et al. 2000; Purrello et al. 2001).
Similar kinetic changes (cell gain/cell loss) were also found in the hepatocytes during the annual cycle and, in female frogs, in relation to the reproductive cycle; mechanisms of liver hyperplasia/involution were in fact detected during pre- and post-hibernation (Barni et al. 2001) and during pre- and post-vitellogenesis (Assisi et al. 1999), both transitional phases being characterized by marked changes in the functional role of the liver.
During the active and hibernating periods, the more balanced situation between cell proliferation and cell death is the expression of cell turnover, more intense during the summer.
In conclusion, the liver of the frog is a very plastic organ in which both the epithelial (hepatocytes) and the histiocytic (Kupffer cells, pigment cells) components, as a consequence of a partial synergistic physiology, are very sensitive, in metabolic and cytokinetic terms, to certain annual biological rhythms (e.g. reproduction, hibernation, etc.). This apparently simple phenomenon, of which little is known, is probably regulated by highly integrated mechanisms responsible for maintaining a functional homeostatic balance during the different adaptation responses.
In the process of temperature, photoperiod and nutritional adaptation, during the winter, the increase in liver pigmentation appears to be the result of different cellular mechanisms, namely hyperplasy, hypertrophy and melanosome accumulation (for synthesis see Figure 8). This situation seems to compensate, from a metabolic defence standpoint (e.g. scavenging of reactive molecules such as free radicals), for the decrease in hepatocyte function, as characterized by an intense engagement in the storage of trophic materials (i.e. glycogen and lipids) (Mizell, 1965; Barni & Bernocchi, 1991; Fenoglio et al. 1992) as energy reserves during the fasting periods (Storey & Storey, 1988).
Fig. 8.
Schematic representation of the possible kinetic activity of the frog liver melanomacrophages during the annual cycle. Hypertrophy and partial autophagy also involve changes (increase and decrease, respectively) in the melanosome content.
Acknowledgments
This work was supported by a grant (F.A.R.) from the University of Pavia.
References
- Agius C. Phylogenetic development of melano-macrofage centres in fish. J. Zool. London. 1980;191:11–31. [Google Scholar]
- Assisi L, Autuori F, Botte V, Farrace MG, Piacentini M. Hormonal control of tissue transglutaminase induction during programmed cell death in frog liver. Exp. Cell Res. 1999;247:339–346. doi: 10.1006/excr.1998.4358. [DOI] [PubMed] [Google Scholar]
- Barni S, Bernini F, Vaccarone R, Bertone V, Bottone MG, Chiari P, et al. La plasticità della cellula epatica durante il ciclo annuale di Ranakl esculenta: aspetti morfometrici e citocinetici. Pianura. 2001;13:19–23. [Google Scholar]
- Barni S, Bernocchi G. Internalization of erythrocytes into liver parenchymal cells in naturally hibernating frogs (Rana esculentaL.) J. Exp. Zool. 1991;258:143–150. doi: 10.1002/jez.1402580202. [DOI] [PubMed] [Google Scholar]
- Barni S, Bertone V, Croce AC, Bottiroli G, Bernini F, Gerzeli G. Increase in liver pigmentation during natural hibernation in some amphibians. J. Anat. 1999;195:19–25. doi: 10.1046/j.1469-7580.1999.19510019.x. [DOI] [PMC free article] [PubMed] [Google Scholar]
- Barni S, Nano R, Bertone V, Prosperi E. Ultrastructure and cytochemistry of circulating erythrocytes during the annual cycle of Rana esculenta. Comparative Haematol. Int. 1992;2:166–169. [Google Scholar]
- Cicero R, Mallardi A, Maida I, Gallone A, Pintucci G. Melanogenesis in the pigment cells of Rana esculentaL. evidence for tyrosinase-like activity in the melanosome protein fraction. Pigment Cell res. 1989;2:100–108. doi: 10.1111/j.1600-0749.1989.tb00169.x. [DOI] [PubMed] [Google Scholar]
- Corsaro C, Scalia M, Leotta M, Mondio F, Sichel G. Characterisation of Kupffer cells in some Amphibia. J. Anat. 2000;196:249–261. doi: 10.1046/j.1469-7580.2000.19620249.x. [DOI] [PMC free article] [PubMed] [Google Scholar]
- Corsaro C, Scalia M, Sinatra M, Sichel G. Circannual rhythm of the melanin content in frog liver (Rana esculentaL.) Pigment Cell res. 1990;3:120–122. doi: 10.1111/j.1600-0749.1990.tb00331.x. [DOI] [PubMed] [Google Scholar]
- Christiansen JL, Grzybowski JM, Kodama RM. Melanomacrophage aggregations and their age relationship in the yellow mud turtle, Kinosternon flavescens. Pigment Cell res. 1996;9:185–190. doi: 10.1111/j.1600-0749.1996.tb00108.x. [DOI] [PubMed] [Google Scholar]
- Fenoglio C, Bernocchi G, Barni S. Frog hepatocyte modifications induced by seasonal variations: a morfological and cytochemical study. Tissue Cell. 1992;24:17–29. doi: 10.1016/0040-8166(92)90077-k. [DOI] [PubMed] [Google Scholar]
- Guida G, Gallone A, Maida I, Boffoli D, Cicero R. Tyrosinase gene expression in the Kupffer cells of Rana esculentaL. Pigment Cell res. 2000;13:431–435. doi: 10.1034/j.1600-0749.2000.130604.x. [DOI] [PubMed] [Google Scholar]
- Mizell S. Seasonal changes in energy reserves in the common frog, Rana pipiens. J. Cellular Comparative Physiol. 1965;66:251–258. doi: 10.1002/jcp.1030660212. [DOI] [PubMed] [Google Scholar]
- Purrello M, Scalia M, Corsaro C, Di Pietro C, Piro S, Sichel G. Melanosynthesis, differentiation, and apoptosis in Kupffer cells from Rana esculenta. Pigment Cell res. 2001;14:126–131. doi: 10.1034/j.1600-0749.2001.140208.x. [DOI] [PubMed] [Google Scholar]
- Sichel G, Brai M, Palminteri MC, Sciuto S. Seasonal dependence of ESR features of frog melanins. Comparative Biochem. Physiol. 1981;70B:611–613. [Google Scholar]
- Sichel G, Scalia M, Mondio F, Corsaro C. The amphibian Kupffer cells build and demolish melanosomes: an ultrastructural point of view. Pigment Cell res. 1997;10:271–287. doi: 10.1111/j.1600-0749.1997.tb00687.x. [DOI] [PubMed] [Google Scholar]
- Storey KB, Storey JM. Freeze tolerance in animals. Physiol. Rev. 1988;68:27–84. doi: 10.1152/physrev.1988.68.1.27. [DOI] [PubMed] [Google Scholar]
- Vogelbein WK, Fournie JW, Overstreet RM. Sequential development and morphology of experimentally induced hepatic melano-macrophage centres in Rivulus marmoratus. J. Fish Biol. 1987;31:145–115. [Google Scholar]
- Zuasti A, Ferrer C, Aroca P, Solano F. Distribution of extracutaneous melanin pigment in Sparus auratus, Mugil cephalus, and Dicertranchus labrax(Pisces, Teleostei) Pigment Cell res. 1990;3:126–131. doi: 10.1111/j.1600-0749.1990.tb00276.x. [DOI] [PubMed] [Google Scholar]


