

Abstract
The ion/ion reactions of several dozen reagent anions with triply protonated cations of the model peptide KGAILKGAILR have been examined to evaluate predictions of a Landau–Zener-based model for the likelihood for electron transfer. Evidence for electron transfer was provided by the appearance of fragment ions unique to electron transfer or electron capture dissociation. Proton transfer and electron transfer are competitive processes for any combination of anionic and cationic reactants. For reagent anions in reactions with protonated peptides, proton transfer is usually significantly more exothermic than electron transfer. If charge transfer occurs at relatively long distances, electron transfer should, therefore, be favored on kinetic grounds because the reactant and product channels cross at greater distances, provided conditions are favorable for electron transfer at the crossing point. The results are consistent with a model based on Landau–Zener theory that indicates both thermodynamic and geometric criteria apply for electron transfer involving polyatomic anions. Both the model and the data suggest that electron affinities associated with the anionic reagents greater than about 60–70 kcal/mol minimize the likelihood that electron transfer will be observed. Provided the electron affinity is not too high, the Franck–Condon factors associated with the anion and its corresponding neutral must not be too low. When one or the other of these criteria is not met, proton transfer tends to occur essentially exclusively. Experiments involving ion/ion attachment products also suggest that a significant barrier exists to the isomerization between chemical complexes that, if formed, lead to either proton transfer or electron transfer.
Introduction
Proton transfer and electron transfer constitute the two most important mechanisms for the transfer of charge, the former forming the basis for Brønsted acid–base chemistry and the latter forming the basis for oxidation/reduction chemistry. As a result, proton transfer and electron transfer reactions are among the most widely studied in all of chemistry. In the gas phase, they play important roles in, for example, atmospheric, interstellar, combustion, and discharge environments and are also key processes in many forms of ionization relevant to mass spectrometry. Such reactions often involve an ion and a neutral atom or molecule but can also involve reactions between oppositely charged ions in environments in which both ion polarities are present. Electron capture by a neutral or cationic species is also a common and important process in most of the same environments just mentioned. Significant attention has recently been focused on electron capture by multiply protonated peptides and proteins in the gas phase. This process, referred to as electron capture dissociation (ECD),1 has been observed to give rise to structurally informative fragmentation of the cations and is, therefore, useful for the identification and characterization of peptides and proteins. ECD of peptide and protein cations usually gives more extensive primary sequence information than can be derived from the dissociation of the ions via conventional ion activation methods. Often, ECD also provides information complementary to that derived from conventional methods. For example, ECD has been shown to be particularly useful in the characterization of post-translationally modified peptides and proteins2 because the process is selective for disulfide linkages and for polypeptide backbone linkages, whereas conventional activation methods often cleave the labile bonds associated with common post-translational modifications, such as phosphorylation and glycosylation. To date, efficient ECD has been restricted to only one form of mass spectrometry, that is, Fourier transform ion cyclotron resonance mass spectrometry, although recent reports describing ECD in electrodynamic ion traps at relatively low efficiencies have appeared.3
It has recently been demonstrated that peptide structural information similar to that derived from ECD can also be generated via gas-phase electron transfer reactions from singly charged anions to multiply protonated peptides.4 Dissociation resulting from electron transfer appears to be analogous to that resulting from electron capture in that peptide backbone cleavages to yield c- and z-type ions appear to be preferred over cleavages of labile bonds associated with phosphorylation4a,b and glycosylation,5 and cleavages of disulfide linkages appear to be preferred over backbone cleavages.6 Electron transfer dissociation (ETD), a term coined for fragmentation resulting from electron transfer via ion/ion reaction, is of particular interest for its potential as a structural tool in the identification and characterization of peptides and proteins. Ion/ion reactions are readily effected in electrodynamic ion traps,7 which are common components in tandem mass spectrometers of various types. Hence, polypeptide structural information, heretofore accessible only via ECD in Fourier transform ion cyclotron resonance instruments, may also be obtained with a variety of other mass spectrometric tools.
Protonated peptides might be expected to behave as Brønsted acids, rather than as oxidizing agents, in bimolecular reactions. In fact, for protonated peptides in reaction with neutral molecules, electron transfer is usually endothermic while proton transfer can be exothermic, depending upon the basicity of the molecule. The only peptide ion/neutral target electron transfer data presented to date employed collision energies of tens of kiloelectronvolts to induce endothermic electron transfer from metal vapor targets and C60.8 In the case of ion/ion reactions, however, particularly when the polypeptide is multiply charged, both proton transfer and electron transfer are often exothermic processes. In the majority of cases reported to date, proton transfer from a peptide or protein cation to a singly charged9 or multiply charged10 anion has been the dominant mechanism. Proton transfer is particularly useful as a means for charge state manipulation of peptides and proteins,11 whereas electron transfer appears to be a highly useful means for deriving structural information. Therefore, it is of interest to understand the characteristics of the anionic reagent that determine the extents to which proton transfer and electron transfer compete. In this report, we present results for reaction of a single triply charged peptide, which serves as a prototypical multiply protonated species, with a variety of anionic reagents having a range of electron affinities and Franck–Condon factors associated with the anion. The results are interpreted in the context of a curve crossing model that provides a firm basis upon which the characteristics of a reagent anion can be correlated with the likelihood for either electron transfer or proton transfer to multiply protonated peptides.
Experimental Section
Materials
Peptide samples were synthesized by SynPep (Dublin, CA). Acetic acid and methanol were obtained from Mallinckrodt (Phillipsburg). Azobenzene, cis-stilbene, norbornodiene, fluoranthene, perylene, sulfur, carbon disulfide, 2-iodopropane, 1,2-dinitrobenzene, 1,3-dinitrobenzene, 1,4-dinitrobenzene, 1,3,5-trinitrobenzene, picric acid (2,4,6-trinitrophenol), perfluoro-1,3-dimethylcyclohexane, and sulfur hexafluoride were all purchased from Sigma-Aldrich (St. Louis, MO). Sulfur dioxide was purchased from Scott Specialty Gases (Troy, MI). All peptide samples were used without further purification. Working solutions of 0.1 mg/mL in aqueous 1% acetic acid were prepared from 1 to 5 mg/mL stock aqueous peptide solutions. In the case of guanidinated KGAILKGAILR, the lysine residues were converted to homoarginine residues using a method described previously.12
Procedures
Most experiments were performed using a Finnigan Ion Trap Mass Spectrometer (ITMS) (San Jose, CA) equipped with multiple ion sources, as described in detail previously.13 In brief, a DC turning quadrupole is used to direct sequential injection of ions from three ion sources through an ion trap end-cap electrode, while a fourth ion source, an atmospheric sampling glow discharge ionization source (ASGDI), is mounted such that ions formed therein can be injected directly through the ring electrode of the ion trap. The injection and timing of all sources are controlled by the ITMS software. In this report, two of the three sources on the front-end of the DC turning quadrupole were used. A nanoelectrospray ionization source was used for generating peptide cations, and an ASGDI source was used for producing reagent anions.14 Borosilicate glass capillaries (0.86 mm i.d., 1.5 mm o.d.) were pulled using a P-87 Flaming/Brown micropipet puller (Sutter Instruments, Novato, CA) to form nanoelectrospray emitters. A stainless steel wire, attached to an electrode holder (Warner Instruments, Hamden, CT), was inserted into the capillary, and a potential of 1–2 kV was applied to the wire to induce electrospray.15 The ASGDI source for these studies consisted of two metal half-plates mounted within the ion source, as described in detail elsewhere.16 The voltage and current necessary to create a discharge were produced by applying about −400 V on one half-plate via a PVX-4150 high voltage pulser, Directed Energy Inc. (Fort Collins, CO), while the other plate was grounded. Solid and liquid reagents were introduced using a heated inlet system (with variable temperature controller). During operation, the pressure of the glow discharge source was maintained at ~0.8–1.6 Torr. Sulfur dioxide was introduced directly at a pressure of ~0.2–0.5 Torr. The experimental sequence typically consisted of the following steps: peptide cation accumulation, ion isolation, reagent anion accumulation, reagent anion isolation, mutual storage of oppositely charged ions to effect ion/ion reactions, removal of residual reagent anions, and mass analysis of product/residual reactant ions. Ion isolation steps were performed by radio frequency (rf) ion isolation ramps tuned to eject ions from selected ranges of mass-to-charge ratio.17 Appropriate resonance ejection conditions were used to obtain the desired mass/charge range.18
Some experiments were performed on a Hitachi (San Jose, CA) M-8000 3-DQ ion trap mass spectrometer, modified to allow for ion/ion reactions, which has been described previously.19 Reagent anions were formed using ASGDI and injected into the ion trap via a hole in the ring electrode.20 The order of events used in these experiments was very similar to that described above, although anion isolation was typically accomplished during anion accumulation. Filtered noise field (FNF) waveforms were used to isolate the desired charge state.21 In some cases, subsequent isolation and collision-induced dissociation (CID) steps were used. CID was performed by resonantly exciting ions of interest (~300 ms) using an auxiliary Agilent (Palo Alto, CA) 33120A arbitrary waveform generator controlled by a software TTL trigger. Mass analysis was performed by resonance ejection.
Calculations
High level density functional theory (DFT) and ab initio computations were carried out to obtain the structures and energies of ions and neutral species relevant to this study using Gaussian 03.22 Geometry optimizations, including vibrational analysis, were performed at the B3LYP/6-31G+(d) level.23 All stationary points were found to be true minima by carrying out vibrational frequency analysis using the same basis set.
To determine the energies of the various species, single-point energy calculations were performed with the GAUSSIAN-2 (G2)24 or GAUSSIAN-3 (G3)25 methods. These composite calculation methods consist of a sequence of well-defined single-point calculations, at the MP2, MP4, and QCISD(T) levels of theory, yielding relatively accurate quantities for properties. G3-derived quantities tend to be more accurate than those obtained from G2 energies, particularly in the calculations of ionization potentials and electron affinities.22 Therefore, calculated values reported in this paper were obtained with G3 theory. In those cases, where experimental data are available, the G3 results and experimental values are within 5 kcal/mol, with most examples showing agreement within 2 kcal/mol.
The Franck–Condon factors were calculated using a code developed by Zwier et al.26 based on an earlier program by Vivian and Callis.27 The program uses as input optimized geometries, normal mode harmonic vibrational frequencies, and normal mode Cartesian displacement coordinates from Gaussian 03 calculations. The overlap integrals are calculated using the recursion relations developed by Doktorov et al.28 The numbers listed correspond to transitions between the ground electronic states of the anion and corresponding neutral (see Table 2).
Table 2.
Franck–Condon Factors
| reagent | Franck–Condon factora <0|0>2 | Franck–Condon factor ∑ <0|≤10>2b | EA (A) (kcal/mol) | % ETDc, d | Re |
|---|---|---|---|---|---|
| norbornodienef | 6.5 × 10⁻³ | 1.1 × 10⁻² | 5.6g | 7.2 | 0.10 |
| cis-stilbenef | 5.8 × 10⁻⁵ | 5.2 × 10⁻³ | 10.4h | 9.8 | 0.60 |
| O2 | 4.9 × 10⁻² | 9.7 × 10⁻¹ | 10.4g | 4.9 | 0.81 |
| CS2 | 2.9 × 10⁻⁸ | 4.9 × 10⁻⁵ | 11.8j | <0.01 | |
| azobenzene | 1.6 × 10⁻¹ | 1.8 × 10⁻¹ | 13.1g | 48.8 | 0.86 |
| fluoranthene | 3.6 × 10⁻¹ | 3.6 × 10⁻¹ | 14.5j | 37.4 | 0.96 |
| perylene | 4.1 × 10⁻¹ | 4.1 × 10⁻¹ | 22.4g | 20.9 | 0.88 |
| nitrobenzenek | 1.3 × 10⁻¹ | 1.4 × 10⁻¹ | 23.0j | 14.7 | 0.83 |
| SF6 | 6.7 × 10⁻¹¹ | 6.7 × 10⁻¹¹ | 24.2j | <0.01 | |
| SO2 | 7.0 × 10⁻² | 4.6 × 10⁻¹ | 25.5g | 30.1 | 0.86 |
| m-dinitrobenzene | 2.6 × 10⁻² | 2.7 × 10⁻¹ | 38.3j | 26.6 | 0.87 |
| o-dinitrobenzene | 8.9 × 10⁻⁶ | 1.2 × 10⁻⁴ | 38.3j | 17.2 | 0.83 |
| S2Ol | 5.6 × 10⁻² | 3.5 × 10⁻¹ | 43.3g | 7.3 | 0.82 |
| SO3 | 2.0 × 10⁻¹⁰ | 6.9 × 10⁻⁸ | 43.8j | <0.01 | |
| p-dinitrobenzene | 1.6 × 10⁻¹ | 1.8 × 10⁻¹ | 46.1j | 16.4 | 0.88 |
| S3 | 8.2 × 10⁻² | 5.2 × 10⁻¹ | 48.3g | 7.0 | 0.71 |
| O3 | 4.8 × 10⁻² | 3.8 × 10⁻¹ | 48.5g | 4.8 | 0.95 |
| NO2• | 3.6 × 10⁻⁴ | 2.3 × 10⁻¹ | 52.4g | 8.5 | 0.16 |
| 1,3,5-trinitrobenzene | 6.1 × 10⁻¹ | 6.5 × 10⁻¹ | 60.6j | 7.9 | 0.47 |
| CO3 | 6.3 × 10⁻¹ | 9.0 × 10⁻¹ | 62.0g | <0.01 | |
| I• | N/A | N/A | 70.6j | <0.01 | |
| CH3COO• | 3.6 × 10⁻³ | 5.8 × 10⁻³ | 77.4g | <0.01 | |
| NO3• | 4.3 × 10⁻³ | 7.6 × 10⁻¹ | 90.8g | <0.01 | |
| [PDCH–F]• | 7.5 × 10⁻⁴ | 1.3 × 10⁻³ | 96.2i | <0.01 | |
| H2PO4 | 3.1 × 10⁻¹⁰ | 1.3 × 10⁻⁸ | 105.4j | <0.01 | |
| SF5• | 8.0 × 10⁻⁸ | 4.5 × 10⁻⁷ | 108.4m | <0.01 | |
| HSO4 | 4.3 × 10⁻³ | 4.9 × 10⁻² | 109.5j | <0.01 | |
| picric acid | 4.1 × 10⁻⁸ | 1.3 × 10⁻⁵ | 113.1h | <0.01 |
The numbers listed in this column correspond to Franck–Condon factors for transition from the ground vibrational state of the ground electronic state of the anion to the ground vibrational state of the ground electronic state of the neutral molecule.
This column represents a sum of Franck–Condon factors from the ground vibrational state of the anion to the 10 lowest vibrational states of the ground electronic state of the neutral.
See relation 16.
% ETD values were generally reproducible to within (20% of the reported value over the course of several months. Experiments with sulfur, however, showed significantly greater variation, possibly due to varying contributions from the isobaric S3−• and SO4−• ions arising from the glow discharge source.
Product–moment correlation coefficient determined from relation 17, where the y values were derived from an average spectrum (see text).
(M−H)− species.
Calculated values at the G3 level (see Experimental Section).
Calculated DFT value using the B3LYP exchange correlation functional.
Experimental value from a review of photoelectron experiments.50
Experimental value from NIST webbook.42
Both M−• and (M−H)− ions were noted in the negative ion spectrum.
An anion of m/z 80 was noted in the air-sustained glow discharge of sulfur vapor and is presumed to be predominantly S2O−•. The SO3−• ion is isobaric
and may contribute to the ion population. The Franck–Condon factors associated with this anion are extremely small, however.
Theoretical value from review of photoelectron experiments and theoretical calculations.50
Results and Discussion
Electron Transfer versus Proton Transfer
The energy surfaces of electron transfer and proton transfer reactions involve crossings of the electronic states associated with reactants, on one hand, and products on the other. Particularly in the case of ion/ion reactions, these crossings can occur at relatively large distances, compared with those associated with ion/molecule reactions, due to the long-range 1/r attractive potential associated with the entrance channel. For the purpose of this discussion, it is useful to consider the cross-sections for the various possible types of ion/ion reactions that can occur for a given reactant pair on the basis of the simple cross-section relationship
| (1) |
where P is the average probability that the reaction will occur at classical impact parameters, b, that bring the reactants to within a minimum reaction distance, rrxn, where the reaction can be, for example, proton transfer or electron transfer. In the case of ion/ion reactions involving relatively large multiply charged polyatomic ions, several impact parameters are relevant. These include the impact parameters for proton transfer, electron transfer, hard-sphere collision (i.e., where a relatively long-lived intimate collision complex is formed), and that for the formation of a stable electrostatically bound orbit. The latter impact parameter is significant because previous ion/ion kinetics studies involving multiply charged proteins in the ion trap environment suggest that the overall rate-determining step is the formation of an electrostatically bound pair.29 According to the classical three-body interaction (Thomson model30), the square of the impact parameter for formation of a bound orbit, borb2, is given by31
| (2) |
where Z1 and Z2 are the unit charges of the ions; e is the electron charge; υ is the relative velocity, and μ is the reduced mass. When e is in Coulombs, μ in kg, υ in m/s, and 1/(4πε0) in kg•m3•s−2•C−2, b is in units of meters. While it is recognized that this model is deficient in the sense that it makes some arbitrary assumptions that cannot be justified rigorously, it has the advantage of simplicity and agrees reasonably well with experimental results.31
Upon formation of a bound orbit, the oppositely charged ions can eventually come into close enough proximity for reaction by virtue of the degree of eccentricity of the orbit (e.g., high eccentricity orbits tend to bring the reactants into close enough proximity for a “chemical” collision) and by collapse of the orbit via either collisions or tidal effects.32 In general, the three key potential two-body interactions involve either proton transfer, electron transfer, or a collision in which the reactants can form a relatively long-lived complex. For the sake of simplicity, we will refer to a collision in which a long-lived complex is formed as a hard-sphere collision. The square of the impact parameter for a hard-sphere collision, bh−s2, is given by31
| (3) |
where rh−s represents the distance for a physical collision between the ionic partners. Similar expressions can be written for proton transfer and electron transfer by replacing rh−s with rPT and rET, respectively. That is, the square of the impact parameter for proton transfer, bPT2, is given by
| (4) |
and the square of the impact parameter for electron transfer, bET2, is given by
| (5) |
Proton transfer and electron transfer become possible when the energy surfaces of the reactants and products cross. Hence, rPT for ground state reactants and products can be estimated from
| (6) |
and rET can be estimated from
| (7) |
where the enthalpies of the proton transfer and electron transfer reactions are represented by ΔHPT and ΔHET, respectively. Note that relationships 3–7 are indicated as approximations because the oppositely charged ions are assumed to be point charges, which is not justifiable at close approach. However, in evaluating the relative degrees of proton transfer and electron transfer, it is likely that the three-dimensional structures of the ions would have similar effects on rPT and rET. In the case of proton transfer involving a multiply protonated peptide or protein, MHnn+, and a singly charged anion, A−
| (8) |
where PA(MH(n−1)(n−1)+) represents the proton affinity of MH(n−1)(n−1)+, and ΔHacid(AH) is the equivalent of the proton affinity of A− (PA(A−)). The heat of reaction for electron transfer for the same reactants is given by
| (9) |
where EA(A) represents the electron affinity of A, and RE-(MHnn+) represents the recombination energy of the cation. Note that the value of ΔHET is dependent upon the specific electronic states involved in the crossing at which the net electron transfer reaction takes place. The values reported here are based on the ground states of the reactants and products, but it is recognized that crossings involving excited states may play important roles.
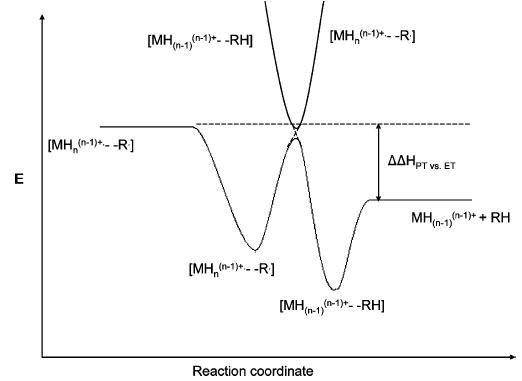
Figure 1 shows hypothetical potential energy curves for an ion/ion reaction involving a multiply protonated peptide or protein, MHnn+, and a singly charged anionic reagent, A−. The entrance channel is dominated by the long-range 1/r attractive potential, whereas the exit channels follow potentials associated with an ion/molecule reaction (i.e., shorter-range ion–dipole and ion-induced–dipole interactions) as the anionic reagent is neutralized. The points at which the entrance channel curve crosses the exit channels correspond to the equalities of eqs 6 and 7 for proton transfer and electron transfer, respectively. Crossings associated with excited states will occur at larger distances than those of the respective ground state crossings. Figure 2 shows representations of πr2 in a scattering reference system (i.e., scattering center of infinite mass and a scattering partner of reduced mass, μ), for the cases of capture into a bound orbit (dashed lines), electron transfer, proton transfer, and formation of a chemical complex (filled circle in the center). Note that the ion/ion orbits are elliptical in nature, and that the dashed line circle in Figure 2 represents the special case of an orbit with an eccentricity of zero. For orbits with high degrees of eccentricity, the distance between the ions varies significantly during the course of an orbit such that orbits with significant eccentricities can bring the reactants to within distances for chemical reaction. The dashed line circle is shown here simply to indicate that, based on studies made to date in the ion trap,9b,29 formation of a Coulomb bound orbit appears to be the overall ion/ion reaction rate-limiting step. The ion/ion reaction mechanism, however, is determined by factors that come into play at shorter interaction distances. The radii of the circles shown in Figure 2 are not necessarily drawn to scale, although the qualitative order of the magnitudes of these radii expected for many ion/ion reactant combinations is reflected.
Figure 1.
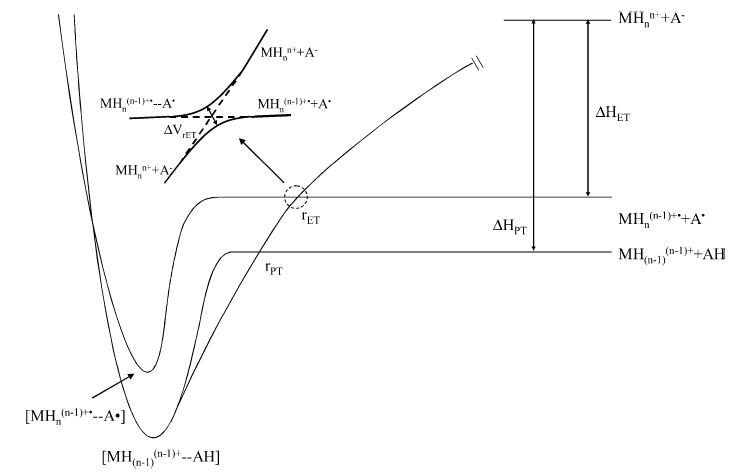
Hypothetical potential energy curves for an ion/ion reaction involving a multiply protonated peptide or protein, MHnn+, and a singly charged anionic reagent, A−.
Figure 2.
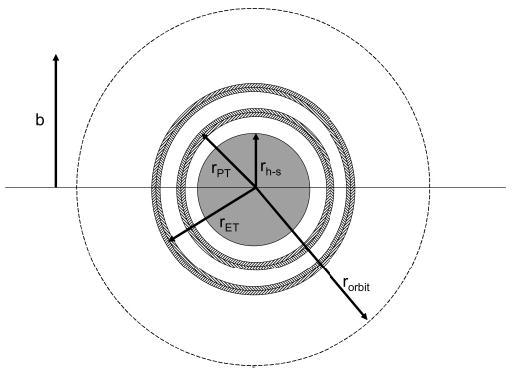
Representations of πr2 for the cases of capture into a bound orbit (rorbit, dashed lines), electron transfer (rET), proton transfer (rPT), and formation of a chemical complex (rh−s, filled circle in the center) in a reference system in which the scattering center is of infinite mass, and the scattering partner of reduced mass, μ, is that of the ion/ion reactant pair.
An alternative to electron transfer taking place at a distant crossing is a crossing of potential curves within the chemical complex, as represented by the point at which the two curves meet on the repulsive part of the potential. The crossing point location is arbitrary. However, if the intermediate for electron transfer [MHn(n−1)+••••A•], can readily isomerize to the intermediate for proton transfer, [MH(n−1)(n−1)+•••HA], dissociation of the long-lived intermediate comprised of the cation and anion would be expected to yield proton transfer products. This is due to the fact that proton transfer is highly favored thermodynamically for most polypeptide cation/anion combinations (vide infra).
The key to determining if electron transfer is a significant mechanism is likely to be found in the factors that determine the probability term in eq 1 for electron transfer, Prxn = PET. Electron transfer reactions at points at which the entrance and exit channel energies are equal are usually treated in terms of Landau–Zener theory33 for “avoided crossings”. That is, the diabatic states cross (see dashed lines in insert of Figure 1), while the adiabatic states (see solid curves in insert of Figure 1) do not. This theory expresses the probability for transitions between adiabatic surfaces at the crossing, where the adiabatic curves are at their closest approach as
| (10) |
where PLZ represents the so-called Landau–Zener probability for transition between adiabatic states at the avoided crossing; ΔVrET is the shortest distance between the adiabatic curves (solid lines in insert of Figure 1) at the avoided crossing, dr/dt is the radial velocity at this point, ℏ is Planck’s constant, and |dVI/dr − dVF/dr| is the difference in the slopes of the reactant and product ion channels at the avoided crossing. The energy gap between the adiabatic curves, ΔVrET, at its minimum point is given by 2H12, where H12 is the coupling matrix element that indicates the strength of electronic coupling between adiabatic states. For curve crossing transitions involving atomic collisions and some involving small molecule systems, the H12 term has been estimated with relationships of the form
| (11) |
where A and a are constants, or where A is a factor with an r dependence.34 Such a dependence of H12 upon r when applied to eq 10 predicts a sigmoidal dependence of PLZ upon r, with PLZ approaching zero at small r and unity at large r. As two crossings take place in the course of an electron transfer reaction at long range, a successful electron transfer must involve one diabatic crossing, given by PLZ, and one adiabatic crossing, given by (1 − PLZ). Since there are two ways that this can happen (i.e., curve crossing on the incoming trajectory and avoided crossing on the outgoing trajectory, and vice versa), the total probability for electron transfer, PET, is given by
| (12) |
The maximum likelihood for electron transfer, therefore, is expected to be at PLZ values of roughly 0.5, according to this model. All electron transfer models based on Landau–Zener theory, therefore, predict a more or less broad maximum in PET as a function of rET. In the case of molecular systems, the transition probabilities between the vibrational states of the reactants and products play an important role in determining the behavior of the system at a curve crossing. To accommodate these transition probabilities, eq 10 is modified by including the relevant Franck–Condon factors.35
| (13) |
where 〈χ1υ′|χ2υ″〉2 represents the Franck–Condon overlap between reactant and product vibrational wave functions associated with the transition from 1υ′ to 2υ″. Equation 13 implies that, in the absence of significant Franck–Condon overlap at the crossing point, PLZ will tend to be large, resulting in a low overall PET. Hence, both electronic coupling between the adiabatic states and Franck–Condon overlap at the crossing point are important criteria in determining the likelihood for electron transfer at a distant crossing point for molecular ions.36
Of all parameters relevant to Landau–Zener theory, H12(r) is the most difficult to evaluate, even for atomic and small molecular systems. However, an approximate model can at least provide some insights into the qualitative effects of experimental variables on PET. Olson et al.37 published a parametrized coupling matrix element, H12, for use in eq 11, given by:
| (14) |
where all parameters are in atomic units. Further approximations, which are also expected to apply to the ion/ion reaction case discussed here, were also made to simplify evaluation of the exponential term in eq 10 to give
| (15) |
The probability for electron transfer (eq 12) can be estimated using relations 14 and 15 with the input of the reactant ion masses and charges, cation recombination energy, anion electron affinity, and a value for the relevant Franck–Condon factor (atomic units). Figure 3 shows the predicted electron transfer probability as a function of the electron affinity of the species that forms the reagent anion for a cation mass of 1000 Da, anion mass of 100, cation charge of +1, anion charge of −1, a cation recombination energy of 4.02 eV (vide infra), and a Franck–Condon overlap of 1.0.
Figure 3.
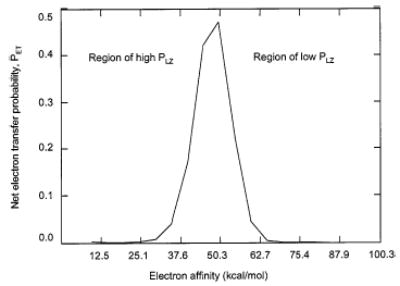
Electron transfer probability versus electron affinity as determined using the approximations given in relations 14 and 15.
A maximum in the probability for electron transfer is found over a finite range of anion electron affinity. At low electron affinity, the overall probability is low because PLZ is high, whereas at high electron affinity, the overall probability is low because PLZ is low. The model indicates that as the recombination energy of the cation increases, the maximum in the electron transfer probability shifts to higher values of electron affinity, whereas as the cation charge increases, the maximum shifts to lower electron affinities. These tendencies are significant because, in general, as cation charge increases, the recombination energy of the cation also increases. These tendencies have opposing effects on the position of the electron transfer probability. For cations and anions of mass greater than about 100, the masses of the ions have only a small effect on the position of the electron transfer probability maximum. This model predicts that the maximum electron transfer probability changes little when the relevant Franck–Condon factor decreases from 1.0 to 0.1, although the position of the maximum shifts to lower electron affinities. However, a nearly order of magnitude decrease in probability accompanies a change in Franck–Condon factor from 0.1 to 0.01. Further order of magnitude decreases in Franck–Condon factor result in order of magnitude decreases in maximum electron transfer probability. This is a significant result in that it predicts electron transfer probability to be relatively insensitive to Franck–Condon overlap from 1 to 0.1 for a given transition, provided the electron affinity of the reagent species falls within the region of high probability. However, Franck–Condon factors significantly less than about 0.1, on the other hand, lead to substantially lower electron transfer probabilities.
The probability for proton transfer at the relevant crossing point can also be described in the context of Landau–Zener theory with the appropriate parameters used in relation 10. Proton transfer can also take place via a long-lived chemical complex, and for most reactant pairs, this reaction is likely to be favored on thermodynamic grounds if the reactant ions come into contact without already having transferred an electron or proton at a crossing point. Hence, given that the electron transfer crossing point is, in most cases, reached first and that proton transfer reactions are expected to take place at closer approaches, it is the likelihood for electron transfer at the crossing point that is expected to be the major factor in determining the extent of electron transfer.
Reagent Anions and Reactions with [KGAILKGAILR + 3H]3+
Given that we are primarily interested in the characteristics of the anion that lead to either electron transfer or proton transfer with protonated polypeptides, we have chosen to examine properties of the anion that might be expected to affect the transition between surfaces. Specifically, we have examined the electron affinity of A and the Franck–Condon factors for transition from the populated states of the anion, A−, to the ground state of the neutral as well as to higher vibrational states of A. Values for ΔHPT and ΔHET have been calculated both at the G2 and G3 levels for several anionic reactants, some of which are known to react, at least partly, via electron transfer, as well as several known to react essentially exclusively via proton transfer (see Table 1 for a summary of selected cases based on G3 calculations). Protonated guanidine and protonated glycine were used as models for cationic charge sites in polypeptide cations. Protonated guanidine serves as a model for protonated arginine, and protonated glycine serves as a model for a protonated N-terminus. While the actual proton affinities and recombination energies associated with charge sites in multiply charged polypeptides are expected to vary with charge site, degree of intramolecular solvation, and Coulombic repulsion within the ion, the values calculated here are expected to be fairly representative of commonly encountered cases. They are consistent with the 4–7 eV range of values obtained via thermodynamic cycles.38 Adiabatic recombination energies and electron affinities were used here for the determination of the enthalpy of the electron transfer reaction, rather than vertical values. Relatively little likelihood for error in determining the relative exothermicities of proton transfer and electron transfer is expected by using this approximation given the large differences found in most cases (see Table 1). The assumption is also made that electron transfer occurs to a protonated site. Recent studies have indicated that the presence of a nearby positive charge can lead to positive electron affinities for amide groups39 and disulfide linkages.40 The implication for this possibility on reaction exothermicity is that the process would be less exothermic than transfer to the protonation site. This represents the crossing of curves at higher energy states leading to larger crossing distances.
Table 1.
Summary of Selected Cases Based on G3 Calculations
| PA (kcal/mol) | EA (kcal/mol) | ΔHrxn by PT1/PT2b (kcal/mol) | ΔHrxn by ET1/ET2b (kcal/mol) | relative exothermicityb ΔHPT − ΔHET (kcal/mol) | |
|---|---|---|---|---|---|
| guanidine(+) | 237.7 (neutral) | 92.8 (cation) | |||
| glycine (+) | 204.3 (neutral) | 122.6 (cation) | |||
| SO2−• | 327.2 (A−) | 27.2 (A) | −89.5/−122.9 | −65.6/−95.4 | −23.9/−27.5 |
| O3−• | 342.4 (A−) | 49.7 (A) | −104.7/−138.1 | −43.1/−72.9 | −61.6/−65.2 |
| S3−• | 315.9 (A−) | 55.1 (A) | −78.2/−111.6 | −37.7/−67.5 | −40.5/−44.1 |
| phNNph−•a | 348.8 (A−) | 13.1 (A) | −111.1/−144.5 | −79.7/−109.5 | −31.4/−35 |
| SF6−• | 345.1 (A−) | 29.2 (A) | −107.4/−140.8 | −63.6/−93.4 | −44/−47.4 |
| CH3COO− | 345.9 (A−) | 77.4 (A) | −108.2/−141.6 | −15.5/−45.2 | −92.8/−96.4 |
| I−c | 314.3 (A−) | 70.6 (A) | −76.6/−110.0 | −22.2/−52.0 | −54.4/−58.0 |
| CS2−• | 317.6 (A−) | 11.8c (A) | −79.9/−113.3 | −81.0/−110.8 | +1.1/−2.5 |
On the basis of the enthalpies associated with ground state reactants and products, it is clear that both electron transfer and proton transfer are exothermic for every cation/anion combination in Table 1. With the exception of carbon disulfide as anionic reagent, proton transfer is much more exothermic than electron transfer for each case, although the difference, ΔHPT − ΔHET, varies widely with anion identity. On the other hand, the enthalpy difference is relatively insensitive to identity of the model cation.
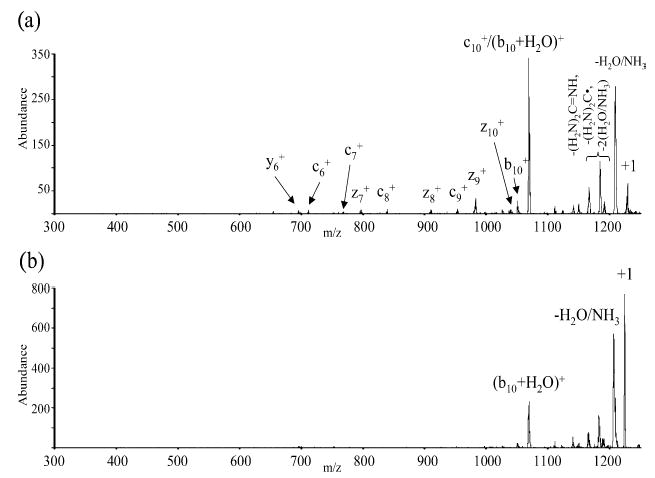
The clear signature for the occurrence of electron transfer to a multiply protonated polypeptide ion is the appearance of c-and z-type fragments, in direct analogy to those observed in ECD.1 Ion/ion proton transfer reactions generally do not lead to fragmentation of polypeptide ions.7 The typically observed b- and y-type ions formed from fragmentation of closed-shell polypeptide ions can be observed at relatively low levels due to a small degree of collision-induced dissociation of residual multiply charged parent ions upon mass-selective ejection from the ion trap.4c An example is given in Figure 4 with the comparison of the post-ion/ion reaction spectra derived from the reaction of the triply protonated peptide KGAILKGAILR with the molecular anions of azobenzene and carbon disulfide.
Figure 4.
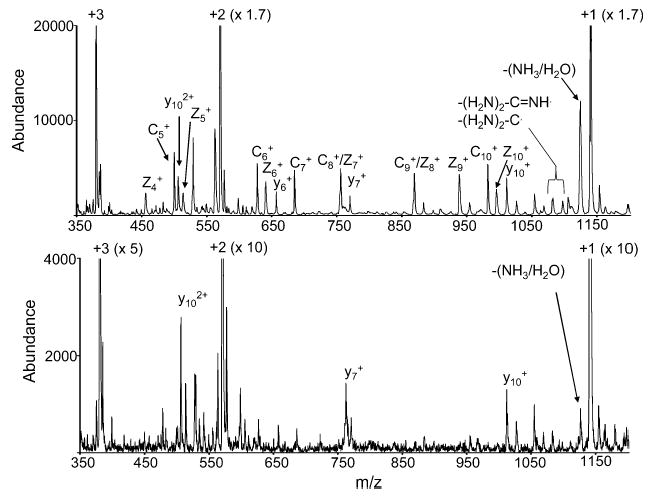
Post ion/ion reaction spectra of KGAILKGAILR [M + 3H]3+ and (a) the azobenzene molecular anion and (b) CS2−•.
Figure 4a, which displays the results from the azobenzene anion reaction, shows the c5–c10 product ions as well as the z4–z10 products. Loss of fragments from the arginine side chain, which has been noted in ECD43 and for ETD4c with SO2−•, is also observed. Several y-type ions are also observed to contribute. In the case of the reaction with the carbon disulfide anions, the c- and z-type fragments are missing, while a few y-type ions are observed. These ions arise from fragmentation of the residual doubly protonated ions upon their resonance ejection from the ion trap because they are not observed when the residual doubly charged ions are ejected from the ion trap prior to mass analysis. This is demonstrated in Figure 5 for reactions of the triply protonated peptide KGAILKGAILR cation with nitrobenzene anions, the molecular anion of SF6, the iodide ion, and the anion derived from fluorine loss from the molecular anion of perfluoro-1,3-dimethyl cyclohexane (PDCH–F)−. The latter ion has been used extensively for manipulation of peptide and protein cation charge via proton transfer. These data were collected after ejection of all ions of m/z ratio less than or equal to that of the residual doubly charged ions. This process removes most residual multiply charged ions prior to mass analysis.
Figure 5.
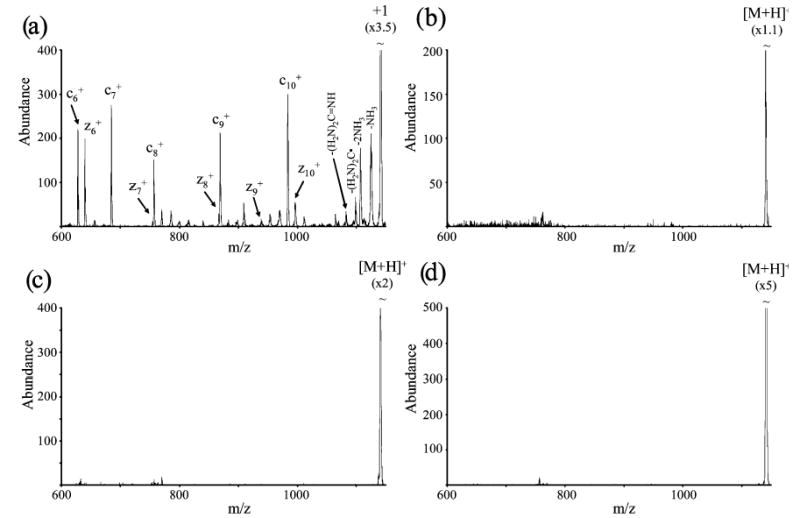
Post ion/ion reaction spectra of KGAILKGAILR [M + 3H]3+ and (a) nitrobenzene (both (M−H)− and M−• anions were present), (b) SF6−•, (c) I−, and (d) PDCH [M−F]− obtained after removal of residual multiply charged parent ions.
Most of the data collected for this study were not obtained in the manner used to collect data in Figure 5 because this process also removes c- and z-type products of m/z less than that of the residual doubly charged parent ions.
The assessment that electron transfer to the peptide cation occurs is based upon the appearance of ETD products. Unfortunately, however, it is difficult to make an accurate quantitative assessment of the relative contributions of proton transfer and electron transfer for several reasons. Scheme 1 indicates the possible fates for the peptide ion as a result of an ion/ion reaction in which proton transfer and electron transfer compete.
Scheme 1.
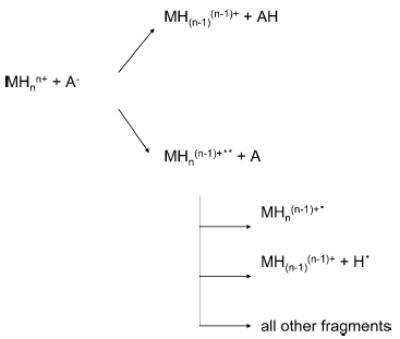
It has been noted that some peptide cations undergo electron transfer but do not necessarily dissociate as a result.4 This channel is represented in Scheme 1 by the formation of a “stable” MHn(n−1)+• ion. If analogies hold between electron transfer and some mechanisms put forward for electron capture,44 backbone bonds in the electron transfer product may actually be cleaved, but noncovalent interactions are sufficiently strong to prevent the fragments from separating. Regardless of the bonding and structure of the product, a fraction of the ions nominally survive the electron transfer process. The resolving power of the instrument used in these studies is not sufficiently high to separate the surviving electron transfer products from proton transfer products (e.g., MHn(n−1)+• versus MH(n−1)(n−1)+). The presence of such products is apparent; however, from collisional activation of the intact peptide ion population derived from electron/proton transfer, c- and z-type products are observed.4b,c No such products are observed from ion/ion reaction products formed from species known to react exclusively via proton transfer, such as anions derived from perfluorocarbons7 (see also the data and discussion below regarding Figure 7). A more problematic complication, because it cannot be ameliorated by use of a higher resolving power mass analyzer, is the potential for hydrogen atom loss from the initially formed MHn(n−1)+•* ion. This reaction channel has been noted for ECD.45 An electron transfer reaction followed by dissociation via hydrogen atom loss cannot be distinguished from a proton transfer reaction. Hence, this reaction channel, if significant, leads to an underestimation of the extent to which electron transfer competes with proton transfer. In this work, we report the percentage of post-ion/ion reaction ion signal attributable to ETD (i.e., total ion signal due to signals that correspond to expected ETD products divided by the summation of all ion signals other than residual peptide cation reactant multiplied by 100), i.e.
Figure 7.
(a) CID spectrum of +1 guanidinated KGAILKGAILR from reaction of [M + 3H]3+ with SO2−•. (b) CID of [M + H]+ guanidinated KGAILKGAILR from proton transfer of [M + 3H]3+ with PDCH anions.
| (16) |
as a relative measure of electron transfer versus proton transfer for a given polypeptide ion versus a variety of anions. It should be recognized that this underestimates electron transfer because it does not account for a fraction of the initially formed electron transfer peptide ion products that survive and does not account for the hydrogen loss ETD channel. To the extent that these two processes differ for different electron transfer reagents, and there are data that show variation with anion reagent,4b the relative extents of electron transfer versus proton transfer judged by this measure could lead to inaccurate relative rankings in some cases. However, all of the reagents that undergo electron transfer appear to give rise to a measurable extent of ETD with the triply protonated peptide used in this study. This conclusion is based upon the observation that collisional activation of the undissociated ion/ion reaction products yielded only b- and y-type products for the anions that yield no expected ETD fragments directly in the ion/ion reaction. Hence, the % ETD measure used here is useful in assessing whether electron transfer is a competitive process.
Of the species in Table 1, O3−•, SO2−•, S3−•, and the azobenzene anion (C6H5NNC6H5−•) have all been observed to lead to the formation of ETD products in reactions with multiply protonated peptides (see Figure 4a for results for C6H5NNC6H5−•), whereas the SF6−•, I−, CS2−•, and anions comprised of carboxylate functionalities7 are known to react exclusively via proton transfer (see Figure 5b for SF6−•, Figure 5c for I− data, and Figure 4b for CS2−• data). For the species listed in Table 1, both electron transfer and proton transfer are exothermic for all reagent anions with each model cation. Furthermore, with the exception of CS2, proton transfer is much more exothermic than electron transfer. This is expected to be generally the case for an ion/ion reaction involving a multiply protonated peptide or protein due to the low recombination energy values of the closed-shell protonated peptides compared to, for example, those of radical cations derived from organic molecules. Hence, for the majority of anions in reaction with protonated peptides, πrET2 exceeds πrPT2 when the radii are determined from eqs 6 and 7. Thus, if the probability of electron transfer is high at the crossing point, an anion would be expected to give rise to a significant extent of electron transfer. Since the electron transfer crossing point is reached first, the factors that determine the probability of electron transfer at the crossing point are expected to determine the extent to which electron transfer is observed. In the case of CS2, the crossing points for proton transfer and electron transfer are expected to be very close to one another. Even in this case, the likelihood for electron transfer at the crossing point might be expected to play a role in determining the extent to which electron transfer is observed.
The model discussed above suggests that, for a given polypeptide anion, two criteria must be met for significant electron transfer probability: (i) the electron affinity of the anion should place the crossing point in a region favorable for net electron transfer (e.g., as determined by relation 10); and (ii) in the case of molecular anions, favorable Franck–Condon factors associated with the electronic transitions should be present (as reflected in the modification of relation 10 to lead to relation 11). Several ions with relatively low electron affinity have been shown to give rise to relatively efficient electron transfer. The results of Figure 3, however, suggest that there might be cases where the electron affinity of the ion can be either too low or too high. Figure 3 reflects only the probability for a single transition with a Franck–Condon overlap of 1.0 and assumes a ΔHET corresponding to formation of ground state products. For reagents with low electron affinities, transitions to higher energy states of the products with favorable Franck–Condon overlap may be accessible, and these crossing points could fall in the range of crossing points with favorable PET. On the other hand, no other states below the ground states can be present. Hence, species with electron affinities on the high side in Figure 3, which are those with crossing points too distant for high probability, can only give crossing points associated with excited states that are even more distant. Therefore, it is likely that a reagent species can have an electron affinity that is too high for electron transfer, despite an exothermic reaction, but it is less likely that reagents can have electron affinities that are too low.
Table 2 lists Franck–Condon factors associated with the reagent anion involving the ground electronic states of the anion and neutral, electron affinities of the reagents, and % ETD efficiencies for a variety of anion reactants for which ion/ion reactions have been performed. Franck–Condon factors are listed for the transition between the ground vibrational states of the ground electronic states of the anion and neutral (〈0|0〉2) and for the sum of the Franck–Condon factors for transition from the ground vibrational state of the ground electronic state of the anion, which is expected to be the most heavily populated state under these experimental conditions, to the 10 lowest energy vibrational states of the electronic ground state of the neutral species (∑ 〈0|≤10〉2). The latter values account, in part, for the possibility for formation of the neutral reagent in vibrationally excited states and may be a better measure of the relative probability for a transition than the value for the 0–0 transition alone. In either case, the results appear to be consistent with the criteria described above for electron transfer. No reagent with an electron affinity greater than or equal to 62.0 kcal/mol shows a measurable tendency for electron transfer, regardless of the Franck–Condon factors. The nitrate and carbonate anions, for example, might be expected to transfer an electron based on their Franck–Condon factors because they are as high as many of the species for which ETD is observed. However, neither shows such a tendency, presumably due to the high electron affinities associated with these reagents. Furthermore, I− has no measurable propensity for ETD, but there appears to be no reason the I− → I• transition should be disfavored, as it is found to be a facile transition in negative ion photoelectron spectroscopy.46 The electron affinity of I• is relatively high, possibly too high for efficient electron transfer. (The Landau–Zener model, with Olson’s parameter’s for the estimation of H12, predicts very poor electron transfer probability for species with electron affinities of roughly 70 kcal/mol or greater for virtually any set of parameters that can be expected to apply to a reaction with a multiply protonated peptide.) It is probably also noteworthy that anions with carboxylate, sulfate, and phosphate functionalities have not shown any tendency for ETD. The electron affinities for the radicals associated with these functionalities are consistent with this observation because they are all significantly greater than 70 kcal/mol.
Several of the species that give rise to relatively efficient ETD are associated with reagents with relatively low electron affinities, such as azobenzene, fluoranthene, and perylene. As discussed above, a low electron affinity by itself need not result in poor electron transfer probability due to the possibility for crossings between higher energy states. However, it might be significant that the % ETD values for norbornodiene and deprotonated cis-stilbene are relatively low. The electron affinities associated with these reagents are the two lowest in Table 2. In any case, it is not as clear from the data of Table 2 that a low reagent electron affinity adversely affects the probability of electron transfer as much as a very high electron affinity does.
Table 2 also shows that favorable Franck–Condon overlap is an important criterion for reagents with electron affinities that are not too high. For example, the three species with electron affinities less than 60 kcal/mol that show essentially no electron transfer (CS2, SF6, and SO3) all have very low Franck–Condon overlap. Those of SF6 and SO3 are especially low. The Franck–Condon overlap associated with CS2 is significantly lower than those of the reagents that show measurable electron transfer, but the fact that the crossing points for proton transfer and electron transfer are expected to be close to one another (see Table 1) may also play a role in the lack of electron transfer associated with CS2−•. Perfluorocarbon anions and SF6−• are known to be relatively resistant to electron transfer in ion/molecule reactions, which has been attributed to relatively large geometry changes in going from the anion to the neutral.47 While a large electron affinity alone can account for the poor electron transfer reactivity for the perfluorocarbon species [PDCH–F]− (see Table 2), poor Franck–Condon overlap is likely to account for the poor electron transfer reactivities of SF6−• and SO3−•, as the electron affinities of SF6 and SO3 fall well within the range for which electron transfer is observed. Perhaps the most notable exceptional case is that of o-dinitrobenzene, which shows relatively poor Franck–Condon overlap for the listed transitions (although they are significantly higher than those associated with CS2, SF6, and SO3). Unfortunately, there may be ambiguity in the experimental data in that it was not possible to confirm that the reactant anion was purely the isomer of interest. In any case, the overall trends in the data suggest that, at least for most anions, two major criteria apply for efficient electron transfer: (i) favorable vertical transition probabilities and (ii) an electron affinity associated with the neutral that is not too high. In those rare cases in which the crossing points for electron transfer are near to or within the proton transfer crossing point, the likelihood for proton transfer at the crossing point is expected to become a much more important consideration in determining the likelihood for electron transfer.
The final column of Table 2 provides an indication of the similarities of the ETD spectra obtained using the various reagents, in terms of the identities and relative abundances of the c- and z-type product ions. To provide a quantitative measure of spectral similarity, the product–moment correlation coefficient, R, given by48
| (17) |
has been determined, where x and y are the sets of relative abundances of the sequence c- and z-type ions from the two spectra being compared. This statistic has previously been used by Budnik et al. to assess similarity of fragmentation patterns between spectra derived from ECD and CID.49 The spectrum acquired for each reagent was compared to a spectrum created by averaging across all of the reactants that produced good signal/noise ratio ETD data with good % ETD reproducibility (i.e., O3, S2O, SO2, norbornodiene, cis-stilbene, azobenzene, fluoranthene, perylene, o-dinitrobenzene, m-dinitrobenzene, p-dinitrobenzene, nitrobenzene, and 1,3,5-trinitrobenzene). The average spectrum was used to supply the y values in the equation for R. The R values obtained for each reagent are reported in Table 2. For the most part, R values of 0.8 or above were obtained. Exceptions are noted for species with relatively low % ETD values (e.g., norbornodiene, cis-stilbene, and 1,3,5-trinitrobenzene). The eight reagents with efficiency values greater than 10% have an average correlation of 0.88. As a reference, repeated spectra taken on the same day, with the same reagent, typically have an R value of 0.9, while spectra for the same reagent, taken several months apart, have yielded R values of around 0.8. The generally high degrees of similarity between spectra acquired with different reagents, despite the fact that they represent a range in electron affinity that spans roughly 35 kcal/mol, is noteworthy. The correlation values as a whole suggest that the relative abundances of the different sequence ions are rather insensitive to overall electron transfer reaction exothermicity, at least over the range of energies accessed here.
Adduct Formation in Conjunction with Electron Transfer
Electron transfer is expected to compete favorably with proton transfer when the probability for an electron hop at the long-range crossing point is high. Furthermore, as indicated above, πrET2 generally exceeds πrPT2 for protonated polypeptides. A significant fraction of species that undergo electron transfer, however, will subsequently undergo a hard-sphere collision. It is known that chemical complexes are formed for a significant fraction of proton transfer ion/ion reactions involving peptides and proteins.51 For example, anion attachment to protonated polypeptides is often observed when there is a relatively strong dipole–dipole interaction between the proton transfer sites. Furthermore, charge inversion reactions involving multiple proton transfers, which are unlikely to occur via curve crossings at long distances, have also been reported.10a,d,e On the basis of the situation depicted in Figure 2, it is clear why it might be expected that a sizable fraction of proton transfer reactions could involve the formation of a chemical complex because bPT and bh−s are expected to be close to one another. In fact, cases can be envisioned in which bh−s exceeds the impact parameter for a “long-range” proton transfer. The alternative possibility for electron transfer taking place via a long-lived chemical complex is not precluded. However, the presence of much more thermodynamically favored proton transfer pathways would lessen the likelihood for the observation of electron transfer upon break-up of the complex. Nevertheless, a fraction of the reactants that undergo an electron transfer at a distant crossing will also subsequently undergo a hard-sphere collision. Provided the interaction between the products is sufficiently strong, a complex of the form [MHn(n−1)+••••A•], which is isomeric with [MH(n−1)(n−1)+•••HA], might be observed. In principle, it could be formed via the collision of the electron transfer products, as mentioned above, or it could be formed via isomerization of [M(n−1)(n−1)+•••HA]]. Relatively little adduct formation was noted in the reactions of triply or doubly protonated KGAILKGAILR with the anions of this study. However, relatively abundant adduct products were observed in the reactions of SO2−• with triply and doubly protonated guanidinated KGAILKGAILR.4c When this adduct ion was subjected to isolation and collisional activation, the spectrum of Figure 6a was obtained.
Figure 6.
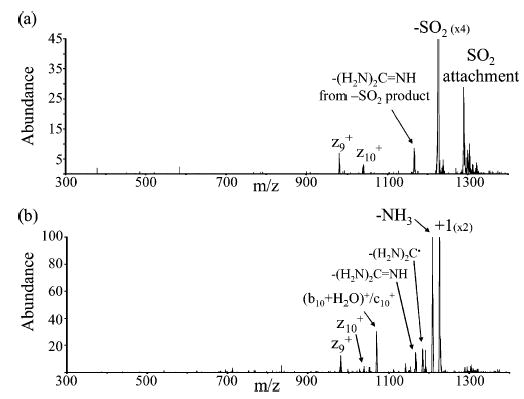
(a) CID spectrum of SO2 attachment to guanidinated KGAILKGAILR. (b) CID spectrum of SO2 loss peak in (a).
The major product corresponds to the loss of SO2 and/or HSO2•. The next three most abundant products all correspond to those expected from electron transfer, such as two z-type ions and a neutral loss from an arginine or homoarginine residue that is commonly observed with ETD and ECD. Figure 6b shows the results of an MS4 experiment in which the ions formed by SO2/HSO2• loss were isolated and subjected to collisional activation. This spectrum shows the same products noted in Figure 6a as well as a few additional products that are known to arise from MH+ ions (see below). Collision-induced dissociation data for the singly charged guanidinated KGAILK-GAILR ions formed from triply protonated ions via reaction with SO2−• anions (Figure 7a), for which electron transfer and proton transfer are competing processes, and from exclusive proton transfer using perfluorocarbon anions as reagents (Figure 7b) are compared in Figure 7.
Examination of Figures 6 and 7 leads to the conclusion that the SO2 adduct species is likely to be comprised, at least in part, of the [MH2+••••SO2] species and that upon collisional activation, MH2+• ions are formed. Adduct ions of the form [MH+•••HSO2•] are expected to dissociate by HSO2• loss to yield MH+ ions. Figure 7b shows that loss of either water or ammonia (or both) and cleavage to give the (b10 + H2O)+ ion lead to the major MH+ product ions. The (b10 + H2O)+ ion and the c10+ ion cannot be distinguished. Therefore, the appearance of product ions known to arise from the MH+ ion in the data of Figures 6b and 7a, along with product ions expected to arise from MH2+•, suggests that the singly charged ions subjected to collision-induced dissociation were comprised of both types of parent ions.
The data of Figures 6 and 7 are consistent with the potential energy curves of Figure 1, which show a crossing within the chemical complex. A common way to illustrate a situation of this type is to plot potential energy versus reaction coordinate, as in Figure 8.
Figure 8.
Energy diagram representing the barrier to isomerization for the chemical complexes that lead either to electron transfer or proton transfer products.
The energy positions of the exit and entrance channels and that of the crossing are arbitrary in this figure. The key result is that there appears to be a barrier, either energetic, kinetic, or both, to isomerization of the adduct between structures best represented as [MH2+••••SO2] and those best represented as [MH+•••HSO2•]. The barrier is represented in Figure 8 as involving a curve crossing. However, the ions represented as [MH2+••••SO2] may also include species in which covalent bonds in the polypeptide are already cleaved but the products remain associated, as has been hypothesized in ECD. Nevertheless, the experiment leading to Figure 6a indicates that loss of SO2 is more facile than separation of polypeptide fragments by virtue of the absence of any expected ETD fragments associated with a molecule of SO2. A plausible overall scenario for the formation of the adduct ions of the form [MH2+••••SO2] is that they arise from the fraction of electron transfer collisions that occur within the impact parameter for a hard-sphere collision and from the fraction of such collisions that result in the survival of the chemical complex.
Conclusions
Proton transfer from or electron transfer to gaseous multiply protonated peptides are exothermic reactions for what is likely to be a large majority of readily formed gaseous anions. Proton transfer is usually thermodynamically favored, and when this is the case, electron transfer should be kinetically favored (provided it is exothermic) based on the locations of crossing points at which electron transfer and proton transfer occur. The observance of electron transfer, therefore, is expected to be largely determined by factors that govern the probability for net electron transfer at the electron transfer curve crossing. Viewed within the context of Landau–Zener theory, there are both energetic and geometric criteria that should be met for the observation of significant electron transfer when polyatomic anions are involved. Given that the cation is defined as a multiply charged peptide or protein, it is the characteristics of the anion that determine if electron transfer or proton transfer dominate. The data and the curve crossing model suggest that high reagent electron affinities, roughly 60–70 kcal/mol or greater, likely place the electron transfer crossing point too distant for efficient reaction. However, there is only suggestive experimental evidence that the reagent electron affinity can be too low. A model that assumes only single states for the reactants and products would predict the possibility for a reagent with an electron affinity that is too low. However, when the possibility for participation of higher energy states is considered, the electron affinity criterion is relaxed for low electron affinities. The data and the model also suggest that the geometric criterion, as reflected in Franck–Condon overlap between the reactant anion and its neutral products, is very important. For the most part, Franck–Condon factors associated with the ground electronic states of the reactant anion and its neutral appear to provide at least qualitative guidance regarding the likelihood for electron transfer when the electron affinity of the reagent is not too high.
The apparent similarity of ECD and ETD data is consistent with electron transfer taking place largely at a distant crossing point. In this process, the cation does not interact chemically with the reagent species and simply captures its excess electron. In the case of electron transfer from an anion, less energy is available to populate excited states of the cation than with the capture of a free electron. The reaction exothermicity is smaller in the case of ion/ion reactions, and some of the reaction exothermicity can be partitioned into translation of the products, which is not the case for electron capture. The significance of this difference may become clearer as more comparative ETD and ECD data are collected. A unique characteristic of ion/ion reactions is the possibility for the formation of a chemical complex, either after an electron transfer or proton transfer at a distant crossing point or directly from the oppositely charged ions. At least in some ion/ion combinations, intimate collisions can take place with a significant number of encounters. In some cases, such chemical complexes have been observed with reactants known to undergo electron transfer reactions. Complete isomerization to the thermodynamically favored proton transfer intermediate is not observed. This observation suggests the possibility that novel chemistries within these chemical complexes might be observed that cannot result from electron capture alone.
Acknowledgments
The authors acknowledge support from the Office of Basic Energy Sciences, Division of Chemical Sciences under Award No. DE-FG02-00ER15105, and the National Institutes of Health under Grant GM 45372. Dr. Tim Zwier is acknowledged for making available the software for calculation of Franck–Condon factors, and Dr. Jaime Stearns is acknowledged for generously providing her expert help with this software. Ms. Jei Li of Wayne State University and Mr. Bryan Putnam of Purdue’s IT Discovery Resource are acknowledged for technical assistance with the computations.
Footnotes
Supporting Information Available: Complete ref 22. This material is available free of charge via the Internet at http://pubs.acs.org.
References
- 1.a Zubarev RA, Kelleher NL, McLafferty FW. J Am Chem Soc. 1998;120:3265–3266. [Google Scholar]; b Zubarev RA, Horn DM, Fridricksson EK, Kelleher NL, Kruger NA, Lewis MA, Carpenter BA, McLafferty FW. Anal Chem. 2000;72:563–573. doi: 10.1021/ac990811p. [DOI] [PubMed] [Google Scholar]; c Zubarev RA. Mass Spectrom Rev. 2003;22:57–77. doi: 10.1002/mas.10042. [DOI] [PubMed] [Google Scholar]; d Zubarev RA, Haselmann BB, Kjeldsen F, Jensen F. Eur J Mass Spectrom. 2002;8:337–349. [Google Scholar]
- 2.a Zubarev RA, Kruger NA, Fridriksson EK, Lewis MA, Horn DM, Carpenter BK, McLafferty FW. J Am Chem Soc. 1999;121:2857–2862. [Google Scholar]; b Kelleher NL, Zubarev RA, Bush K, Furie B, Furie BC, McLafferty FW, Walsh CT. Anal Chem. 1999;71:4250–4253. doi: 10.1021/ac990684x. [DOI] [PubMed] [Google Scholar]; c Mirgorodskaya E, Roepstorff P, Zubarev RA. Anal Chem. 1999;71:4431–4436. doi: 10.1021/ac990578v. [DOI] [PubMed] [Google Scholar]; d Horn DM, Breuker K, Frank AJ, McLafferty FW. J Am Chem Soc. 2001;123:9792–9799. doi: 10.1021/ja003143u. [DOI] [PubMed] [Google Scholar]; e Håkansson K, Cooper HJ, Emmett MR, Costello CE, Marshall AG, Nilsson CL. Anal Chem. 2001;73:4530–4536. doi: 10.1021/ac0103470. [DOI] [PubMed] [Google Scholar]; f Sze SK, Ge Y, Oh H, McLafferty FW. Proc Natl Acad Sci USA. 2002;99:1774–1779. doi: 10.1073/pnas.251691898. [DOI] [PMC free article] [PubMed] [Google Scholar]; g Shi SDH, Hemling ME, Carr SA, Horn DM, Lindh I, McLafferty FW. Anal Chem. 2001;73:19–22. doi: 10.1021/ac000703z. [DOI] [PubMed] [Google Scholar]; h Håkansson K, Chalmers MJ, Quinn JP, McFarland MA, Hendrickson CL, Marshall AG. Anal Chem. 2003;75:3256–3262. doi: 10.1021/ac030015q. [DOI] [PubMed] [Google Scholar]
- 3.a Baba T, Hashimoto Y, Hasegawa H, Hirabayashi A, Waki I. Anal Chem. 2004;76:4263–4266. doi: 10.1021/ac049309h. [DOI] [PubMed] [Google Scholar]; b Silivra OA, Kjeldsen F, Ivonin IA, Zubarev RA. J Am Soc Mass Spectrom. 2005;16:22–27. doi: 10.1016/j.jasms.2004.09.015. [DOI] [PubMed] [Google Scholar]
- 4.a Syka JEP, Coon JJ, Schroeder MJ, Shabanowitz J, Hunt DF. Proc Natl Acad Sci USA. 2004;101:9528–9533. doi: 10.1073/pnas.0402700101. [DOI] [PMC free article] [PubMed] [Google Scholar]; b Coon JJ, Syka JEP, Schwartz JC, Shabanowitz J, Hunt DF. Int J Mass Spectrom. 2004;236:33–42. [Google Scholar]; c Pitteri SJ, Chrisman PA, Hogan JM, McLuckey SA. Anal Chem. 2005;77:1831–1839. doi: 10.1021/ac0483872. [DOI] [PMC free article] [PubMed] [Google Scholar]
- 5.Hogan JM, Pitteri SJ, Chrisman PA, McLuckey SA. J Proteome Res. 2005;4:628–632. doi: 10.1021/pr049770q. [DOI] [PMC free article] [PubMed] [Google Scholar]
- 6.Chrisman PA, Pitteri SJ, Hogan JM, McLuckey SA. J Am Soc Mass Spectrom. 2005;16:1020–1030. doi: 10.1016/j.jasms.2005.02.010. [DOI] [PMC free article] [PubMed] [Google Scholar]
- 7.(a) Pitteri, S. J.; McLuckey, S. A. Mass Spectrom. Rev., DOI 10.1002/mas.20048. ; b McLuckey SA, Stephenson JL., Jr Mass Spectrom Rev. 1998;17:369–407. doi: 10.1002/(SICI)1098-2787(1998)17:6<369::AID-MAS1>3.0.CO;2-J. [DOI] [PubMed] [Google Scholar]
- 8.a Hvelplund P, Liu B, Brøndsted NB, Tomita S. Int J Mass Spectrom. 2003;225:83–87. [Google Scholar]; b Hvelplund P, Liu B, Nielsen SB, Tomita S, Cederquist H, Jensen J, Schmidt HT, Zettergren H. Eur Phys J D. 2003;22:75–79. [Google Scholar]
- 9.a Loo RRO, Udseth HR, Smith RD. J Phys Chem. 1991;95:6412–6415. [Google Scholar]; b Stephenson JL, Jr, McLuckey SA. J Am Chem Soc. 1996;118:7390–7397. [Google Scholar]; c Scalf M, Westphall MS, Krause J, Kaufman SL, Smith LM. Science. 1999;283:194–197. doi: 10.1126/science.283.5399.194. [DOI] [PubMed] [Google Scholar]
- 10.a Loo RRO, Udseth HR, Smith RD. J Am Soc Mass Spectrom. 1992;3:695–705. doi: 10.1016/1044-0305(92)87082-A. [DOI] [PubMed] [Google Scholar]; b Wells JM, Chrisman PA, McLuckey SA. J Am Soc Mass Spectrom. 2002;13:614–622. doi: 10.1016/S1044-0305(01)00364-6. [DOI] [PubMed] [Google Scholar]; c Wells JM, Chrisman PA, McLuckey SA. J Am Chem Soc. 2001;123:12428–12429. doi: 10.1021/ja0170403. [DOI] [PubMed] [Google Scholar]; d He M, McLuckey SA. J Am Chem Soc. 2003;125:7756–7757. doi: 10.1021/ja0354521. [DOI] [PubMed] [Google Scholar]; (e) He, M.; Emory, J. E.; McLuckey, S. A. Anal. Chem., DOI 10.1021/ac0482312.
- 11.a Stephenson JL, Jr, McLuckey SA. Anal Chem. 1996;68:4026–4032. doi: 10.1021/ac9605657. [DOI] [PubMed] [Google Scholar]; b Stephenson JL, Jr, McLuckey SA. J Am Soc Mass Spectrom. 1998;9:585–596. doi: 10.1016/S1044-0305(98)00025-7. [DOI] [PubMed] [Google Scholar]; c Scalf M, Westphall MS, Smith LM. Anal Chem. 2000;72:52–60. doi: 10.1021/ac990878c. [DOI] [PubMed] [Google Scholar]; d McLuckey SA, Reid GE, Wells JM. Anal Chem. 2002;74:336–346. doi: 10.1021/ac0109671. [DOI] [PubMed] [Google Scholar]; e McLuckey SA, Stephenson JL, Jr, Asano KG. Anal Chem. 1998;70:1198–1202. doi: 10.1021/ac9710137. [DOI] [PubMed] [Google Scholar]
- 12.Pitteri SJ, Reid GE, McLuckey SA. J Proteome Res. 2004;3:46–54. doi: 10.1021/pr034054u. [DOI] [PubMed] [Google Scholar]
- 13.Badman ER, Chrisman PA, McLuckey SA. Anal Chem. 2002;74:6237–6243. doi: 10.1021/ac026020w. [DOI] [PubMed] [Google Scholar]
- 14.McLuckey SA, Glish GL, Asano KG, Grant BC. Anal Chem. 1988;60:2220–2228. [Google Scholar]
- 15.a Kelleher NJ, Senko MW, Siefel MM, McLafferty FW. J Am Soc Mass Spectrom. 1997;8:380–383. [Google Scholar]; b Van Berkel GJ, Asano KG, Schnier PD. J Am Soc Mass Spectrom. 2001;12:853–862. doi: 10.1016/S1044-0305(01)00264-1. [DOI] [PubMed] [Google Scholar]
- 16.Dearth MA, Asano KG, Hart KJ, Buchanan MV, Goeringer DE, McLuckey SA. Anal Chem. 1997;69:5121–5129. [Google Scholar]
- 17.McLuckey SA, Goeringer DE, Glish GL. J Am Soc Mass Spectrom. 1991;2:11–21. doi: 10.1016/1044-0305(91)80056-D. [DOI] [PubMed] [Google Scholar]
- 18.Kaiser RE, Jr, Cooks RG, Stafford GC, Jr, Syka JEP, Hemberger PH. Int J Mass Spectrom Ion Processes. 1991;106:79–115. [Google Scholar]
- 19.Reid GE, Wells JM, Badman ER, McLuckey SA. Int J Mass Spectrom. 2003;222:243–258. [Google Scholar]
- 20.McLuckey SA, Glish GL, Asano KG, Grant BC. Anal Chem. 1988;60:2220–2228. [Google Scholar]
- 21.(a) Kelley, P. E. Mass Spectrometry Method using Notch Filter. U.S. Patent 5,134,286, July 28, 1992. ; b Goeringer DE, Asano KG, McLuckey SA, Hoekman D, Stiller SE. Anal Chem. 1994;66:313–318. [Google Scholar]
- 22.Pople, J. A. et al. Gaussian 03; Gaussian, Inc.: Pittsburgh, PA, 2003.
- 23.Foresman, J. B.; Frisch, E. Exploring Chemistry with Electronic Structure Methods, 2nd ed.; Gaussian: Pittsburgh, PA, 1996.
- 24.Curtiss LA, Raghavachari K, Trucks GW, Pople JA. J Chem Phys. 1991;94:7221–7230. [Google Scholar]
- 25.Curtiss LA, Raghavachari K, Redfern PC, Rassolov V, Pople JA. J Chem Phys. 1998;109:7764–7776. [Google Scholar]
- 26.a Ramos C, Winter PR, Zwier TS, Pratt ST. J Chem Phys. 2002;116:4011–4022. [Google Scholar]; b Robinson AG, Winter PR, Zwier TS. J Chem Phys. 2002;116:7918–7925. [Google Scholar]
- 27.Vivian JT, Callis PR. Chem Phys Lett. 1994;229:153–160. [Google Scholar]
- 28.Doktorov EV, Malhin IA, Man’ko VI. J Mol Spectrosc. 1977;64:302–326. [Google Scholar]
- 29.Wells JM, Chrisman PA, McLuckey SA. J Am Chem Soc. 2003;125:7238–7249. doi: 10.1021/ja035051l. [DOI] [PubMed] [Google Scholar]
- 30.Thomson JJ. Philos Mag. 1924;47:337–378. [Google Scholar]
- 31.Mahan B. H.; Prigogine, I.; Rice, S. A. Advances in Chemical Physics; Wiley: New York, 1973; pp 1–40.
- 32.a Bates DL, Morgan WL. Phys Rev Lett. 1990;64:2258–2260. doi: 10.1103/PhysRevLett.64.2258. [DOI] [PubMed] [Google Scholar]; b Morgan WL, Bates DR. J Phys B. 1992;25:5421–5430. [Google Scholar]
- 33.a Landau LD. Phys Z (USSR) 1932;2:46–51. [Google Scholar]; b Zener C. Proc Royal Soc London. 1932;A136:696–702. [Google Scholar]
- 34.Dressler, R. A.; Viggiano, A. A. In Encyclopedia of Mass Spectrometry, Reactions of Organic Molecules with Organic Ions; Nibbering, N. M. M., Ed.; Elsevier: Amsterdam, 2005; pp 534–542.
- 35.Bauer E, Fisher ER, Gilmore FR. J Chem Phys. 1969;51:4173–4181. [Google Scholar]
- 36.Dressler RA, Levandier DJ, Williams S, Murad E. Comm At Mol Phys. 1999;34:43–55. [Google Scholar]
- 37.a Olson RE, Smith FT, Bauer E. Appl Optics. 1971;10:1848–1855. doi: 10.1364/AO.10.001848. [DOI] [PubMed] [Google Scholar]; b Olson RE. J Chem Phys. 1972;56:2979–2984. Note that there is a typographical error in this paper in the equation for the exponent in relation 15. The dependence upon rET should be rET3/2, and not rET5/2. The calculations in the paper were carried out using rET3/2. [Google Scholar]
- 38.Zubarev RA. Eur J Mass Spectrom. 2002;8:337–349. [Google Scholar]
- 39.Syrstad EA, Tureèek F. J Am Soc Mass Spectrom. 2005;16:208–224. doi: 10.1016/j.jasms.2004.11.001. [DOI] [PubMed] [Google Scholar]
- 40.a Sawicka A, Skurski P, Hudgins RR, Simons J. J Phys Chem B. 2003;107:13505–13511. [Google Scholar]; b Anusiewicz I, Berdys-Kochanska J, Simons J. J Phys Chem A. 2005;109:5801–5813. doi: 10.1021/jp050218d. [DOI] [PubMed] [Google Scholar]
- 41.Ingemann S, Fokkens RH, Nibbering NMM. J Org Chem. 1991;56:607–612. [Google Scholar]
- 42.NIST Chemistry WebBook, NIST Standard Database 69, January, 2005, http://webbook.nist.gov/chemistry/
- 43.Cooper HJ, Hudgins RR, Håkansson K, Marshall AG. J Am Soc Mass Spectrom. 2002;13:241–249. doi: 10.1016/S1044-0305(01)00357-9. [DOI] [PubMed] [Google Scholar]
- 44.a Breuker K, Oh HB, Horn DM, Cerda BA, McLafferty FW. J Am Chem Soc. 2002;124:6407–6420. doi: 10.1021/ja012267j. [DOI] [PubMed] [Google Scholar]; b Haselmann KF, Budnik BA, Kjeldsen F, Polter NC, Zubarev RA. Eur J Mass Spectrom. 2002;8:461–469. doi: 10.1255/ejms.555. [DOI] [PubMed] [Google Scholar]
- 45.Breuker K, Oh HB, Cerda BA, Horn DM, McLafferty FW. Eur J Mass Spectrom. 2002;8:177–180. [Google Scholar]
- 46.Osterwalder A, Nee MJ, Zhou J, Neumark DM. J Chem Phys. 2004;121:6317–6322. doi: 10.1063/1.1787491. [DOI] [PubMed] [Google Scholar]
- 47.Kebarle P, Chowdhury S. Chem Rev. 1987;87:513–534. [Google Scholar]
- 48.Miller, J. C.; Miller, J. N. Statistics for Analytical Chemistry, 3rd ed.; Ellis Harwood: New York, 1993.
- 49.Budnik BA, Nielsen ML, Olsen JV, Haselmann KF, Hörth P, Haehnel W, Zubarev RA. Int J Mass Spectrom. 2002;219:283–294. [Google Scholar]
- 50.Rienstra-Kiracofe JC, Tschumper GS, Schaefer HF, III, Nandi S, Ellison GB. Chem Rev. 2002;102:231–282. doi: 10.1021/cr990044u. [DOI] [PubMed] [Google Scholar]
- 51.Stephenson JL, Jr, McLuckey SA. J Am Chem Soc. 1997;119:1688–1696. [Google Scholar]