

Abstract
Background
The primary prevention of cardiovascular disease involves using the Framingham risk score to identify high risk patients and then prescribe preventive treatments.
Aim
To examine the performance of the Framingham risk score in different socioeconomic groups in a population with high rates of cardiovascular disease.
Design of study
A prospective study.
Setting
West of Scotland.
Method
The observed 10-year cardiovascular disease and coronary heart disease mortality rates in 5626 men and 6678 women free from cardiovascular disease from the Renfrew/Paisley Study were compared with predicted rates, stratified by socioeconomic class and by area deprivation score.
Results
The ratio of predicted to observed cardiovascular mortality rate in the 12 304 men and women with complete risk factor information was 0.56 (95% confidence interval [CI] = 0.52 to 0.60), a relative underestimation of 44%. Cardiovascular disease mortality was underestimated by 48% in manual participants (predicted over observed = 0.52, 95% CI = 0.48 to 0.56) compared to 31% in the non-manual participants (predicted over observed = 0.69, 95% CI = 0.60 to 0.81, P = 0.0005). Underestimation was also worse in participants from deprived areas (P = 0.0017). Only 4.8% of individuals had a 10-year cardiovascular risk of >40% (equivalent to >30% 10-year coronary risk), and 81% of deaths occurred in the rest. If the Framingham score had been recalibrated for manual and non-manual members of this population, an additional 3611 individuals mainly from manual social classes would have reached the treatment threshold.
Conclusion
Currently recommended risk scoring methods underestimate risk in socioeconomically deprived individuals. The likely consequence is that preventive treatments are less available to the most needy.
Keywords: cardiovascular diseases, clinical prediction tool, Framingham score, mass screening, primary health care, risk assessment
INTRODUCTION
The National Service Framework for coronary heart disease in England and Wales states that individuals whose estimated coronary heart disease risk is 30% or more over 10 years should be identified and offered appropriate advice and treatment. An assessment of absolute cardiovascular risk is also integral to recent hypertension guidance.1–3 Scottish and international guidance also recommend calculating an individual's risk based upon regression equations derived from the Framingham Heart Study and Framingham Offspring Study.4–9
Recent studies have shown that Framingham risk scores overestimate coronary risk in British and other European populations, with growing international evidence that the accuracy of the Framingham risk equations depends upon the background risk of the population to which they are applied.10–14 Cardiovascular disease risk is greater in low-income populations for reasons that cannot be explained by classical risk factors, so the Framingham risk score may perform differently in such populations.15,16 If, because of this, their predicted risk fails to reach the treatment threshold, patients in poor socioeconomic circumstances may be excluded from receiving preventive treatment. In this paper, we assess the ability of the Framingham risk score to predict 10-year cardiovascular and coronary heart disease death in individuals from different social classes and who are resident in different categories of deprivation, ranging from affluent to deprived.
METHOD
The Renfrew and Paisley study
Between 1972 and 1976, 15 406 men and women aged 45–64 years from the general population of Renfrew and Paisley in the west of Scotland were screened for cardiovascular risk factors. The response rate was 78% and full details of the study have been published elsewhere.17,18 Social class was determined by regular occupation. In the case of retired men, the last full-time occupation was recorded. For housewives, their husbands' occupations were used. Participants were classified as non-manual if they were in social classes I, II, IIIN and manual if in social classes IIIM, IV, or V. The postcode of the home address at the time of screening enabled the Carstairs and Morris deprivation category ranging from 1 to 7, to be ascertained.19 Participants were categorised into three groups, defined as Affluent (1–3), Intermediate (4–5) or Deprived (6–7). Subjects were excluded if they had a history of cardiovascular disease or if data on risk factors or socioeconomic deprivation were missing (Table 1). Data on high-density lipoprotein cholesterol were not collected, so the mean values of 1.3 mmol/l for men and 1.5 mmol/l for women from the Scottish Health Survey were used.20 Participants were flagged at the General Register Office in Edinburgh and cardiovascular disease and coronary heart disease deaths were identified over 10 years of follow up.
Table 1.
Exclusions and definitions of risk factors and end points
| Framingham | Renfrew and Paisley | |
|---|---|---|
| Exclusions | History of stroke, transient ischaemia, intermittent claudication and cancer (other than basal cell carcinomas). Physician assessed definite angina pectoris, myocardial infarction and congestive cardiac failure. Definite ECG evidence of myocardial infarction and coronary insufficiency. Doubtful ECG evidence of myocardial infarction | Rose angina (definite grade I or II), self-report of severe chest pain lasting half an hour or more, ECG evidence of myocardial infarction (definite or probable — Minnesota coded), self-report of stroke, previous cardiovascular disease hospitalisation. Left the country, missing risk factor data |
| Cardiovascular disease mortality | Panel review of death certificates using other available clinical information including sudden death of presumed cardiac origin, death from stroke, congestive cardiac failure and peripheral vascular disease | Death with cardiovascular disease as underlying cause (ICD-9 390-459) |
| Coronary heart disease mortality | Panel review of death certificates using other available clinical information including sudden death of presumed cardiac origin | Death with ischaemic heart disease as the underlying cause (ICD9 410-414) |
| Smokinga | Current or quit within past year | Current or quit within past year |
| Diabetesa | Treatment with insulin or oral agents or having a fasting glucose 7.7mmol/l or above | Self-report or non-fasting glucose >11.1 mmol/l |
| ECG evidence of left ventricular hypertrophya | Definite — not Minnesota coded | Definite — Minnesota coded |
| Systolic blood pressurea | Mean of two office measurements | Mean of two measurements |
| Total cholesterola | Abell-Kendell method | Annan and Isherwood method |
| High-density lipoprotein cholesterola | Determined after heparin–manganese precipitation | Default values: Men 1.3 mmol/l Women 1.5 mmol/l |
The Framingham input variables together with age and sex.
The Framingham Studies
The risk assessment methods recommended for British and European use are adapted from published equations derived from 5573 men and women, free of cardiovascular disease, from the Framingham Heart Study and the Framingham Offspring Study.9,21 Prediction equations relating to six outcomes have been derived, and these equations can be used to estimate risk over a range of 4–12 years for persons aged 30–74 years. Two of these outcomes are considered in this paper: death from cardiovascular disease and death from coronary heart disease.9
How this fits in
Guidelines for the primary prevention of cardiovascular disease recommend using the Framingham risk score to identify high-risk patients and prescribing preventive treatments. The Framingham risk score is known to overestimate cardiovascular disease risk in some British and other European populations but its performance in different socioeconomic groups is unknown. In this study the Framingham risk score underestimated the risk of dying from cardiovascular disease in men and women from a population with high levels of socioeconomic deprivation and high rates of cardiovascular mortality. This underestimation was worse in people from areas of high deprivation and from manual social classes, relative to more affluent individuals, leading to fewer people in deprived areas reaching current treatment thresholds. Future risk assessment methods could include measures of socioeconomic deprivation to improve the targeting of preventive treatment to those who need it the most.
Statistical methods
Predicted versus observed 10-year risk: The predicted probabilities of cardiovascular disease and coronary heart disease mortality within 10 years were calculated for each participant using the relevant Framingham equations.9 The average predicted mortality rates within each category of deprivation (affluent, intermediate and deprived) and social class (non-manual and manual) were compared with the observed 10-year rates calculated by the Kaplan–Meier method.22 Participants were further categorised into groups defined by quintiles of predicted risk calculated using the Framingham cardiovascular disease event equation rather than the mortality equations, as this is the outcome recommended for risk assessment in the most recent guidance.9
Discrimination
To assess the ability of the Framingham equation for cardiovascular disease risk to rank individuals relative to their observed risk of cardiovascular and coronary heart disease death within 10 years, the area under the receiver operating characteristic (AUROC) curves for both endpoints within each social class group was calculated. In recent guidance, the decision to prescribe preventive treatment depends upon thresholds of fatal and non-fatal cardiovascular risk.2,3 We therefore calculated the sensitivities, specificities, positive and negative predictive values, and the positive and negative likelihood ratios for each social class group at the risk score thresholds of 40, 30, 20 and 10% cardiovascular disease event risk within 10 years. The likelihood ratio is a clinically useful measure that combines sensitivity and specificity and expresses the power of a test result to change the odds of disease.
We used bootstrap techniques for calculating 95% confidence intervals for the predicted versus observed risk ratio, the likelihood ratios and the tests for trends and differences between subgroups.23
RESULTS
Baseline characteristics
Of the 15 406 men and women recruited to the Renfrew/Paisley study, 2648 (17.2%) with a history of cardiovascular disease were excluded. A further 454 with incomplete risk factor information were excluded, leaving a total of 5626 men and 6678 women for analysis. Table 2 compares the baseline characteristics of these participants with the 2590 men and 2983 women from the Framingham study used in the derivation of the risk equations.
Table 2.
Baseline characteristics of men and women in the Framingham and Renfrew, and Paisley studies.
| Framingham | Renfew and Paisley | |||
|---|---|---|---|---|
| Date of baseline data collection | 1968–1975 | 1972–1976 | ||
| Age range at baseline (years) | 30–74 | 45–64 | ||
| Men | Women | Men | Women | |
| Number of participantsa | 2590 | 2983 | 5626 | 6678 |
| Smoking (%) | 40.7 | 38.9 | 55.3 | 46.9 |
| Diabetes (%) | 7.1 | 5.2 | 1.4 | 1.1 |
| ECG-LVH (%) | 1.1 | 0.5 | 0.5 | 0.4 |
| SBP (mmHg) | ||||
| 5th percentile | 109 | 100 | 116 | 114 |
| Median | 128 | 123 | 145 | 147 |
| 95th percentile | 168 | 168 | 190 | 196 |
| Total cholesterol (mmol/l) | ||||
| 5th percentile | 4.0 | 3.9 | 4.4 | 4.8 |
| Median | 5.4 | 5.5 | 5.8 | 6.4 |
| 95th percentile | 7.3 | 7.6 | 7.5 | 8.3 |
Without pre-existing cardiovascular disease and with complete risk factor data. ECG-LVH = electrocardiographic left ventricular hypertrophy. SBP = systolic blood pressure.
Predicted versus observed 10-year risk
Sex differences
The predicted 10-year cardiovascular disease mortality rates for men and women were 4.7% and 2.2%, respectively, compared with the observed rates of 8.2% and 4.0% leading to predicted/observed ratios of 0.57 (95% confidence interval [CI] = 0.53 to 0.63) for men and 0.55 (95% CI = 0.49 to 0.62) for women. The equivalent predicted/observed ratios for coronary heart disease mortality were 0.66 (95% CI = 0.60 to 0.74) for men and 0.53 (95% CI = 0.46 to 0.63) for women. The underprediction for men and women combined was 44% (predicted over observed 0.56, 95% CI = 0.52 to 0.60) for cardiovascular disease mortality and 38% (predicted over observed 0.62, 95% CI = 0.57 to 0.68) for coronary heart disease mortality.
Area deprivation and social class
The effects of area deprivation and social class upon the accuracy of the Framingham score were independent of the sex of the participants, so we combined the results for men and women. The Framingham score under predicted cardiovascular disease risk in non-manual participants by 31% (predicted over observed 0.69, 95% CI = 0.60 to 0.81) compared to 48% in the manual participants (predicted over observed 0.52, 95% CI = 0.48 to 0.56, P-value for the difference =0.0005) (Table 3). There was a trend of worsening underprediction of cardiovascular disease, from participants in affluent areas to those from deprived areas (P = 0.0017). These patterns were similar when the analysis was restricted to coronary heart disease mortality, with a 22% underprediction in non-manual participants, compared to 44% for manual participants (P <0.0001), although the trend for underprediction in in deprived areas relative to affluent areas did not reach statistical significance (P = 0.067).
Table 3.
Ten-year predicted versus observed cardiovascular disease death rates by deprivation category and social class.
| n | Mortality rates (%) | |||||
|---|---|---|---|---|---|---|
| Deathsa | Total | Predictedb | Observedc | Pred/obs ratio (95% CI) | P-valued | |
| Deprivation: | ||||||
| Affluent | 123 | 2491 | 3.3 | 5.1 | 0.64 (0.54 to 0.75) | |
| Intermediate | 386 | 7083 | 3.3 | 5.7 | 0.58 (0.53 to 0.64) | 0.0017 |
| Deprived | 187 | 2730 | 3.4 | 7.2 | 0.47 (0.41 to 0.54) | |
| Social class: | ||||||
| Non-manual | 191 | 4723 | 2.9 | 4.2 | 0.69 (0.60 to 0.81) | |
| Manual | 505 | 7581 | 3.6 | 7.0 | 0.52 (0.48 to 0.56) | 0.0005 |
| All subjects | 696 | 12304 | 3.3 | 5.9 | 0.56 (0.52 to 0.60) | |
Number of cardiovascular disease deaths observed within 10 years of screening.
Mean Framingham-predicted 10-year cardiovascular disease mortality rate.
Kaplan–Meier estimated 10-year cardiovascular disease mortality rate.
P-value for trend in predicted/observed (pred/obs) mortality rate ratios over deprivation groups, or for difference between social class groups.
Quintiles of Framingham risk
The relative underprediction of cardiovascular disease risk was similar between quintiles of Framingham risk although less pronounced in the lowest and highest risk quintiles. (Figure 1).
Figure 1.
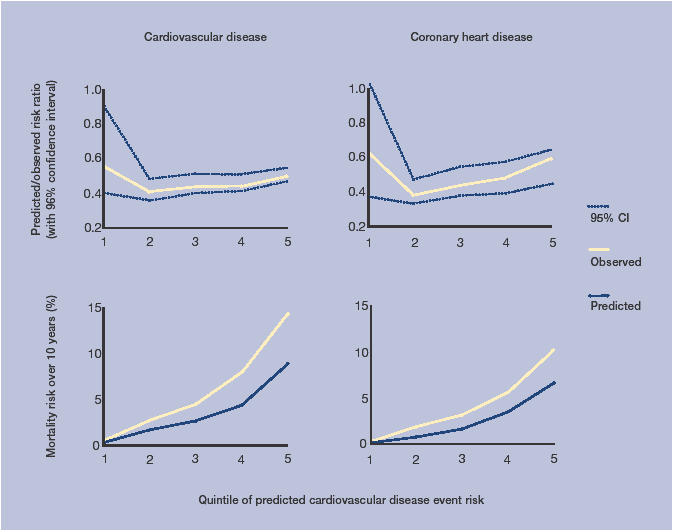
Ten-year predicted and observed rates of cardiovascular disease and coronary heart disease mortality quintiles of Framingham predicted cardiovascular disease event risk.
Discrimination
Applying the Framingham cardiovascular disease event equation to the Renfrew and Paisley baseline data, 585 (4.8%) individuals were identified as being at >40% 10-year cardiovascular disease risk and 18.8% of the cardiovascular deaths occurred in this group. Forty per cent 10-year cardiovascular disease risk is roughly equivalent to the 30% 10-year coronary heart disease threshold recommended by earlier guidance.1,24 Nearly 43% of participants were above the 20% threshold (equivalent to 15% coronary heart disease), and the sensitivity for identifying cardiovascular disease death increased to 74.3%, at the expense of the false positive rate increasing from 3.9% to 40.6%.
To estimate the numbers of participants who failed to reach these treatment thresholds because of the underestimation of their true risk, we inflated each participant's predicted risk, multiplying it by the average underprediction of the social class group to which they belonged. Inflating participants’ predicted risks of cardiovascular disease death in this way resulted in 4196 (34.1%) individuals reaching the >40% threshold. The percentage reaching the >20% threshold increased from 42.6% to 77.0% after adjustment. Table 4 shows the effect of underprediction in each social class group, with 7.9 times more manual individuals reaching the >40% threshold after adjustment and a 4.9-fold increase following adjustment in the non-manual participants.
Table 4.
Numbers of participants and cardiovascular disease deaths by thresholds of predicted cardiovascular disease event risk in manual and non-manual social classes according to the original Framingham equation and the same equation inflated by the average under prediction in each social class group.
| Original Framingham CVD event risk | Inflated Framingham CVD event riska | ||||||||||||
|---|---|---|---|---|---|---|---|---|---|---|---|---|---|
| Non-manual | Manual | All | Non-manual | Manual | All | ||||||||
| 10-year CVD event risk | nb (%) | Deathsc (%) | n (%) | Deaths (%) | n (%) | Deaths (%) | n (%) | Deaths (%) | n (%) | Deaths (%) | n (%) | Deaths (%) | |
| ≤20% | 3004 (63.6) | 57 (28.8) | 4063 (53.6) | 124 (23.4) | 7067 (57.4) | 181 (24.8) | 1882 (39.8) | 23 (11.4) | 1204 (15.9) | 14 (2.4) | 2830 (23.0) | 32 (4.1) | |
| >20% | 1719 (36.4) | 134 (70.4) | 3518 (46.4) | 381 (75.7) | 5237 (42.6) | 515 (74.3) | 2841 (60.2) | 168 (88.1) | 6377 (84.1) | 491 (97.3) | 9474 (77.0) | 664 (95.5) | |
| >30% | 593 (12.6) | 73 (38.5) | 1396 (18.4) | 215 (42.8) | 1989 (16.2) | 288 (41.6) | 1609 (34.1) | 131 (68.8) | 4860 (64.1) | 452 (89.7) | 6631 (53.9) | 578 (83.3) | |
| >40% | 161 (3.4) | 32 (16.9) | 424 (5.6) | 98 (19.5) | 585 (4.8) | 130 (18.8) | 785 (16.6) | 85 (44.8) | 3353 (44.2) | 373 (74.2) | 4196 (34.1) | 458 (66.1) | |
| Totals | 4723 | 191 | 7581 | 505 | 12304 | 696 | 4723 | 191 | 7581 | 505 | 12304 | 696 | |
Framingham cardiovascular disease event risk inflated by 45% (relative under prediction in non-manual group 1/0.69) and 94% (relative underprediction in manual group 1/0.52).
Numbers of participants within each threshold with percentages of column totals.
Numbers of cardiovascular disease deaths in 10 years. Percentage figures relate to the estimated probability of having been in the particular risk group, given that cardiovascular death occurred within 10 years; these are adjusted for censoring due to non-CVD deaths using Bayes' Theorem and Kaplan-Meier 10-year survival probability estimates, hence some slight differences compared to crude column percentages, and ≤20% and >20% figures do not sum exactly to 100%. CVD = cardiovascular disease.
Using the standard unadjusted equation, the area under the receiver operating characteristic curve was 74.4 (95% CI = 71.0 to 77.7) for the non-manual and 72.0 (95% CI = 69.9 to 74.1) manual groups. Table 5 shows the expected worsening of the positive likelihood ratio and improving negative likelihood ratio at the lower risk thresholds. An individual who is >40% is about 4.8 times more likely to die from cardiovascular disease than someone with a risk of <40%. A negative test at this threshold is, however, almost useless at reassuring individuals. At each threshold, the positive likelihood ratio is less in the manual compared to the non-manual social class although the P-value is high at the >40% threshold representing the small numbers of very high-risk participants. There is no difference between social classes in the discriminatory power of a negative test at different thresholds as indicated by the negative likelihood ratio.
Table 5.
Performance characteristics of the original Framingham scores for cardiovascular disease mortality.
| Social class | ||||
|---|---|---|---|---|
| Non-manual | Manual | P-value | All | |
| Deathsa (Total) | 191 (4723) | 505 (7581) | 696 (12304) | |
| AUROC (95% CI) | 74.4 (71.0 to 77.7) | 72.0 (69.9 to 74.1) | 0.24 | 73.3 (71.5 to 75.0) |
| 40% threshold of 10-year CVD event risk | ||||
| Sensitivity:specificity | 16.9:97.2 | 19.5:95.4 | 18.8:96.1 | |
| PPV:NPV | 20.6:96.4 | 24.3:94.1 | 23.2:95.0 | |
| LR+ (95% CI) | 5.97 (4.11 to 8.21) | 4.29 (3.40 to 5.17) | 0.12 | 4.84 (4.01 to 5.71) |
| LR- (95% CI) | 0.86 (0.80 to 0.91) | 0.84 (0.81 to 0.89) | 0.63 | 0.84 (0.82 to 0.88) |
| 30% threshold of 10-year CVD event risk | ||||
| Sensitivity:specificity | 38.5:88.6 | 42.8:83.4 | 41.6:85.4 | |
| PPV:NPV | 12.7:97.1 | 16.2:95.1 | 15.1:95.9 | |
| LR+ (95% CI) | 3.36 (2.70 to 3.97) | 2.58 (2.31 to 2.89) | 0.021 | 2.86 (2.58 to 3.12) |
| LR- (95% CI) | 0.69 (0.63 to 0.78) | 0.69 (0.63 to 0.73) | 1.00 | 0.68 (0.64 to 0.72) |
| 20% threshold of 10-year CVD event risk | ||||
| Sensitivity:specificity | 70.4:65.1 | 75.7:55.8 | 74.3:59.4 | |
| PPV:NPV | 8.0:98.1 | 11.4:96.8 | 10.3:97.4 | |
| LR+ (95% CI) | 2.02 (1.82 to 2.23) | 1.71 (1.61 to 1.81) | 0.0053 | 1.83 (1.74 to 1.92) |
| LR- (95% CI) | 0.46 (0.35 to 0.55) | 0.43 (0.37 to 0.51) | 0.60 | 0.43 (0.38 to 0.49) |
| 10% threshold of 10-year CVD event risk | ||||
| Sensitivity:specificity | 96.9:23.5 | 97.9:15.6 | 97.6:18.7 | |
| PPV:NPV | 5.2:99.4 | 8.0:99.0 | 7.0:99.2 | |
| LR+ (95% CI) | 1.27 (1.22 to 1.30) | 1.16 (1.14 to 1.18) | <0.0001 | 1.20 (1.18 to 1.22) |
| LR- (95% CI) | 0.13 (0.05 to 0.27) | 0.14 (0.07 to 0.23) | 0.95 | 0.13 (0.08 to 0.20) |
Number of observed cardiovascular deaths within 10 years of screening. AUROC = area under the receiver operating characteristic curve. CVD = cardiovascular disease. LR+ = likelihood ratio of a positive test. LR- = likelihood ratio of a negative test. NPV = negative predictive value. PPV = positive predictive value.
Sensitivity analyses
High-density lipoprotein cholesterol was not measured in the Renfrew and Paisley study, and as the total cholesterol to high-density lipoprotein-cholesterol ratio is included in the Framingham equations, we used default measures likely to represent the average high-density lipoprotein levels of the participants.20 Although there is no relationship between high-density lipoprotein and social class in men,20 we performed sensitivity analyses using high-density lipoprotein values 15% above and below the default values. The pattern and scale of worsening underestimation with increasing socioeconomically disadvantage remained unchanged.
The Renfrew and Paisley Study had a lower prevalence of diabetics than the Framingham Study, that may be due to the use of different definitions of diabetes in the two studies. We performed a sensitivity analysis involving changing the diabetic status from ‘not diabetic’ to ‘diabetic’ in a randomly selected sample of Renfrew and Paisley participants to achieve the same sex-specific prevalence of diabetes as in the Framingham study. This had no significant effect on the results, probably because of limited influence of the small numbers of diabetics on the results
DISCUSSION
Summary of main findings
This paper shows that the Framingham score underestimates the risk of cardiovascular disease death in men and women from a population with high levels of socioeconomic deprivation and high rates of cardiovascular mortality. The underestimation is significantly greater in people from manual social classes and who live in deprived areas, than in more affluent people. Consequently, targeting preventive treatment using thresholds of Framingham risk as a screening test was poor, with a large proportion of people, especially in manual social classes, failing to reach treatment thresholds. Disproportionate underestimation of risk may contribute to health inequalities, as individuals might not be identified as high risk. A likely consequence is that cardiovascular disease risk-reducing treatments are not being offered to those who need them most.
Our results suggest that individual and area-based measures of socioeconomic deprivation might make an additional contribution to cardiovascular risk prediction in addition to the traditional risk factors included in the Framingham equation. This may be because measures of social deprivation represent other risk factors such as early life and childhood growth, diet, exercise and other lifestyle factors influenced by socioeconomic position and area of residence or differences in preventive or hospital treatment experienced by people from different backgounds.25 The use of dichotomous smoking and diabetes variables may also fail to capture subtle differences between socioeconomic groups.
Strengths and limitations of the study
As far as we are aware, this is the first study to examine the accuracy of Framingham risk prediction in people from different social classes and from areas of different deprivation index. The Renfrew and Paisley Study population is typical of some of the most deprived areas of Scotland and within this area there is still considerable heterogeneity in the distribution of area-based deprivation and individual social class.25 The observation of increasing underestimation of cardiovascular risk with worsening socioeconomic position is likely to be robust, as it is present using both an individual measure of social class and an area-based indicator of deprivation.
We have found the same findings using two mortality endpoints. Using cardiovascular disease mortality as the primary outcome for the study is relevant, as recent risk-scoring tools have adopted this outcome in preference to coronary heart disease.8,26,27 However, recent hypertension guidelines recommend the more inclusive fatal and non-fatal cardiovascular disease as the chosen endpoint.2,3 We were unable to compare predicted disease rates with observed rates for Framingham endpoints that include non-fatal events, as the Renfrew/Paisley and the Framingham studies ascertained non-fatal events differently. However, where a difference in predicted Framingham risk and observed outcomes has been found, it is similar for both fatal and non-fatal events.11
Comparison with existing literature
Although we are not aware of other studies that have examined the accuracy of Framingham predictions in people with different levels of social deprivation, several studies have shown that the ability of the Framingham equations to predict absolute risk is dependent upon the background risk of the population to which they are applied.10–14,28 One of these set in Whickham, north-east England, found that the Framingham score underestimated risk in individuals with an annual coronary risk of <1.5%, while another British study concluded that the Framingham score predicted reasonably well in the placebo arm of a trial population.29,30 A third British study, in contrast to the our findings, found that the Framingham score overestimated non-fatal and fatal coronary heart disease events by about 50% in a sample of men from the British Regional Heart Study.11 The difference in these results might be partially explained by much lower 10-year coronary heart disease mortality rate of 4.1%, in the British Regional Heart Study compared with 6.3% for the men of the Renfrew/Paisley study. Studies in populations with lower disease rates, have consistently found that Framingham overestimates coronary and cardiovascular disease risk.10–13
Implications for future clinical practice
The underestimation of cardiovascular risk by the Framingham score in this high risk population, with worse performance in lower income populations relative to the more affluent, has important implications for patients, their doctors and public policy. The continued use of the Framingham risk score in its current form has the potential to contribute to existing health inequalities. Fewer individuals from deprived backgrounds may reach treatment thresholds because the risk score fails to take into account the additional risk associated with where people live or their socioeconomic position. The number of cardiovascular deaths prevented could be increased if treatment is better targeted by a more accurate and inclusive risk assessment method.
There is increasing evidence that the Framingham risk equations are unable to provide accurate estimations of absolute risk in individuals from different populations. Risk estimates derived from cohorts studies such as Framingham and the recent SCORE project, do not have the flexibility to incorporate regional, socioeconomic and temporal differences in disease rates.26 Alternative approaches to risk assessment and treatment are required that might be more adaptable or applied differently to populations with varying risk factor and disease patterns.
Funding body
Peter M Brindle was funded by the Wellcome Trust
Competing interests
None.
REFERENCES
- 1.Department of Health. National Service Framework for Coronary Heart Disease. London: Department of Health; 2000. [Google Scholar]
- 2.Williams B, Poulter NR, Brown MJ, et al. British Hypertension Society guidelines for hypertension management 2004 (BHS-IV): summary. BMJ. 2004;328:634–640. doi: 10.1136/bmj.328.7440.634. [DOI] [PMC free article] [PubMed] [Google Scholar]
- 3.North of England Hypertension Guideline Development Group. Essential hypertension: managing adult patients in primary care. Newcastle upon Tyne: Centre for Health Services Research, University of Newcastle; 2004. [PubMed] [Google Scholar]
- 4.Scottish Intercollegiate Guidelines Network (SIGN) Lipids and the primary prevention of coronary heart disease. A national guideline — No 40. Edinburgh: SIGN; 1999. 40. 2000. [Google Scholar]
- 5.Fodor JG, Frohlich JJ, Genest JJ, Jr, McPherson PR. Recommendations for the management and treatment of dyslipidemia. Report of the Working Group on Hypercholesterolemia and Other Dyslipidemias. CMAJ. 2000;162(10):1441–1447. [PMC free article] [PubMed] [Google Scholar]
- 6.Jackson PR. Guidelines on preventing cardiovascular disease in clinical practice. BMJ. 2000;320:659–661. doi: 10.1136/bmj.320.7236.659. [DOI] [PMC free article] [PubMed] [Google Scholar]
- 7.National Institute of Health/National Heart, Lung and Blood Institute. Third Report of the National Cholesterol Education Program Expert Panel on Detection, evaluation and treatment of high blood cholesterol in adults (Adult treatment panel III) Executive Summary. Bethesda: National Institutes of Health; 2001. [Google Scholar]
- 8.De Backer G, Ambrosioni E, Borch-Johnsen K, et al. European guidelines on cardiovascular disease prevention in clinical practice. Third Joint Task Force of European and Other Societies on Cardiovascular Disease Prevention in Clinical Practice. Eur Heart J. 2003;24:1601–1610. doi: 10.1016/s0195-668x(03)00347-6. [DOI] [PubMed] [Google Scholar]
- 9.Anderson KM, Odell PM, Wilson PW, Kannel WB. Cardiovascular disease risk profiles. American Heart Journal. 1991;121(1):293–298. doi: 10.1016/0002-8703(91)90861-b. [DOI] [PubMed] [Google Scholar]
- 10.Empana JP, Ducimetiere P, Arveiler D, et al. Are the Framingham and PROCAM coronary heart disease risk functions applicable to different European populations? The PRIME study. Eur Heart J. 2003;24:1903–1911. doi: 10.1016/j.ehj.2003.09.002. [DOI] [PubMed] [Google Scholar]
- 11.Brindle P, Emberson J, Lampe F, et al. Predictive accuracy of the Framingham coronary risk score in British men: prospective study. BMJ. 2003;327:1267–1270. doi: 10.1136/bmj.327.7426.1267. [DOI] [PMC free article] [PubMed] [Google Scholar]
- 12.Hense HW, Schulte H, Lowel H, Assmann G, Keil U. Framingham risk function overestimates risk of coronary heart disease in men and women from Germany — results from MONICA Augsburg and the PROCAM cohorts. Eur Heart J. 2003;3:1–9. doi: 10.1016/s0195-668x(03)00081-2. [DOI] [PubMed] [Google Scholar]
- 13.Thomsen TF, McGee D, Davidsen M, Jorgensen T. A cross-validation of risk-scores for coronary heart disease mortality based on data from the Glostrup Population Studies and Framingham Heart Study. Int J Epidemiol. 2002;31(4):817–822. doi: 10.1093/ije/31.4.817. [DOI] [PubMed] [Google Scholar]
- 14.Diverse Populations Collaborative Group. Prediction of mortality from coronary heart disease among diverse populations: is there a common predictive function? Heart. 2002;88:222–228. doi: 10.1136/heart.88.3.222. [DOI] [PMC free article] [PubMed] [Google Scholar]
- 15.Davey Smith G, Bartley M, Blane D. The Black Report on socioeconomic inequalities in health 10 years on. BMJ. 1990;301:373–377. doi: 10.1136/bmj.301.6748.373. [DOI] [PMC free article] [PubMed] [Google Scholar]
- 16.Fiscella K, Franks P. Should Years of Schooling Be Used to Guide Treatment of Coronary Risk Factors? Ann Fam Med. 2004;2(5):469–473. doi: 10.1370/afm.88. [DOI] [PMC free article] [PubMed] [Google Scholar]
- 17.Hawthorne VM, Watt GC, Hart CL, et al. Cardiorespiratory disease in men and women in urban Scotland: Baseline characteristics of the Renfrew/Paisley (Midspan) study population. Scott Med J. 1995;40(4):102–107. doi: 10.1177/003693309504000402. [DOI] [PubMed] [Google Scholar]
- 18.Watt GCM, Hart CL, Hole DJ, et al. Risk factors for cardiorespiratory and all cause mortality in men and women in urban Scotland: 15 year follow up. Scot Med J. 1995;40:108–112. doi: 10.1177/003693309504000403. [DOI] [PubMed] [Google Scholar]
- 19.Carstairs V, Morris R. Deprivation and health in Scotland. Aberdeen: Aberdeen University Press; 1991. [Google Scholar]
- 20.The Scottish Office Department of Health. The Scottish Health Survey 1995. Edinburgh: The Stationery Office; 1997. [Google Scholar]
- 21.Anderson KM, Wilson PW, Odell PM, Kannel WB. An updated coronary risk profile. A statement for health professionals. Circulation. 1991;83(1):356–362. doi: 10.1161/01.cir.83.1.356. [DOI] [PubMed] [Google Scholar]
- 22.Kaplan E, Meier P. Nonparametric estimation from incomplete data. J Am Stat Assoc. 1958;53:457–481. [Google Scholar]
- 23.Efron B, Tibshirani R. An introduction to the bootstrap. Monographs on statistics and applied probability. New York, NY; London: Chapman and Hall; 1993. [Google Scholar]
- 24.Joint British recommendations on prevention of coronary heart disease in clinical practice. British Cardiac Society, British Hyperlipidaemia Association, British Hypertension Society, endorsed by the British Diabetic Association. Heart. 1998;80(Suppl 2):S1–S29. [PMC free article] [PubMed] [Google Scholar]
- 25.Davey Smith G, Hart C, Watt G, et al. Individual social class, area-based deprivation, cardiovascular disease risk factors, and mortality: the Renfrew and Paisley study. J Epidemiol Community Health. 1998;52:399–405. doi: 10.1136/jech.52.6.399. [DOI] [PMC free article] [PubMed] [Google Scholar]
- 26.Conroy RM, Pyorala K, Fitzgerald AP, et al. Estimation of ten-year risk of fatal cardiovascular disease in Europe: the SCORE project. Eur Heart J. 2003;24(11):987–1003. doi: 10.1016/s0195-668x(03)00114-3. [DOI] [PubMed] [Google Scholar]
- 27.Pocock SJ, McCormack V, Gueyffier F, et al. A score for predicting risk of death from cardiovascular disease in adults with raised blood pressure, based on individual patient data from randomised controlled trials. BMJ. 2001;323(7304):75–81. doi: 10.1136/bmj.323.7304.75. [DOI] [PMC free article] [PubMed] [Google Scholar]
- 28.D'Agostino RB, Sr, Grundy S, Sullivan LM, et al. Validation of the Framingham coronary heart disease prediction scores: results of a multiple ethnic groups investigation. JAMA. 2001;286(2):180–187. doi: 10.1001/jama.286.2.180. [DOI] [PubMed] [Google Scholar]
- 29.Ramachandran S, French JM, Vanderpump MP, et al. Using the Framingham model to predict heart disease in the United Kingdom: retrospective study. BMJ. 2000;320(7236):676–677. doi: 10.1136/bmj.320.7236.676. [DOI] [PMC free article] [PubMed] [Google Scholar]
- 30.West of Scotland Coronary Prevention Study Group. Influence of pravastatin and plasma lipids on clinical events in the West of Scotland Coronary Prevention Study (WOSCOPS) Circulation. 1998;97(15):1440–1445. doi: 10.1161/01.cir.97.15.1440. [DOI] [PubMed] [Google Scholar]