Abstract
The intra-orbital lachrymal gland (Harderian gland, or HG) of the female rat was studied by magnetic resonance imaging (MRI) to evaluate whether MRI can be used to visualize the gland in vivo and localized-1H-spectroscopy detect its lipid content. The results were correlated with post-mortem anatomical sections, and with light and electron microscopy. On MRI, HG presented as a mass located between the ocular bulb and the orbit. In strongly T2W sequences the secretory structures had a reduced signal while intraparenchymal connective tissue was visible. T2-quantitative maps values of HG (60.12 ± 8.15 ms, mean ± SD) were different from other tissues (i.e. muscular tissue, T2 = 44.79 ± 3.43 ms and olfactory bulb, T2 = 79.26 ± 4.25 ms). In contrast-enhanced-MRI, HG had a signal-intensity-drop of 0.074 ± 0.072 (mean ± SD), after injection of AMI-25, significantly different from the muscle (0.17 ± 0.10). Localized MRI spectra gave a large part of the signal originating from fat protons, but with a significant percentage from water protons. At light and electron microscopy the lipid deposition appeared to be composed of low-density material filling a large part of the cytoplasm, and the porphyrin aggregates were easily recognizable. The data demonstrate that an in vivo study of the HG was feasible and that high-field MRI allowed analysis of the gross anatomy detecting the lipid content of the gland.
Keywords: lipid, pheromones, porphyrin, spectroscopy, ultrastructure
Introduction
The Harderian gland (HG) is a tubuloalveolar gland located within the orbit of terrestrial vertebrates that exhibit a nictitating membrane (Baccari, 1996; Chieffi et al. 1996). HG has been described in reptiles, amphibia, birds and some mammals (Djeridane, 1996; Ortiz et al. 2001). The anatomical location within the orbit, and the size of the HG, varies among species. The gland is quite large in amphibia and reptiles (Di Matteo et al. 1995; Shirama et al. 1996), while in birds it is the dominant orbital gland. Among mammals it may also be large, especially in rodents. Adult humans do not have HG but HG vestiges seem to be present in the fetus between weeks 11 and 30 (Buzzell, 1996). The HG in mammals has been defined as a lipid-secreting tubuloalveolar ocular gland. The HG of many rodent species, including the rat, mouse and hamster, has received more attention than that of any other species. The rodent HG is about 20% lipid by wet weight (Buzzell et al. 1995).
The mammalian HG is characterized by the production of porphyrins typically found in the lumina as solid accretions. The rodent HG has been extensively used as a model of porphyrin biosynthesis since the presence of porphyrin was described in rat HG long ago (Antolin et al. 1996; Baccari, 1996; Chieffi et al. 1996; Payne et al. 1996).
To date, the morphology and fine structure of the HG have been studied in several species, but the lack of a non-invasive imaging technique hampers the in vivo investigation of the organ in small laboratory animals. In recent years a capacity for submillimetric scale imaging has been obtained by the development of magnetic resonance imaging (MRI) technology (Sbarbati & Osculati, 1996). This method seems to be particularly informative in lipid-rich tissue, allowing evaluation of fat content of organs and thus avoiding extractive procedures commonly used in other biochemical methods (Sbarbati et al. 1997; Lunati et al. 2001a, b). However, this new approach has never been used in studies on the HG.
The present paper reports on MRI at a submillimetric spatial resolution of the rat HG. We sought to evaluate whether MRI can visualize the HG and quantify the lipid content of the gland. The results have been correlated with those obtained by sectional approach, light and electron microscopy.
Materials and methods
Six adult female Sprague–Dawley rats were used. All MRI experiments were carried out using a Biospec System (Bruker, Karlsruhe, Germany) equipped with a 4.7-T Oxford Magnet, 33-cm bore, and a SMIS (Surrey Medical Imaging System Ltd, UK) gradient insert. A 35-mm i.d. transmitter/receiver birdcage coil was used. For in vivo experiments the rats were anaesthetized by inhalation of a mixture of air and O2 containing 1–2% halothane. After a coronal scout SE image, coronal multislice T2-weighted (T2W) images were acquired to localize the area of interest. In order to obtain T2 parametric maps, coronal multi-echo spin-echo images were acquired with the following parameters: TR = 2040.0 ms, TE = 100 ms, FOV = 5 × 5 cm2, matrix size = 256 × 192, slice thickness = 1 mm. T1 maps were obtained by acquiring several Spin-echo images with TR = 4999.0; 1000; 500; 300; 110 ms, TE = 16.8 ms, FOV = 4.0 cm, matrix size = 128 × 256, slice thickness = 1 mm. At the end a coronal multislice T2W SE image was acquired before and immediately after a bolus injection of a super paramagnetic contrast agent. Acquisition parameters were: TR = 3037.0 ms, TE = 65.0 ms, FOV = 5 × 5 cm2, matrix size = 256 × 256, slice thickness = 1 mm.
The contrast medium, AMI-25 (Endorem, Guerbet) was injected into the rat caudal vein at a dose of 5 mg Fe kg−1. AMI-25 is a suspension of super paramagnetic iron oxide nanoparticles, widely employed in MRI experiments for its strong effects (Josephson et al. 1991). Its blood half-life in rats is 15 min (Kent et al. 1990), being absorbed by the liver. Considering that the acquisition time of the Spin-echo sequences is about 2 min and that only the central lines of the κ-space contribute significantly to the signal intensity of the image, the concentration of AMI-25 was hypothesized to be steady state during the acquisition of the relevant lines of the κ-space. Images were quantitatively analysed using the region-of-interest (ROI) method. To obtain information on the microcirculatory bed, the in vivo signal intensity drop (SID) was calculated measuring the signal intensity before and immediately after the contrast agent injection. In steady state conditions it can be shown (Hamberg et al. 1996) that: SID = K ln (Spre/Spost). Where Spre and Spost are the signal intensity, respectively, before and after the contrast agent injection and K depends on the TE and other experimental conditions, but is constant over the different pixels of the image; K factor can be ignored.
For localized 1H spectra a single slice spin-echo sequence was acquired as a morphological reference with the following parameters: FOV = 4 × 4 cm2, matrix size 128 × 128, slice thickness = 4 mm, TR = 1 s, TE = 15.8 ms, acquisition time = 2 min. After a global shimming, the water signal was suppressed by using a single gaussian 10 ms r.f. pulse followed by spoiler gradients. Then localized shimming was performed on the slice selected. Chemical shift images were acquired using a spin echo CSI sequence consisting of two slice selective RF pulses (90° and 180°) and two-phase encoding cycles. The sequence was acquired with the following parameters: FOV = 4 × 4 cm2, matrix size 16 × 16, slice thickness = 4 mm, TR = 1 s, TE = 5.25 ms; 512 complex points (zero filled at 1024) were acquired with bandwidth (BW) = 6000.92 Hz, and number of acquisitions (NEX) = 4.
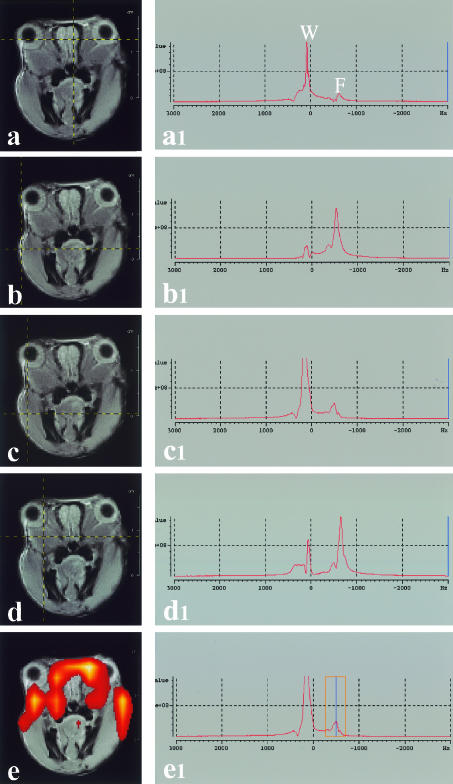
Chemical shift images were analysed using the CSI tool of the software Para Vision (Bruker, Karlsruhe, Germany). By using this software it is possible to observe the spectrum relative to each pixel selected in the reference morphological image (see Fig. 3a-d) or to observe the space distribution of the signal intensity within a selected spectral region (see Fig. 3e).
Fig. 3. In the left column (a–e), images of a rat's head are visible. The intersection between horizontal and vertical lines marks the point where localized 1H spectra were acquired. In the right column (a1–e1) the corresponding 1H-spectra are shown (W, water proton peak; F, fat proton peak). If a window is selected in frequencies corresponding to fat proton peak (e1) it is possible to discriminate lipid-rich areas (e). The coloured pixels were superimposed on to an anatomical image. Clear colours indicate areas with richest lipid deposit.
Sectional studies were performed in four rats. The animals were killed, frozen, sectioned and photographed at planes corresponding those visualized in MRI investigation. The sections were then photographed by a stereomicroscope Stemi SV6 (Zeiss, Oberkocken, Germany).
Light and electron microscopy was performed in two of the rats observed with MRI. The glands were removed, fixed in 2.5% glutaraldehyde in Sorensen buffer for 2 h, post-fixed in 1% osmium tetroxide for 1 h, dehydrated in graded ethanols, embedded in epon-araldite, and cut with an Ultracut E (Reichert, Wien, Austria). The semithin sections were stained with toluidine blue. The ultra-thin sections were stained with lead citrate and uranyl acetate and observed with an EM10 electron microscope (Zeiss, Oberkocken, Germany).
Results
In vivo MRI
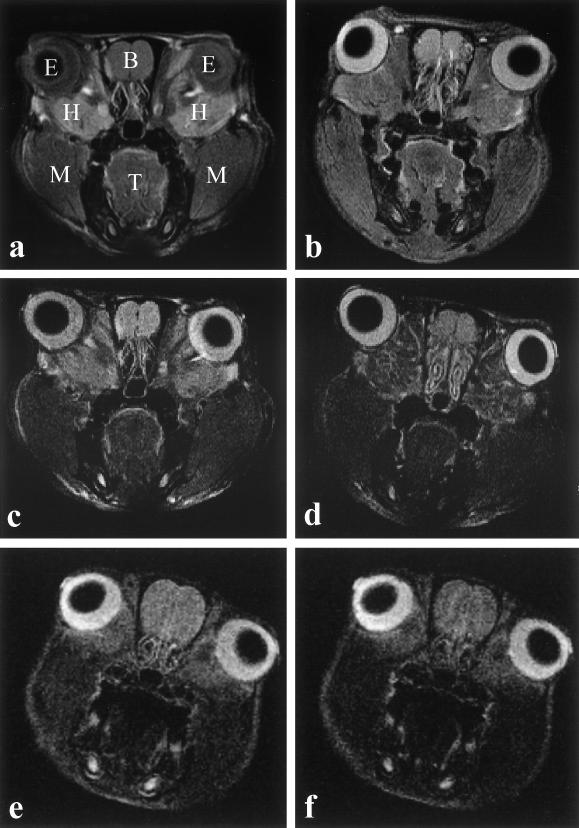
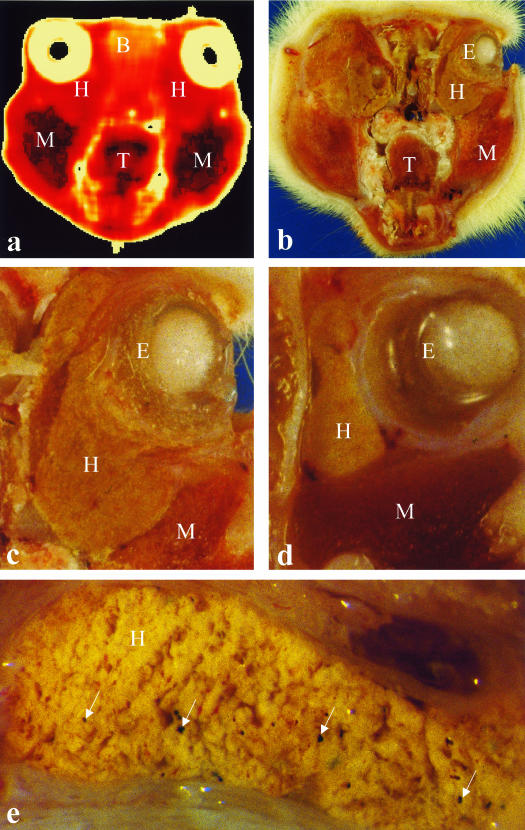
In coronal sections of the orbit, the HG appeared as a mass located between the ocular bulb and the orbit (Figs 1 and 2). In the anterior sections, at level of the crystalline lens, the HG presented a L-like shape and it was located at the medial-inferior sectors of the orbit. In sections posterior to the ocular bulb, the HG presented a triangular outline crossed by the optic nerve. The parenchyma of the HG showed a lobular pattern. In T1W sequences the glandular parenchyma appeared differentiated from the other tissues around it for its relative high signal intensity (Fig. 3). The intraparenchymal connective tissue showed low signal emission. In lightly T2W sequences the glandular parenchyma appears differentiated from the other tissues around it because of its relatively high signal intensity. In strongly T2W sequences the signal originating from secretory structures was reduced and the intraparenchymal and capsular connective tissue was visible. T2 quantitative maps showed values significantly different between the HG (60.12 ± 8.14, mean ± SD) and tissues visible in the same section (i.e. muscular tissue, T2 = 44.79 ± 3.43 ms and olfactory bulb, T2 = 79.25 ± 4.25 ms). Experiments using contrast-enhanced MRI demonstrated in the HG a signal intensity drop of 0.074 ± 0.072 (mean ± SD) after injection of AMI-25. This value is significantly different from the value of the muscle (0.17 ± 0.10). Localized MRI spectra were obtained in pixels located on different portions of the rat's head. Proton spectra of brain and skeletal muscle showed a major contribution of water protons to the genesis of the nuclear magnetic resonance (NMR) signal, the peak of fat protons being very small, while the proton spectra of adipose tissue demonstrated a major contribution of fat protons to the genesis of NMR signal, the peak of water protons being very small. Spectral analysis of HG revealed a very characteristic pattern, with the larger part of the signal originating from fat protons, but with a significant percentage originating from protons in water molecules.
Fig. 1. MRI of a rat's head, coronal section. (a) T1W image. (b) Proton density image. (c) Lightly T2W image. (d) T2W image. (e) Pre-contrast image. (f) Post-contrast image. E, eyeball; B, brain; H, Harderian gland; M, muscle; T, tongue.
Fig. 2. (a) MRI of a rat's head, coronal section. T2 parametric map. (b–e) Anatomical sections. E, eyeball; B, brain; H, Harderian gland; M, muscle; T, tongue. Arrows mark pigment deposit in HG.
Post-mortem examination
In coronal sections, the HG appeared as a mass located between the ocular bulb and the orbit. In the anterior sections, at the level of crystalline lens, the HG appeared as an L-shaped body located at the medial and inferior sectors of the orbit. In the sections posterior to the ocular bulb, the HG presented a triangular outline as it may be deleted by the optic nerve. The HG was characterized by a coarsely lobular pattern with large connective-tissue intraparenchymal septa.
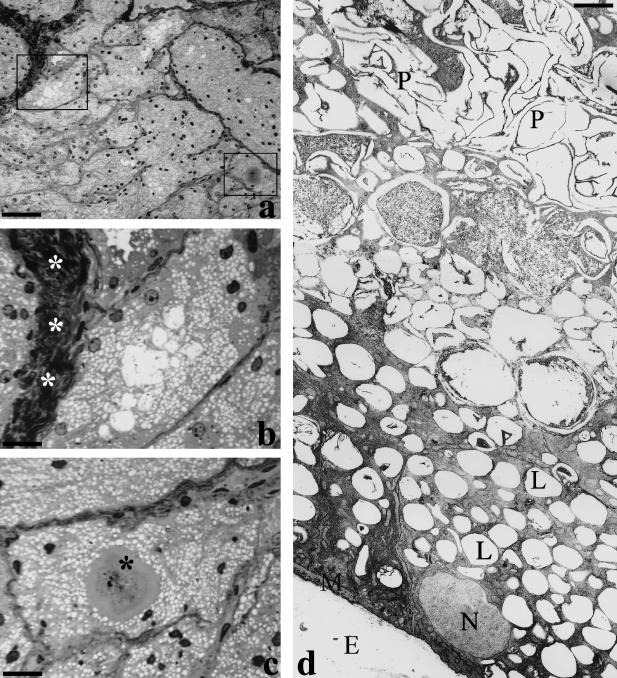
On light microscopy, the lobular architecture was confirmed, and connective septa composed of densely packed collagen bundles were visible. Numerous lipid droplets, with a clear appearance, filled the cytoplasm and porphyrin precipitates were visible in the gland lumina (Fig. 4).
Fig. 4. (a–c) Light microscopy, toluidine-stained semithin sections. White asterisks indicate the connective-tissue septa, while the black asterisks indicate the porphyrin precipitates. (d) Transmission electron microscopy. E, extracellular space; L, lipid pools; N, nucleus; P, porphyrin precipitates. Scale bars = a, 65 µm; b,c, 16 µm (particulars of panel a); d, 2 µm.
At ultrastructural examination, all the light microscopic features were confirmed. The lipid deposition appeared to be composed of low-density, non-osmiophilic material filling a large part of the cytoplasm. The remaining part of the cytoplasm was rich in smooth endoplasmic reticulum and mitochondria. In section, intraluminal porphyrin aggregates were large and easily recognizable.
Discussion
In living animals, the parenchyma of the HG can be easily distinguished from the surrounding tissue. In general, this study demonstated a good correlation between MRI and post-mortem anatomical sections. Its peculiar hydrolipidic ratio makes the HG visible in both T1W and T2W images. The high lipid concentration of the secretory cell provides a strong signal in T1W images in concordance with 1H localized spectral analysis. The parenchyma shows NMR characteristics very similar to those found in other tissues with a multilocular lipid accumulation (i.e. brown adipose tissue) mainly composed of neutral lipids (Sbarbati et al. 1997; Lunati et al. 1999). Connective-tissue septa are characterized by a low-intensity signal in T1W sequences which is probably due to absence of lipid and to the presence of strictly packed collagen bundles easily visible at histology. The strong hydration of connective septa allows a good visualization of the capsular and stromal organization in T2W sequences. A preliminary experiment on contrast-enhanced MRI demonstrated low values of SID, a parameter related to tissue perfusion, after contrast administration. This finding suggests that the blood flow of the HG is rather low in resting condition.
IH-localized spectra demonstrated that the lipid content of the HG could be detected, mapped and eventually quantified, although with a reduced spatial resolution. This result opens up new perspectives for in vivo functional exploration of the HG. It is well known that the lipid content of the HG changes with age, sex and secretory activity of the animal (Buzzel et al. 1995; Varriale, 1996; Gesase & Satoh, 2001). Therefore, information about the lipid content could be useful to follow paradigms of functional activation of the gland (Satoh et al. 1996; Hida et al. 1998; Cavagnari et al. 2001). In addition, methods for the selective detection of metabolites could provide information about specific lipidic compounds in the gland (Lunati et al. 2001a, b).
In conclusion, our data demonstrate the feasibility of an in vivo study of the HG, which represents a unique example of a lipid-secreting structure with porphyrin and pheromones (Seyama et al. 1996; Shanas & Terkel, 1997; Coto-Montes et al. 2001). High-field MRI allows for analysis of the gross anatomy and lipid content. Information on vascularization can also be obtained. Further studies are necessary to evaluate whether the methods are sensitive enough for the porphyrin content to be studied (Payne et al. 1996) and for an analysis of sexual dimorphism, age-related modification and functional activation of the organ.
References
- Antolin I, Rodriguez C, Uria H, Sainz RM, Mayo JC, Kotler ML, et al. Castration increases cell damage induced by porphyrins in the Harderian gland of male Syrian hamster. Necrosis and not apoptosis mediates the subsequent cell death. J. Struct. Biol. 1996;116:377–389. doi: 10.1006/jsbi.1996.0055. [DOI] [PubMed] [Google Scholar]
- Baccari GC. Organogenesis of the Harderian gland: a comparative survey. Microsc. Res. Techn. 1996;34:6–15. doi: 10.1002/(SICI)1097-0029(19960501)34:1<6::AID-JEMT3>3.0.CO;2-S. [DOI] [PubMed] [Google Scholar]
- Buzzell GR, Blank JL, Vaughan MK, Reiter RJ. Control of secretory lipid droplets in the Harderian gland by testosterone and the photoperiod: comparison of two species of hamsters. General Comp. Endocrinol. 1995;99:230–238. doi: 10.1006/gcen.1995.1106. [DOI] [PubMed] [Google Scholar]
- Buzzell GR. Sexual dimorphism in the Harderian gland of the Syrian hamster is controlled and maintained by hormones, despite seasonal fluctuations in hormone levels: functional implications. Microsc. Res. Techn. 1996;34:133–138. doi: 10.1002/(SICI)1097-0029(19960601)34:2<133::AID-JEMT6>3.0.CO;2-T. [DOI] [PubMed] [Google Scholar]
- Cavagnari BM, Sterin-Speziale N, Affanni JM, Knudsen J, Santome JA. Acyl-CoA-binding protein in the armadillo Harderian gland: its primary structure and possible role in lipid secretion. Biochim. Biophys. Acta. 2001;1545:314–325. doi: 10.1016/s0167-4838(00)00294-6. [DOI] [PubMed] [Google Scholar]
- Chieffi G, Baccari GC, Di Matteo L, d'lstria M, Minucci S, Varriale B. Cell biology of the Harderian gland. Int. Rev. Cytol. 1996;168:1–80. doi: 10.1016/s0074-7696(08)60882-7. [DOI] [PubMed] [Google Scholar]
- Coto-Montes A, Boga JA, Tomas-Zapico C, Rodriguez-Colunga MJ, Martinez-Fraga J, Tolivia-Cadrecha D, et al. Porphyric enzymes in hamster Harderian gland, a model of damage by porphyrins and their precursors. A chronobiological study on the role of sex differences. Chem. Biol. Interact. 2001;134:135–149. doi: 10.1016/s0009-2797(00)00320-3. [DOI] [PubMed] [Google Scholar]
- Di Matteo L, Baccari GC, Minucci S. Effect of cholinergic secretagogue substances on the morphology of the Harderian gland in the frog, Rana esculenta. Comp. Biochem. Physiol. A. Physiol. 1995;112:29–34. doi: 10.1016/0300-9629(95)00095-o. [DOI] [PubMed] [Google Scholar]
- Djeridane Y. Comparative histological and ultrastructural studies of the Harderian gland of rodents. Microsc. Res. Techn. 1996;34:28–38. doi: 10.1002/(SICI)1097-0029(19960501)34:1<28::AID-JEMT5>3.0.CO;2-S. [DOI] [PubMed] [Google Scholar]
- Gesase AP, Satoh Y. Sexual differences and effects of castration on secretory mode and intracellular calcium ion dynamics of golden hamster Harderian gland. Cell. Tissue Res. 2001;304:81–90. doi: 10.1007/s004410100352. [DOI] [PubMed] [Google Scholar]
- Hamberg LM, Boccalini P, Stranjalis G, Hunter GJ, Huang Z, Halpern E, et al. Continuous assessment of relative cerebral blood Volume in transient ischemia using steady state susceptibility-contrast MRI. Magn. Reson. Med. 1996;35:168–173. doi: 10.1002/mrm.1910350207. [DOI] [PubMed] [Google Scholar]
- Hida A, Uchijima Y, Seyama Y. Sexual differences in branched chain amino acid metabolism into fatty acids and cholesterol in Harderian gland of golden hamster. J. Biochem. (Tokyo) 1998;12:648–653. doi: 10.1093/oxfordjournals.jbchem.a022161. [DOI] [PubMed] [Google Scholar]
- Josephson L, Bigler J, White D. The magnetic properties of some materials affecting MR images. Magn. Reson. Med. 1991;22:204–208. doi: 10.1002/mrm.1910220208. [DOI] [PubMed] [Google Scholar]
- Kent TA, Quast MJ, Kaplan BJ, Lifsey RS, Eisemberg HM. Assessment of superparamagnetic iron oxide (AMI-25) as a brain contrast agent. Magn. Reson. Med. 1990;13:434–443. doi: 10.1002/mrm.1910130310. [DOI] [PubMed] [Google Scholar]
- Lunati E, Marzola P, Nicolato E, Fedrigo M, Villa M, Sbarbati A. In vivo quantitative lipidic map of brown adipose tissue by chemical shift imaging at 4.7 Tesla. J. Lipid Res. 1999;40:1395–1400. [PubMed] [Google Scholar]
- Lunati E, Farace P, Nicolato E, Righetti C, Marzola P, Sbarbati A, et al. Polyunsaturated fatty acids mapping by (1) H MR-chemical shift imaging. Magn. Reson. Med. 2001a;46:879–883. doi: 10.1002/mrm.1272. [DOI] [PubMed] [Google Scholar]
- Lunati E, Marzola P, Nicolato E, Sbarbati A. In-vivo quantitative hydrolipidic map of perirenal adipose tissue by chemical shift imaging at 4.7 Tesla Int. J. Obes. Relat. Metab. Disord. 2001b;25:457–461. doi: 10.1038/sj.ijo.0801262. [DOI] [PubMed] [Google Scholar]
- Ortiz GG, Feria-Velasco A, Falcon-Franco MA, Bitzer-Quintero OK, Garcia JJ, Rosales SA, et al. Different patterns in the histology and auto fluorescence of the Harderian glands of the Syrian Hamster, rat, mouse, Mongolian gerbil and guinea pig. Anat. Histol. Embryol. 2001;30:107–115. [PubMed] [Google Scholar]
- Payne AP, Shah SW, Marr FA, McGadey J, Thompson GG, Moore MR. Hormones and the control of porphyrin biosynthesis and structure in the hamster Harderian gland. Microsc. Res. Techn. 1996;34:123–132. doi: 10.1002/(SICI)1097-0029(19960601)34:2<123::AID-JEMT5>3.0.CO;2-T. [DOI] [PubMed] [Google Scholar]
- Satoh Y, Gesase AP, Habara Y, Ono K, Kanno T. Lipid secretory mechanisms in the mammalian Harderian gland. Microsc. Res. Techn. 1996;34:104–110. doi: 10.1002/(SICI)1097-0029(19960601)34:2<104::AID-JEMT2>3.0.CO;2-S. [DOI] [PubMed] [Google Scholar]
- Sbarbati A, Osculati F. Tissutal imaging by nuclear magnetic resonance. Histol. Histopathol. 1996;11:229–235. [PubMed] [Google Scholar]
- Sbarbati A, Guerrini U, Marzola P, Asperio R, Osculati F. Chemical shift imaging at 4.7 tesla of brown adipose tissue. J. Lipid Res. 1997;38:343–347. [PubMed] [Google Scholar]
- Seyama Y, Otsuka H, Ohashi K, Vivien-Roels B, Pevet P. Sexual diversity of the lipid metabolism in the Harderian gland of the golden hamster. Microsc. Res. Techn. 1996;34:71–76. doi: 10.1002/(SICI)1097-0029(19960501)34:1<71::AID-JEMT10>3.0.CO;2-M. [DOI] [PubMed] [Google Scholar]
- Shanas U, Terkel J. Mole-rat Harderian gland secretions inhibit aggression. Anim. Behav. 1997;54:1255–1263. doi: 10.1006/anbe.1997.0533. [DOI] [PubMed] [Google Scholar]
- Shirama K, Satoh T, Kitamura T, Yamada J. The avian Harderian gland: morphology and immunology. Microsc. Res. Techn. 1996;34:16–27. doi: 10.1002/(SICI)1097-0029(19960501)34:1<16::AID-JEMT4>3.0.CO;2-U. [DOI] [PubMed] [Google Scholar]
- Varriale B. Occurrence of androgen and estrogen receptor mRNAs in the Harderian gland: acomparative survey. Microsc. Res. Techn. 1996;34:97–103. doi: 10.1002/(SICI)1097-0029(19960601)34:2<97::AID-JEMT1>3.0.CO;2-S. [DOI] [PubMed] [Google Scholar]


