Abstract
Mechanical loading in the proximal radius was increased by ulnar osteotomy (Group O), altered by Steinmann pinning (Group P) or unaltered in sham operated controls (Group C) in skeletally mature female sheep, aged 2–4 years. A series of intravenous fluorochromes were given to label bone formation and fuchsin-stained microdamage assessed at intervals of up to 24 weeks. Microcracks were present in all groups and were found in the original cortex near the periosteal surface. No microcracks were found in the new, fibrolamellar bone laid down at periosteal orendosteal surfaces. Mean microcrack length (49 μm, SD 10 μ m) did not differ between groups or over time. Microcrack numerical and surface densities and resorption cavity density peaked in all groups at 6 weeks, consistent with a regional acceleratory phenomenon (RAP), but the peaks were significantly greater in Group O. The density of refilling or secondary osteons peaked at 10 weeks and the mean time required for the formation of an osteon was 7.51 ± 0.59 weeks. Fatigue-induced microdamage is normally present in bone and is increased due to repetitive loading of the mechanically overloaded radius. The location and timing of microcracks, resorption cavities and secondary osteons are consistent with the activation-resorption-formation remodelling cycle and suggest that microdamage is a stimulus for bone remodelling.
Keywords: fatigue, fluorochrome, fuchsin, microdamage, remodelling
Introduction
Remodelling of bone involves an activation phase, resorption by osteoclasts and laying down of osteoid lamellae by osteoblasts, which become mineralized to form secondary osteons (Frost, 1973; Martin & Burr, 1989). Frost (1985) estimated the total time for a remodelling cycle – activation, resorption and formation (ARF) – to be 12 weeks. Fatigue-induced microdamage has been proposed as an activation stimulus (Martin & Burr, 1982; Prendergast & Taylor, 1994; Burr, 2000; Martin, 2002). Experimental data linking microdamage and remodelling have been obtained by repetitive mechanical loading of limb bones in a testing rig (Burr et al. 1985; Mori & Burr, 1993; Bentolila et al. 1998; Verborgt et al. 2000). However, such new bone formation could be a temporary, non-specific acceleration of normally on-going processes (Burr et al. 1989) in response to the stress of surgery – the regional acceleratory phenomenon (RAP) (Frost, 1983; Bab et al. 1985; Martin, 1987). In studies where mechanical loading has been increased by osteotomy of the adjacent bone and the animal then allowed to walk and so repetitively load it for several weeks, microdamage has not been studied (Goodship et al. 1979; Carter et al. 1981; Lanyon et al. 1982; Burr et al. 1989). Using electron microscopy, Chamay & Tschantz (1972) observed ‘plastic slip lines’ in overloaded canine ulnae in which surface adaptation, but not intracortical remodelling, was measured.
We previously reported that surface strains in the ovine radius increased significantly following ulnar osteotomy when compared with sham operated controls and an attempted underload model where a Steinmann pin was inserted from olecranon to distal radius (Lee et al. 1999). A series of fluorochromes labelled new fibrolamellar bone formation at periosteal and endosteal surfaces causing an increase in cross-sectional area and surface strains returned to control levels in the osteotomy group within 6 months. There was no evidence of ARF remodelling cycles in this new bone (Lee et al. 1999). In this paper we study the response of the original cortex to loading. Bulk staining in basic fuchsin is used to label microdamage (Frost, 1960; Burr & Stafford, 1990), the fluorescence-aided method used to identify it microscopically (Lee et al. 1998) and the sequence of fluorochromes labels bone remodelling. We asked the following questions: is microdamage present in controls, is it related to surgical stress as part of a RAP, does altered loading affect microdamage and is microdamage related to bone remodelling?
Materials and methods
Thirty-four skeletally mature female Suffolk crossbred sheep, weighing 50–85 kg, were randomly divided into three experimental groups. Under Government Licence, in 11 sheep the ulna was exposed and the periosteum disrupted in a sham operation (Group C), 11 underwent ulnar osteotomy (Group O) and 12 had a Steinmann pin inserted from the olecranon to the volar surface of the distal radius (Group P). Post-operative lameness was scored from 5 (non-weight bearing) to zero (normal gait) by two observers and when normal gait resumed, the sheep were returned to pasture. Oxytetracycline (50 mg kg−1), alizarin (25 mg kg−1), calcein (10 mg kg−1), xylenol orange (90 mg kg−1) and calcein blue (30 mg kg−1) were given intravenously at 1, 4, 10, 16 and 22 weeks to label bone formation and animals were killed at 3, 6, 12 and 24 weeks after surgery by phenobarbitone injection.
Histological analysis
The radius was sectioned transversely at the level of the midpoint (M) of the interosseous space and at 1 cm proximal and distal to this point using a diamond saw (Struers, Germany) to yield two 1-cm blocks. In each animal, proximal and distal blocks were assigned to fuchsin staining at random and the remaining block was stained with mineralized bone stain. The contralateral limb was used in another study (Mohsin et al. in press).
Blocks were bulk stained in basic fuchsin using the following procedure (Burr & Stafford, 1990): (1) 1% basic fuchsin in absolute alcohol for 8 h; (2) change solution; (3) 1% fuchsin in absolute alcohol for 12 h; (4) evaporate in 1% fuchsin in absolute alcohol in watch glass till dry in fume cupboard; (5) rehydrate for 4 days in deionized water. Using the diamond saw, the three 200-µm sections were made from the cut surface at the level of the midpoint of the interosseaous space (M) and then hand-ground to 100 µm and mounted in Eukitt's mounting medium (Frost, 1958, 1959). The third section, more than 1 mm from the initial cut surface, was analysed in order to avoid artefacts incurred prior to staining (Wachtel & Keaveny, 1995). Using epifluorescence microscopy, slides were initially observed using the green filter (λ = 546 nm) and candidate microcracks identified on the basis of fluorescence, their linear shape and size being intermediate between canaliculi and vascular channels. Fluorescence under UV incident light (λ = 365 nm) was used to indicate that the crack was stained through the depth of the section (Lee et al. 1998). These candidate cracks were then viewed under transmitted light and the Burr & Stafford (1990) criteria applied. Microcrack location, length and specimen cross-sectional area were measured using a drawing tube, digitizing tablet (Summagraphics Corp., Fairfield, CT, USA) and Mackintosh IIci personal computer with MacStereology (Table 1).
Table 1.
Intracortical measurements
| 1 | Cr Dn (no. mm−2) | Microcrack density – number of microcracks per unit area |
| 2 | Cr Le (µm) | Microcrack length |
| 3 | Cr S Dn (µm mm−2) | Surface density – length of microcracks per unit area |
| 4 | Ar (no. mm−2) | The number of osteonal resorption spaces per unit area |
| 5 | Af (no. mm−2) | The number of refilling osteons per unit area, as determined by fluorescent osteoid seams |
| 6 | LAR (µm per week) | The linear apposition rate or mean distance between fluorochrome labels divided by time. (As osteons refill from the periphery toward the central Haversian canal, the distance between the inner borders of successive labels was measured) |
| 7 | MWT (µm) | The Mean Wall Thickness in completed osteons. The distance between cement line and the Haversian canal in each osteonal quadrant was measured and the mean taken |
| 8 | Sigma f (weeks) | Time required to form a new osteon |
| Sigma f = MWT/LAR |
In the remaining blocks, 200-µm sections were cut using the diamond saw, hand-ground to 100 µm (Frost, 1958) and stained with mineralized bone stain using the following procedure (Villanueva & Lundin, 1989): (1) immerse in staining solution for 24 h; (2) transfer to tap water and regrind under running water to 70 µm thickness; (3) agitate sections in 0.01% household detergent to remove surface debris and wash with tap water followed by distilled water; (4) differentiate in 0.01% glacial acetic acid in 95% methanol for 4 min; (5) dehydrate in 95% ethanol for 5 min, followed by 100% ethanol for 5 min; (6) clear in 50 : 50 mix of xylene and 100% ethanol for 5 min; (7) steep in two changes of xylene for 5 min and 1 min, respectively; (8) mount in Eukitt's mounting medium. The third slide from the cut surface was examined. Under UV epifluorescence (λ = 365 nm), tetracycline fluoresced yellow–green and calcein was green, making differentiation problematic. This difficulty was solved by switching to green incident light (λ = 546 nm) which caused the calcein to fluoresce but did not excite the tetracycline label. Measurements, listed in Table 1, were made using a drawing tube, digitizing tablet and computer package.
Statistical methods
Data were analysed using analysis of variance in the R and Stata statistical packages (Ihaka & Gentleman, 1996; StataCorp, 2001; Venables et al. 2002).
Results
Full mobility was achieved a mean of 7.2 days after pinning, as compared with 1.4 days in controls and 4.2 days in the osteotomy group. Three sheep in Group O died prematurely from infection between 7 and 10 days after operation. Their data were grouped together at the 1-week time interval. The single remaining Group O sheep killed at 12 weeks had a cross-sectional area of 290.87 mm2 as compared with a mean of 141.87 mm2 (SD, 15.41) for the rest of the flock. On microscopic examination, there was marked deposition of woven bone at the level of the interosseous space beside the osteotomy site, consistent with per-operative trauma and the sheep was excluded from the study as an outlier.
There was no evidence of any difference between the mean values of any of the four parameters (Cr Dn, Cr S DN, Ar and Af) for Groups C and P. Specifically for Cr DN F1,21 = 0.01, p= 0.92; for Cr S DN F1,21 = 0.22, p= 0.65; for Ar F1,21 = 0.22, p= 0.65; and for Af F1,63 = 1.09, p= 0.3. For this reason data from Control and Pin groups were combined in further analyses into a single group.
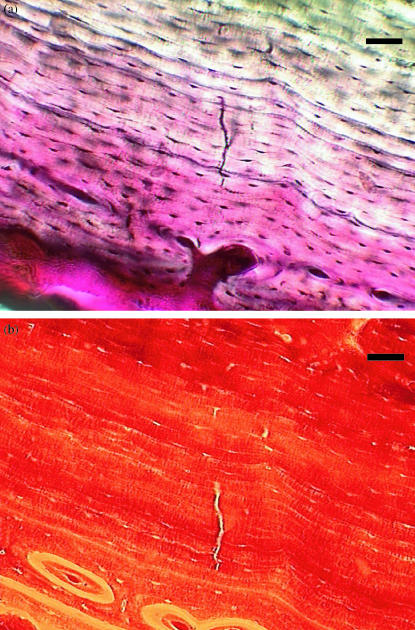
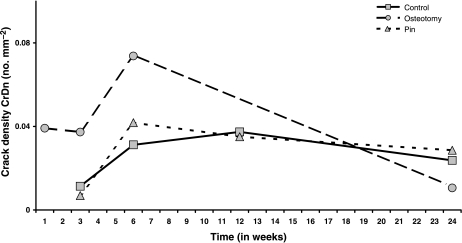
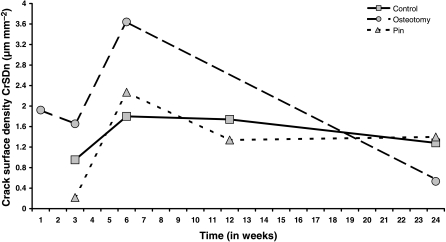
Microcracks were found in all three groups and were present at all time intervals. They were located in the original cortex near the periosteal surface (Fig. 1) and none was found in areas of new periosteal or endosteal bone formation. Microcrack density (Cr Dn) is shown in Fig. 2 and none was found in areas of new periosteal or endosteal bone formation. Microcrack density (Cr Dn) is shown in Fig. 2 and Table 2a. Analysis of variance Table 2b) showed strong evidence for a time effect, with a peak at 6 weeks, and moderate evidence for both an effect of treatment and an interaction between time and treatment. Microcrack surface density (Cr S Dn) is shown in Fig. 3 and Table 3a. As with Cr Dn, there was again good evidence for a time effect, with peaks at 6 weeks, and some evidence for an effect of treatment, and especially for a treatment by time interaction in osteotomies (Table 3b). Mean crack length (Cr Le) was 49 µm (SD 10 µm) and did not differ significantly between groups or over the course of the study. The distribution of crack length was skewed to the right, with a greater number of longer cracks and the maximum crack length was 127 µm in Group O at 24 weeks.
Fig. 1.
Group O, 6 weeks. Fuchsinstained microcrack in circumferential lamellar bone, viewed with (above) transmitted light and (below) green epifluorescence (546 nm). Scale bar = 50 μm.
Fig. 2.
Mean microcrack numerical density, Cr Dn (no. mm–2) In Groups C, O and P plotted against time (weeks) after operation.
Table 2a.
Microcrack numerical density: Cr Dn — no. mm2 mean (SD)
| Time (weeks) | |||||
|---|---|---|---|---|---|
| 1 | 3 | 6 | 12 | 24 | |
| Control | 0.012 (0.016) | 0.031 (0.005) | 0.037 (0.024) | 0.024 (0.003) | |
| Pin | 0.007 (0.007) | 0.042 (0.005) | 0.035 (0.036) | 0.028 (0.019) | |
| Osteotomy | 0.039 (0.026) | 0.037 (0.007) | 0.074 (0.038) | – | 0.011 (0.006) |
Table 2b.
ANOVA for numerical density Cr Dn
| Effect | Df | Sum Sq | Mean Sq | F-value | Pr (> F) |
|---|---|---|---|---|---|
| Time | 4 | 0.005 | 0.001 | 3.464 | 0.022 |
| Osteotomy | 1 | 0.002 | 0.002 | 4.505 | 0.044 |
| Time:Osteotomy | 2 | 0.003 | 0.001 | 3.397 | 0.050 |
| Residuals | 25 | 0.009 | 0.0003 |
Fig. 3.
Mean microcrack surface density, Cr S Dn (μm mm–2) in Groups C, O and P plotted against time (weeks) after operation.
Table 3a.
Microcrack surface density: Cr S Dn, –µm mm−2, mean (SD)
| Time (weeks) | |||||
|---|---|---|---|---|---|
| 1 | 3 | 6 | 12 | 24 | |
| Control | 0.95 (1.34) | 1.80 (0.12) | 1.74 (1.47) | 1.28 (0.10) | |
| Pin | 0.22 (0.19) | 2.27 (0.45) | 1.34 (1.11) | 1.40 (0.79) | |
| Osteotomy | 1.92 (1.16) | 1.65 (0.10) | 3.64 (1.83) | – | 0.53 (0.23) |
Table 3b.
anova for surface density Cr S Dn
| Effect | Df | Sum Sq | Mean Sq | F-value | Pr (> F) |
|---|---|---|---|---|---|
| Time | 4 | 14.561 | 3.640 | 4.317 | 0.009 |
| Osteotomy | 1 | 2.674 | 2.674 | 3.171 | 0.087 |
| Time:Osteotomy | 2 | 5.325 | 2.663 | 3.158 | 0.060 |
| Residuals | 25 | 21.080 | 0.843 |
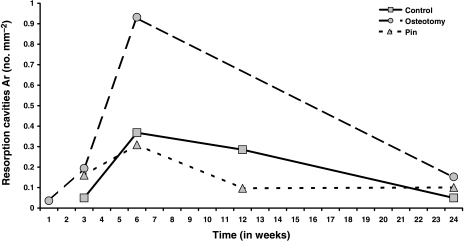
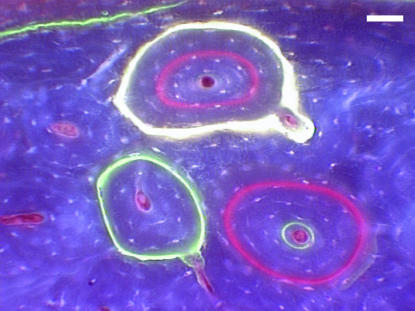
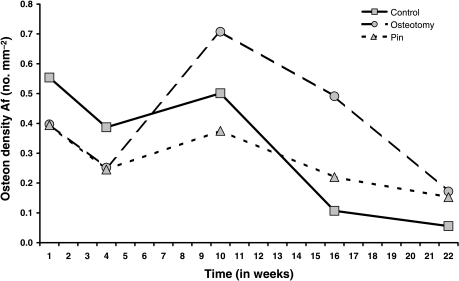
Resorption spaces (Ar) are shown in Fig. 4 and Tables 4a and Tables 4b, where there is very strong evidence for effects of time, again peaking at 6 weeks, treatment and their interaction in osteotomies. Forming osteons (Af) were identified by the presence of a fluorochrome label, which indicated the time of formation (Fig. 5; Table 5a). anova for Af (Table 5b) showed no evidence of any effect of treatment, and only modest evidence for an effect of time, with a peak at 10 weeks.
Fig. 4.
Mean resorption cavity numerical density, Ar (no. mm–2) in Groups C, O and P plotted against time (weeks) after operation.
Table 4a.
Resorption cavities: Ar – no. mm−2, mean (SD)
| Time (weeks) | |||||
|---|---|---|---|---|---|
| 1 | 3 | 6 | 12 | 24 | |
| Control | 0.05 (0.03) | 0.37 (0.27) | 0.28 (0.19) | 0.05 (0.04) | |
| Pin | 0.16 (0.11) | 0.31 (0.19) | 0.10 (0.05) | 0.10 (0.05) | |
| Osteotomy | 0.03 (0.01) | 0.19 (0.06) | 0.93 (0.46) | – | 0.16 (0.02) |
Table 4b.
anova for resorption cavities Ar
| Effect | Df | Sum Sq | Mean Sq | F-value | Pr (> F) |
|---|---|---|---|---|---|
| Time | 4 | 1.172 | 0.293 | 8.883 | 0.0001 |
| Osteotomy | 1 | 0.405 | 0.405 | 12.294 | 0.002 |
| Time:Osteotomy | 2 | 0.316 | 0.158 | 4.790 | 0.017 |
| Residuals | 25 | 0.824 | 0.033 |
Fig. 5.
Group O, 24 weeks. Refilling or secondary osteons, labelled at 1 week with oxytetracylline (yellow), 4 weeks with alizarin (red) and 10 weeks with calcein (green), viewed under UV epifluorescence (365 nm). Scale bar = 50 μm.
Table 5a.
Refilling osteons: Af – no. mm−2 mean (SD)
| Time (weeks) | |||||
|---|---|---|---|---|---|
| 1 | 4 | 10 | 16 | 22 | |
| Control | 0.55 (0.68) | 0.39 (0.29) | 0.50 (0.39) | 0.11 (0.08) | 0.06 (0.04) |
| Pin | 0.39 (0.30) | 0.24 (0.16) | 0.38 (0.17) | 0.22 (0.15) | 0.15 (0.12) |
| Osteotomy | 0.40 (0.41) | 0.25 (0.20) | 0.71 (0.31) | 0.49 (0.23) | 0.17 (0.03) |
Table 5b.
anova for refilling osteons Af
| Effect | Df | Sum Sq | Mean Sq | F-value | Pr (> F) |
|---|---|---|---|---|---|
| Time | 4 | 1.084 | 0.271 | 2.149 | 0.083 |
| Osteotomy | 1 | 0.006 | 0.006 | 0.044 | 0.835 |
| Time:Osteotomy | 4 | 0.341 | 0.085 | 0.675 | 0.611 |
| Residuals | 76 | 9.586 | 0.126 |
Table 6a and 6b show the ratio of the measurements in Group O to those in Groups C and P combined. At weeks 3 and 6, Cr Dn in Group O is just over four times higher and twice as high, respectively, as that in Groups C and P (Fig. 2). For Cr S Dn the corresponding figures are a 3.8-fold and 1.8-fold increase, respectively (Fig. 3). For resorption activity (Ar), the osteotomy group is 1.6-fold, 2.7-fold and 2-fold higher than Groups C and P at weeks 3, 6 and 12 (Fig. 4). All of these differences are globally statistically significant. For osteon formation, the ratios of activity in Group O to Groups C and P are 1.6 : 1, 3 : 1 and 1.7 : 1, respectively, at 10, 16 and 22 weeks (Fig. 6). However, these last ratios do not reach statistical significance.
Table 6a.
Ratio of measurements; Group O: Groups C & P combined
| Time of death (weeks) | ||||||
|---|---|---|---|---|---|---|
| Measurement | 1 | 3 | 6 | 12 | 24 | |
| Cr Dn | – | 4.302 | 2.018 | – | 0.404 | |
| Cr S Dn | – | 3.237 | 1.789 | – | 0.397 | |
| Ar | – | 1.672 | 2.752 | – | 2.031 | |
Table 6b.
Ratio of measurements Group O: Groups C & P combined
| Time of labelling (weeks) | |||||
|---|---|---|---|---|---|
| Measurement | 1 | 4 | 10 | 16 | 22 |
| Af | 0.844 | 0.797 | 1.615 | 3.006 | 1.654 |
Fig. 6.
Mean refilling osteon numerical density, Af (no. mm–2) in Groups C, O and P plotted against time (weeks) after operation.
The time required to form a secondary osteon, Sigma f, was calculated by dividing mean wall thickness by linear apposition rate (Table 7). Sigma f did not differ between groups and the mean time required for the formation of an osteon was 7.51 weeks (SD 0.59 weeks).
Table 7.
Formation Sigma; Sigma f, weeks mean (SD)
| Time (weeks) | |||
|---|---|---|---|
| 1–4 | 4–10 | 10–16 | |
| Control | 7.37 (0.51) | 7.58 (0.58) | 7.28 (0.58) |
| Pin | 6.24 (1.47) | 8.14 (0.66) | 7.75 (0.81) |
| Osteotomy | 7.04 (1.37) | 7.93 (0.72) | 7.51 (1.32) |
Discussion
In vivo microdamage has been reported in human ribs (Frost, 1960; Burr & Stafford, 1990; Lee et al. 1998), human femora (Schaffler et al. 1995) and bovine tibiae (Lee et al. 2000). The presence of microcracks in the radius of the control group of sheep is further evidence that bone normally contains microdamage.
A regional acceleratory phenomenon secondary to surgical stress (Frost, 1983; Bab et al. 1985; Martin, 1987) causing surface deposition of bone peaking at 6 weeks has already been reported in this experimental group (Lee et al. 1999). In the current study, the pre-existing cortex of Groups O and P were not overloaded, but increases in microcrack and resorption cavity densities were seen at 6 weeks. These changes may be part of the RAP. However, the increases in Cr Dn, CR S Dn and Ar were significantly greater in the osteotomy group, where strains on the cranial and caudal surfaces of the radius increased to four times control levels (Lee et al. 1999). As normal mobility was resumed at a mean of 4.2 days after operation, the proximal radius was subjected to cyclical loading during walking and increased mechanical load, conditions which are consistent with the development of fatigue microcracking at 6 weeks.
Microcracks have not previously been studied in in vivo osteotomy models (Goodship et al. 1979; Carter et al. 1981; Lanyon et al. 1982; Burr et al. 1989). However, their presence and relationship with resorption cavities has been investigated in bones undergoing repetitive mechanical loading. Burr et al. (1985) and Mori & Burr (1993) studied three-point fatigue bending in the canine radius and Bentolila et al. (1998) cyclically loaded rat ulnas in an end-load bending system. Both groups showed that resorption cavities occur preferentially in regions of microdamage, perhaps linked with osteocyte apoptosis (Noble & Reeve, 2000; Verborgt et al. 2000) and thus that microdamage is an activatior of bone remodelling. Mori & Burr (1993) discussed why a one-to-one relationship of cracks to resorption cavities is not found – not all cracks may be stained, other stimuli, such as hormonal and metabolic changes, also cause remodelling and cracks may start more than one new resorption space. In this study, the use of transverse sections to locate longitudinal ellipsoids may also be a contributory factor (Taylor & Lee, 1998). Recently, Burr (2000) has argued that 30% of bone remodelling is damage initiated or targeted with the remainder systemically controlled.
Mean Cr Le of 49 µm (SR: 10 µm) is similar to reported data (Burr & Stafford, 1990; Lee et al. 1998; O’Brien et al. 2000) for transverse sections in human rib. The presence of microcracks and the consistency of their dimensions between sites and across species supports the idea of easy initiation but difficult crack growth in bone and of a repair mechanism triggered beyond a critical crack length (Taylor et al. 2002). Microcracks, resorption cavities and osteon formation sites were all located near the periosteal surface of the original cortex, but not in new periosteal or endosteal bone.
Frost (1985) estimated the total sigma for a remodelling cycle – activation, resorption and formation (ARF) – to be 12 weeks. Allowing 3–5 days for activation and about 22 days for resorption, albeit in dogs (Li et al. 1990), this leaves 57 days for formation. Both Cr Dn and Ar were measured after death at 1-, 3-, 6-, 12- and 24-week intervals, which is too large a sampling period to detect the activation time for a new remodelling of about 3–5 days (Mori & Burr, 1993). Thus the rise in both Cr Dn and Ar from 3 weeks, to a peak at 6 weeks, is consistent with microcracking as the activation signal for a remodelling cycle which then progressed to resorption. The mean formation sigma of 7.51 ± 0.59 weeks is comparable with the 57 days estimate (Frost, 1985; Li et al. 1990) and would give a peak in osteonal formation at 13.5 weeks. This time period was not sampled, but the peak at 10 weeks which had declined by 16 weeks, is consistent with Frost's (1985) timescale.
This study had limited power to detect differences between the three treatment groups in their responses. This was exacerbated by the unfortunate loss of animals from the osteotomy group. Despite these difficulties there is good evidence for a real difference between Group O and Groups C and P for three of the parameters, the two markers of damage, and the marker of bone resorption. While the results for bone formation failed to reach statistical significance, the pattern of these results is consistent with the hypothesis of a path from bone damage, as measured by cracks, to bone resorption, to bone remodelling as measured by osteon formation.
In conclusion, this study shows that microdamage is present in controls and may increase as part of the RAP. For the first time, microdamage has been demonstrated in ambulant animals subjected to increased mechanical loading following osteotomy. The location and timing of microcracks, resorption cavities and secondary osteons are consistent with the ARF modelling cycle and provide further evidence that microdamage is a stimulus for bone remodelling.
Acknowledgments
Grant support from the Health Research Board and the Royal College of Surgeons in Ireland is gratefully acknowledged. We thank Alan Goodship for advice regarding fluorochrome preparation.
References
- Bab I, Gazit D, Massarawa A, Sela J. Removal of tibial marrow induces increased formation of bone and cartilage in rat mandibular cartilage. Calcif. Tissue Int. 1985;37:551–555. doi: 10.1007/BF02557840. [DOI] [PubMed] [Google Scholar]
- Bentolila V, Boyce TM, Fyhrie DP, Drumb R, Skerry TM, Schaffler MB. Intracortical remodelling in adult rat long bones after fatigue loading. Bone. 1998;23:275–281. doi: 10.1016/s8756-3282(98)00104-5. [DOI] [PubMed] [Google Scholar]
- Burr DB, Martin RB, Schaffler MB, Radin EL. Bone remodeling in response to in vivo fatigue microdamage. J. Biomech. 1985;18:189–200. doi: 10.1016/0021-9290(85)90204-0. [DOI] [PubMed] [Google Scholar]
- Burr DB, Schaffler MB, Yang KH, Lukoschek M, Sivaneri N, Blahal JD. Skeletal change in response to altered strain environments: is woven bone a response to elevated strain? Bone. 1989;10:223–233. doi: 10.1016/8756-3282(89)90057-4. [DOI] [PubMed] [Google Scholar]
- Burr DB, Stafford T. Validity of the bulk-staining technique to separate artifactual from in vivo bone microdamage. Clin. Orthop. 1990;260:305–308. [PubMed] [Google Scholar]
- Burr DB. Damage detection and behavior in bone. In: Prendergast PJ, Lee TC, Carr AJC, editors. Proceedings of the 12th Conference of the European Society of Biomechanics. Dublin: Royal Academy of Medicine in Ireland; 2000. pp. 38–39. [Google Scholar]
- Carter DR, Harris WH, Vasu R, Caler WE. The mechanical and biological response of cortical bone to in vivo strain histories. In: Cowin SC, editor. Mechanical Properties of Bone. New York: American Society of Mechanical Engineers; 1981. pp. 81–92. [Google Scholar]
- Chamay A, Tschantz P. Mechanical influences in bone remodeling. Experimental research on Wolff's Law. J. Biomech. 1972;5:173–180. doi: 10.1016/0021-9290(72)90053-x. [DOI] [PubMed] [Google Scholar]
- Frost HM. Preparation of thin undecalcified bone sections by rapid manual method. Stain Technol. 1958;33:273–277. doi: 10.3109/10520295809111862. [DOI] [PubMed] [Google Scholar]
- Frost HM. Staining of fresh, undecalcified, thin bone sections. Stain Technol. 1959;34:135–146. doi: 10.3109/10520295909114665. [DOI] [PubMed] [Google Scholar]
- Frost HM. Presence of microscopic cracks in vivo in bone. H. Ford Hosp. Med. Bull. 1960;8:25–35. [Google Scholar]
- Frost HM. Bone Remodeling and its Relation to Metabolic Bone Disease. Springfield: Charles C. Thomas; 1973. [Google Scholar]
- Frost HM. The regional acceleratory phenomenon: a review. H. Ford Hosp. Med. J. 1983;31:3–9. [PubMed] [Google Scholar]
- Frost HM. The skeletal intermediary organization: a synthesis. In: Peck WA, editor. Bone and Mineral Research 3. Amsterdam: Elsevier; 1985. pp. 49–107. [Google Scholar]
- Goodship AE, Lanyon LE, Macfie H. Functional adaptation of bone to increased stress. An experimental study. J. Bone Joint Surg. Am. 1979;61:539–546. [PubMed] [Google Scholar]
- Ihaka R, Gentleman R. R.: a language for data analysis and graphics. J. Comput. Graph. Stats. 1996;5:299–314. [Google Scholar]
- Lanyon LE, Goodship AE, Pye CJ, Macfie JH. Mechanically adaptive bone remodelling. J. Biomech. 1982;15:141–154. doi: 10.1016/0021-9290(82)90246-9. [DOI] [PubMed] [Google Scholar]
- Lee TC, Arthur TL, Gibson LJ, Hayes WC. Sequential labelling of microdamage in bone using chelating agents. J. Orthop. Res. 2000;18:322–325. doi: 10.1002/jor.1100180222. [DOI] [PubMed] [Google Scholar]
- Lee TC, Myers ER, Hayes WC. Fluorescence-aided detection of microdamage in compact bone. J. Anat. 1998;193:179–184. doi: 10.1046/j.1469-7580.1998.19320179.x. [DOI] [PMC free article] [PubMed] [Google Scholar]
- Lee TC, Noelke L, McMahon GT, Mulville JP, Taylor D. Functional adaptation in bone. In: Pedersen P, Bendsoe MP, editors. Synthesis in Bio Solid Mechanics. Dortrecht: Kluwer Academic Publishers; 1999. pp. 1–10. [Google Scholar]
- Li XJ, Jee WSS, Li YL, Patterson-Buckendahl P. Transient effects of subcutaneously administered prostaglandin E2 on cancellous and cortical bone in young adult dogs. Bone. 1990;11:353–364. doi: 10.1016/8756-3282(90)90091-c. [DOI] [PubMed] [Google Scholar]
- Martin RB, Burr DB. A hypothetical mechanism for the stimulation of osteonal remodelling by fatigue damage. J. Biomech. 1982;15:137–139. doi: 10.1016/s0021-9290(82)80001-8. [DOI] [PubMed] [Google Scholar]
- Martin RB. Osteonal remodelling in response to screw implantation in canine femora. J. Orthop. Res. 1987;5:445–452. doi: 10.1002/jor.1100050317. [DOI] [PubMed] [Google Scholar]
- Martin RB, Burr DB. Structure, Function and Adaptation of Compact Bone. New York: Raven Press; 1989. [Google Scholar]
- Martin RB. Is all cortical bone remodeling initiated by microdamage? Bone. 2002;30:8–13. doi: 10.1016/s8756-3282(01)00620-2. [DOI] [PubMed] [Google Scholar]
- Mohsin S, Mercy MV, O'Brien FJ, Taylor D, Lee TC. Computerised three dimensional reconstruction of Haversian systems during bone remodelling. In: Middleton J, Jones ML, Shrive NG, Pande GN, editors. Computer Methods in Biomechanics and Biomedical Engineering – 3. Amsterdam: Gordon and Breach; In Press. [Google Scholar]
- Mori S, Burr DB. Increased intracortical remodeling following fatigue damage. Bone. 1993;14:103–109. doi: 10.1016/8756-3282(93)90235-3. [DOI] [PubMed] [Google Scholar]
- Noble BS, Reeve J. Osteocyte function, osteocyte death and bone fracture resistance. Mol. Cell. Endocrinol. 2000;159:7–13. doi: 10.1016/s0303-7207(99)00174-4. [DOI] [PubMed] [Google Scholar]
- O'Brien FJ, Taylor D, Dickson GR, Lee TC. Visualisation of three-dimensional microcracks in compact bone. J. Anat. 2000;197:413–420. doi: 10.1046/j.1469-7580.2000.19730413.x. [DOI] [PMC free article] [PubMed] [Google Scholar]
- Prendergast PJ, Taylor D. Prediction of bone adaptation using damage accumulation. J. Biomech. 1994;27:1067–1076. doi: 10.1016/0021-9290(94)90223-2. [DOI] [PubMed] [Google Scholar]
- Schaffler MB, Choi K, Milgrom C. Aging and matrix microdamage accumulation in human compact bone. Bone. 1995;17:521–525. doi: 10.1016/8756-3282(95)00370-3. [DOI] [PubMed] [Google Scholar]
- StataCorp. College Station, Texas: Stata Corporation; 2001. Stata Statistical Software: Release 70. [Google Scholar]
- Taylor D, Lee TC. Measuring the shape and size of microcracks in bone. J. Biomech. 1998;31:1177–1180. doi: 10.1016/s0021-9290(98)00133-x. [DOI] [PubMed] [Google Scholar]
- Taylor D, O'Brien F, Lee TC. A theoretical model for the simulation of microdamage accumulation and repair in compact bone. Meccanica. 2002;3179:1–10. [Google Scholar]
- Venables WN, Smith DM Development Core Team. An Introduction to R, Notes on R.: a Programming Environment for Data Analysis and Graphics. Texas: Stata Corporation; 2002. Version 1.5.1. [Google Scholar]
- Verborgt O, Gibson GJ, Schaffler MB. Loss of osteocyte integrity in association with microdamage and bone remodelling after fatigue in vivo. J. Bone Miner. Res. 2000;15:60–67. doi: 10.1359/jbmr.2000.15.1.60. [DOI] [PubMed] [Google Scholar]
- Villanueva AR, Lundin KD. A versatile new mineralized bone stain for simultaneous assessment of tetracycline and osteoid seams. Stain Technol. 1989;64:129–138. doi: 10.3109/10520298909106985. [DOI] [PubMed] [Google Scholar]
- Wachtel EF, Keaveny TM. The dependence of trabecular damage on applied strain level for bovine trabecular bone. Proc. Orthop. Res. Soc. 1995;20:132. [Google Scholar]


