Abstract
An efficient investigation of the effects of genetic or environmental manipulation on mouse development relies on the rapid and accurate screening of a substantial number of embryos for congenital malformations. Here we demonstrate that it is possible to examine normal organ development and identify malformations in mouse embryos by magnetic resonance microscopy in a substantially shorter time than by conventional histology. We imaged embryos in overnight runs of under 9 h, with an operator time of less than 1 h. In normal embryos we visualized the brain, spinal cord, ganglia, eyes, inner ear, pituitary, thyroid, thymus, trachea, bronchi, lungs, heart, kidneys, gonads, adrenals, oesophagus, stomach, intestines, spleen, liver and pancreas. Examination of the brain in embryos lacking the transcriptional coactivator Cited2 showed cerebellar and midbrain roof agenesis, in addition to exencephaly. In these embryos we were also able to detect agenesis of the adrenal gland. We confirmed all malformations by histological sectioning. Thus magnetic resonance microscopy can be used to rapidly identify developmental and organ malformations in mutant mouse embryos generated by transgenic techniques, in high-throughput mutagenesis screens, or in screens to identify teratogenic compounds and environmental factors contributing to developmental malformations.
Keywords: fetal development, histology, magnetic resonance imaging, mutagenesis, transgenic mice
Introduction
The human genome project has resulted in the identification of ∼30 000–40 000 genes (Lander et al. 2001). Future efforts towards understanding the function of these genes in mammals will rely heavily upon gene manipulation techniques in mice. This has proven to be the most powerful technique devised to investigate the molecular mechanisms of gene function, and relies on accurately determining the anatomical or physiological effect of a defined mutation. High-throughput strategies such as gene-trapping and chemical mutagenesis are currently being used to generate large mutant resources that can be used to understand and define gene function (reviewed in Justice et al. 1999). To use mutagenesis as a tool for studying the genetic basis of murine development successfully, it is necessary to identify abnormalities rapidly in a substantial number of embryos (Kasarskis et al. 1998; Herron et al. 2002). Traditional methods of analysis such as histological sectioning and dissection are slow and labour-intensive. Moreover, sectioning results in the loss of three-dimensional (3-D) information, which is essential for the correct interpretation of complex developmental malformations.
Two new methods have recently been described for high-resolution 3-D embryo analysis. The first, termed episcopic fluorescence image capture (EFIC) (Weninger & Mohun, 2002), generates 3-D images at very high resolution. As it involves manual sectioning followed by wax block photography, it is, at least at its present stage of development, unlikely to be suitable for screening entire embryos in high-throughput format. The second approach, termed optical projection tomography, has been used to non-invasively image mouse embryos up to 13.5 days post coitum, and is capable of acquiring data in high-throughput (Sharpe et al. 2002). However, heart and organ development is incomplete at this stage (Kaufman, 1994), and the resolution obtainable in later stage embryos has yet to be established (J. Sharpe, personal communication).
Magnetic resonance imaging (MRI) is inherently non-destructive, is not limited by mechanical or optical considerations, and results in the acquisition of a 3-D dataset. Published methods for imaging mouse embryos using magnetic resonance have typically involved catheterizing the umbilical vein, and perfusing the embryo with a fixative and magnetic resonance contrast agent (Smith et al. 1994; Smith, 2000, Smith, 2001). This enhances contrast and allows the assessment of embryonic cardiovascular anatomy and cardiovascular malformations (Huang et al. 1998), but is technically difficult and requires significant amounts of operator time per embryo. More recently, Dhenain et al. (2001) reported the imaging of paraformaldehyde-fixed normal mouse embryos, and in a 15.5-day embryo were able to image the spinal cord, dorsal roots, vertebral bodies, lungs, and the heart and its chambers. These studies required a data acquisition time of 36 h per embryo. Overall, these constraints on operator skill and imaging time have been relative disadvantages for the application of magnetic resonance imaging as a phenotyping tool to complement high-throughput mutagenesis strategies.
These previously reported magnetic resonance studies have typically used spin-echo sequences. We have developed a T1-weighted gradient echo sequence magnetic resonance approach for imaging paraformaldehyde-fixed mouse embryos, and have shown that it has high reproducibility for qualitative and quantitative results which exhibit the best spatial resolution with the shortest experimental time reported to date for mouse embryos of this stage (Schneider et al. 2003a). We have used fast gradient echo MRI to identify normal and abnormal cardiac development in mouse embryos (Schneider et al. 2003b). Here we show that we can use this technique to obtain high-resolution images of normal embryonic organs, and identify neural and adrenal malformations in embryos lacking the transcriptional coactivator Cited2, in which we and others have previously reported these abnormalities (Bamforth et al. 2001; Barbera et al. 2002; Yin et al. 2002).
Materials and methods
Embryos
Embryos (a total of two wild-type and four Cited2−/−) were dissected out at 15.5 days post coitum, and genotyped as described previously (Bamforth et al. 2001). They were fixed in 4% paraformaldehyde in phosphate-buffered saline at 4 °C for 2–4 weeks.
Magnetic resonance imaging
Embryos were individually embedded in nuclear magnetic resonance tubes using 1% agarose (Seakem) containing 2 mm gadolinium–diethylenetriamine pentaacetic anhydride (Gd-DTPA, a paramagnetic contrast agent) with their antero-posterior axis approximately orientated parallel to the long axis of the tubes. Magnetic resonance imaging terminology has been summarized in a recent publication to which the reader is referred (Dhenain et al. 2001). Imaging experiments were carried out on an 11.7-Tesla (500 MHz) vertical magnet (Magnex Scientific, Oxon, UK) that was interfaced to a Bruker Avance spectrometer (Bruker Medical, Ettlingen, Germany). It was equipped with a shielded gradient system with a maximal gradient strength of 548 mTesla m−1 (Magnex Scientific), and a quadrature-driven birdcage coil with an inner diameter of 13 mm (Rapid Biomedical, Würzburg, Germany) was used. Heating induced by the gradient was minimized using compressed air at room temperature. A 3-D spoiled gradient echo sequence (echo time of 10 ms, π/2 excitation pulse (rectangular pulse shape, π/2 = 100 µs), repetition time of 30 ms) was used. This resulted in a matrix size of 512 × 512 × 768 (bandwidth: 130 Hz pixel−1) at a field of view of 13 × 13 × 20 mm, and achieved a nearly isotropic experimental resolution of 25 × 25 × 26 µm. The total experimental time was less than 9 h. Each phase encoding step was averaged four times.
Data reconstruction
The data sets were reconstructed using purpose-written C-software. This applied isotropic zero-filling (1024 points in each dimension) and a modified third-order Butterworth filter (Gonzalez & Wintz, 1983) function before Fourier transformation, and resulted in 1024 transverse axial 16-bit resolution per pixel 2-D TIFF format images. After zero-filling a final voxel size of 13 × 13 × 20 µm was achieved.
Data analysis
A commercial software package (AmiraTM 2.3 TGS Europe, Mérignac Cedex, France) running on a Microsoft Windows 2000 workstation (Dell Systems) was used to analyse the TIFF images. Each structure was identified by reference to The Atlas of Mouse Development (Kaufman, 1994), and by establishing their anatomic continuity in transverse, sagittal and coronal views. This analysis was done using the OrthoSlice and ObliqueSlice modules, and the Image Segmentation Editor tool in AmiraTM 2.3. The 3-D reconstruction (Fig. 1b) was created by using the threshold detection ‘magic-wand’ function in the Image Segmentation Editor tool to label voxels corresponding to the embryo. The Generalized Marching Cubes surface rendering module in AmiraTM 2.3 was used to generate a 3-D rendering of the embryo from the labelled voxel data.
Fig. 1.
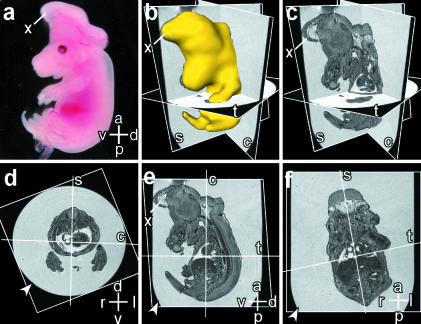
Magnetic resonance imaging (MRI) microscopy allows simultaneous visualization of embryo sections and structures in multiple axes. Axes: d – dorsal; v – ventral; r – right; l – left; a – anterior; p – posterior. (a) Photograph of a Cited2−/− embryo (No. 1051) at 15.5 days post coitum (dpc) showing exencephaly. An abnormal structure (x) which is the eventrated neuroectoderm is seen, and is also indicated in panels b, c and e. (b) 3-D reconstruction of this embryo from the MRI dataset, showing transverse (t), sagittal (s), and coronal (c) axial planes. (c) Axial planes with the 3-D reconstruction removed. (d–f) The transverse, sagittal and coronal axial planes in 1c are shown en face. The wall of the nuclear magnetic resonance (NMR) tube is indicated by the arrowhead in each panel, and axial planes are indicated by the white lines. Enlarged images from this embryo are shown in Fig. 2(e)–(h).
Histological sections
After removal from the agarose plug, the embryos were dehydrated in ethanol, and embedded in paraffin wax and sectioned (7 µm thick) as usual. All sections were mounted, stained with haematoxylin and eosin, and examined using a Nikon Eclipse E600 microscope. Images were captured using a Nikon Coolpix 995 digital camera.
Results
We studied four transgenic embryos lacking Cited2 and two wild-type embryos at 15.5 days post coitum (dpc), as many major organs can be clearly identified at this stage (Kaufman, 1994). The analysis of the embryo magnetic resonance data set was performed without knowledge of the genotype, but as Cited2−/− embryos have a remarkable phenotype (exencephaly and adrenal agenesis), it was easy to predict the genotype while the images were being viewed. After analysis of the magnetic resonance images we examined stained sections of the embryos to verify the imaging data.
Analysis of the 3-D MRI dataset using the Oblique-Slice function in Amira™ 2.3 allows the visualization of a slice obtained in any user-defined orientation plane (Fig. 1). This is particularly useful for obtaining standard orthogonal axial slices from embryos that were not correctly positioned while being embedded in agarose. This is shown in Fig. 1(d), where the embryo was accidentally tilted relative to the long axis of the tube during the embedding procedure. Thus even from a tilted embryo we were able to visualize images obtained in the correct orthogonal axes. We first identified and labelled each structure in the transverse axial images with reference to the transverse sections in the Atlas of Mouse Development (Kaufman, 1994). By following the anatomic continuity of each structure from the transverse to sagittal, and from transverse to coronal images (by viewing each structure simultaneously in the indicated planes) we were able to identify and label each structure in the sagittal and coronal planes. This was important, as the Atlas of Mouse Development contains relatively few examples of sagittal or coronal sections.
Neural anatomy and malformations
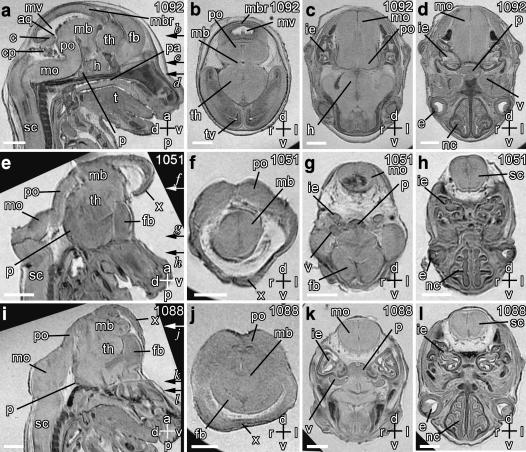
In wild type embryos (Fig. 2a–d) we were able to clearly visualize the spinal cord, medulla oblongata, pons, trigeminal ganglia, cerebellum, mid-brain, mid-brain roof, hypothalamus, thalamus and forebrain. We were also able to clearly see the telencephalic vesicles, the mesencephalic vesicle, the aqueduct of Sylvius and the choroid plexus. Consistent with previous observations (Bamforth et al. 2001; Barbera et al. 2002), two of the four Cited2−/− embryos had visible exencephaly. In these embryos (Fig. 2e–l), we found a grossly malformed brain that lacked the cerebellum, midbrain roof, the mesencephalic vesicle and 4th ventricle. An abnormal structure (‘x’) was also noted that had similar contrast to adjacent neural tissue. This probably represents the everted neuroectoderm of the midbrain and hind brain that surrounds the telencephalic vesicle (Barbera et al. 2002).
Fig. 2.
Magnetic resonance microscopy of normal and abnormal brain development. Scale bars = 1 mm, axes: d – dorsal; v – ventral; r – right; l – left; a – anterior; p – posterior. Individual embryo numbers are indicated at the top right in each panel. (a) Sagittal midline section through a wild-type normal embryo showing the spinal cord (sc), medulla oblongata (mo), cerebellum (c), pons (po), midbrain (mb), midbrain roof (mbr), hypothalamus (h), developing pituitary gland (p), thalamus (th), and forebrain (fb). Also seen are the mesencephalic vesicle (mv), the aqueduct of Sylvius (aq), the choroid plexus (cp) in the fourth ventricle, palate (pa), and the tongue (t). (b–d) Transverse sections through the planes indicated by arrows in panel a also show the telencephalic vesicle (tv), the inner ear (ie), the eyes (e), the trigeminal ganglia (v) and the nasal cavity (nc). (e–l) Sagittal (e,i) and transverse (f–h, j–l) sections through two Cited2−/− embryos showing exencephaly, which begins at the junction of the spinal cord and medulla. The transverse section planes are indicated by arrows in panels e and i. In both embryos, the midbrain roof and cerebellum are absent. The abnormal structure (x) is continuous with the mid-brain region, and represents the everted neuroectoderm.
Identification of normal organs
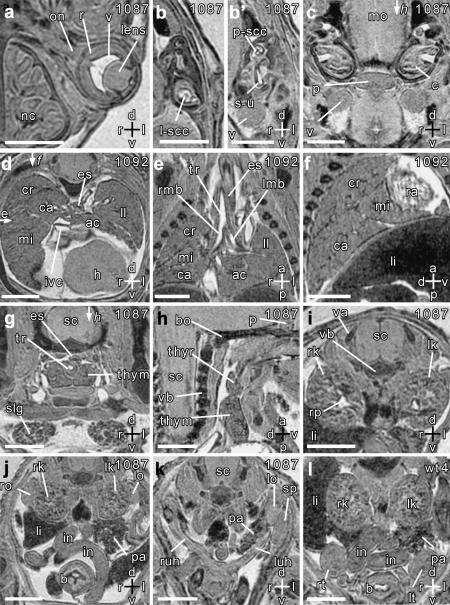
As abnormal organogenesis is a feature of many embryonic lethal malformations (reviewed in Copp, 1995), we examined the ability of magnetic resonance microscopy to identify normal organs. In sections through the head (Fig. 3a–c) we were able to identify the developing eyes, inner ear and nasal cavities. In the eye we could clearly distinguish the optic nerve, retina, vitreous and lens, and in the inner ear, the semicircular canals, saccule, utricle and cochlea. Examination of thoracic images (Fig. 3d–f) revealed the trachea, and its branches, the right and left main bronchi. We were also able to identify the four lobes of the right lung. This is important for defining the anatomical right lung and identifying embryos with pulmonary heterotaxy or isomerism (Capdevila et al. 2000). In the neck (Fig. 3g,h), we could identify the developing thymus, thyroid and salivary glands.
Fig. 3.
Magnetic resonance microscopy of normal embryonic organ development. Scale bars = 1 mm, axes: d – dorsal; v – ventral; r – right; l – left; a – anterior; p – posterior. Individual embryo numbers are indicated at the top right of each panel. (a) Transverse section through the left eye, showing the optic nerve (on), retina (r), vitreous (v) and lens. The nasal cavity (nc) is also seen. (b,b′) Transverse sections through the left inner ear showing the lateral semicircular canal (l-scc), saccule and utricle (s-u), and posterior semicircular canal (p-scc). (c) Transverse section through the developing pituitary gland (p). Also seen are the medulla oblongata (mo), cochlea (c) and the trigeminal ganglion (v). (d–f) Transverse, coronal and sagittal sections showing the left lung (ll), and the cranial (cr), caudal (ca), middle (mi) and accessory (ac) lobes of the right lung. The section planes for the coronal and sagittal sections are shown by arrows in panel d. The coronal section (e) shows the trachea (tr) and its branches, the right and left main bronchi (rmb and lmb). The sagittal section (f) is through the right lung, and fissures separating the lobes are clearly seen. Also seen in these sections are the inferior vena cava (ivc), right atrium (ra), liver (li), oesophagus (es) and the diaphragmatic surface of the heart (h). (g) Transverse section showing the two lobes of the thymus gland (thym), spinal cord (sc), oesophagus (es), trachea (tr) and the salivary glands (slg). (h) Sagittal section through the planes indicated by arrows in panels c and g, showing the left thymus (thym), and thyroid (thyr) lobes, and the pituitary gland (p). The developing vertebral bodies (vb) and basioccipital bone (bo) are also seen. (i) Transverse section through the middle of the right and left kidneys (rk and lk) showing the renal pelvis (rp). Note also the developing vertebral body (vb) and the vertebral arches (va). (j) Transverse section through the lower pole of the kidneys showing the right and left ovaries (ro and lo). Also seen are the liver (li), pancreas (pa), intestines (in) and bladder (b). (k) Transverse section through the lower abdomen showing right and left uterine horns (ruh and luh). Also seen are the left ovary (lo), the spleen (sp) and pancreas (pa). (l) Transverse section through the lower abdomen of another embryo (male) showing the right and left testes (rt and lt), bladder (b), intestines (in), kidneys (rk and lk) and pancreas (pa).
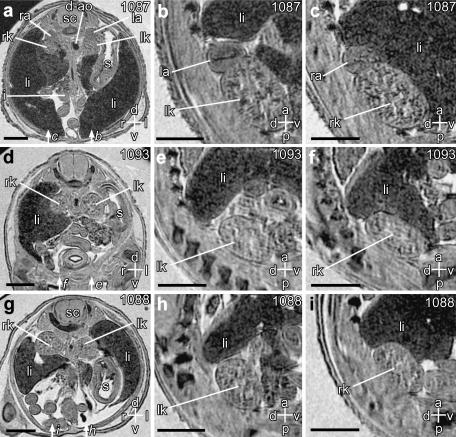
In the abdomen (Fig. 3I–l) we could clearly identify the pancreas, ovaries, spleen and testes, uterine horns, and the urinary bladder. We were also able to identify elements of the developing skeleton, for instance the vertebral bodies, vertebral arches, and the basioccipital bone (Fig. 3h). The stomach was clearly visible on the left (Fig. 4a), and could be followed through into the intestines. This was important for distinguishing the intestines from the ovaries, spleen and testes, which had similar contrast. The position of the stomach is also important for determining visceral situs (i.e. inversus or solitus) in embryos with left–right axis inversion (Capdevila et al. 2000). The adrenal glands were clearly visible adjacent to the upper poles of the kidneys (Fig. 4a–c). Consistent with previous observations (Bamforth et al. 2001), we found that the adrenals were absent bilaterally in all Cited2−/− embryos studied (Fig. 4d–i).
Fig. 4.
Magnetic resonance microscopy of normal adrenal glands, and identification of adrenal agenesis. Scale bars = 1 mm; axes: d – dorsal; v – ventral; r – right; l – left; a – anterior; p – posterior. Individual embryo numbers are indicated at the top right of each panel. (a) Transverse section through the abdomen of a wild-type embryo showing the upper poles of the left and right kidneys (lk, rk), and the left and right adrenal glands (la, ra). Also seen are the spinal cord (sc), descending aorta (d-ao), stomach (s), intestines (i) and liver (li). (b,c) Sagittal sections through the left and right kidneys and adrenals, respectively. The section planes are indicated by the arrows in panel a. (d–i) Corresponding transverse sections from two Cited2−/− embryos (d,g), showing complete and bilateral absence of adrenal glands. This is also noted on the sagittal sections through the kidneys (e,f,h,i), the planes of which are indicated in panels d and g.
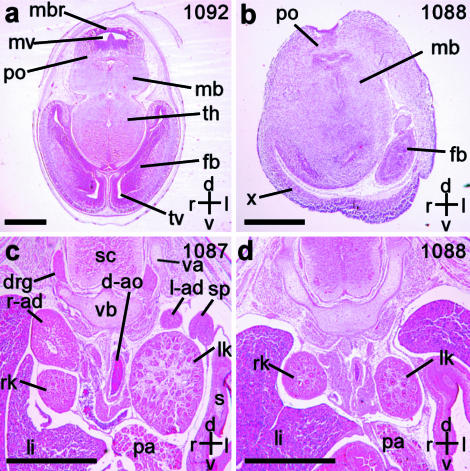
We next examined stained sections of the embryos to validate the malformations identified in the imaging studies (Fig. 5). This showed that we had correctly assigned all embryonic abnormalities, such as the neural (Fig. 5b), and the adrenal defects (Fig. 5d). Sectioning also confirmed that the abnormal structure ‘x’, identified by magnetic resonance imaging (Fig. 2e,j) consists of neural tissue (Fig. 5b), and thus represents the everted neuroectoderm of the midbrain and hind brain that surrounds the telencephalic vesicle (Barbera et al. 2002).
Fig. 5.
Hematoxylin and eosin stained transverse sections of the embryos studied by magnetic resonance microscopy. Scale bars = 1 mm; axes: d – dorsal; v – ventral; r – right; l – left. Individual embryo numbers are indicated at the top right in each panel. (a) Wild-type embryo, corresponding to the image in Fig. 2(b), showing the midbrain roof (mbr), mesencephalic vesicle (mv), pons (po), midbrain (mb), thalamus (th), forebrain (fb) and telencephalic vesicle (tv). (b) Cited2−/− embryo corresponding to Fig. 2(j). The midbrain roof is absent, and instead, the eventrated neuroectoderm ‘x’ is seen. (c) Wild-type embryo corresponding to the image in Fig. 4(a). The right and left adrenal glands (r-ad, l-ad) are seen adjacent to the upper poles of the right and left kidneys (rk and lk). Also seen are the spinal cord (sc), descending aorta (d-ao), stomach (s), liver (li), pancreas (pa), spleen (sp), vertebral body (vb), vertebral arches (va) and dorsal root ganglia (drg). (d) Cited2−/− embryo corresponding to Fig. 4(g), confirming the absence of adrenal glands.
Discussion
We have shown that it is possible to rapidly (i.e. in unattended overnight imaging runs) obtain high-resolution magnetic resonance images of paraformaldehyde-fixed embryos using a spoiled gradient echo sequence. A remarkable advantage of this technique over traditional histology is that it acquires a true 3-D dataset, allowing analysis of the embryo in any user-defined orientation. We were thus able to simultaneously view embryonic structures in all three standard orthogonal planes, regardless of the original position of the embryo, facilitating identification of normal and abnormal structures. In contrast, accidental malpositioning of the embryo during wax embedding results in sections being cut at an angle, hampering interpretation of developmental malformations.
Using this approach, we successfully identified developmental malformations in late gestation mouse embryos with minimal operator effort and time. These included neural abnormalities (such as cerebellar and midbrain roof agenesis, and everted neuroectoderm) and adrenal agenesis. We have also successfully identified cardiac malformations in Cited2 knockout embryos using magnetic resonance imaging (Schneider et al. 2003b). The resolution was high enough for us to identify most organs (including small ones such as the pituitary, adrenal and thyroid glands) that are visible at this stage of development. We could also identify the pulmonary lobes, which is important for defining the anatomical right lung and identifying embryos with pulmonary heterotaxy or isomerism (Capdevila et al. 2000).
All developmental abnormalities detected by MRI in the Cited2 knockout embryos at 15.5 dpc were confirmed by conventional histology. Even so, another aspect of the phenotype, the fused cranial ganglia (Bamforth et al. 2001), clearly visible by immunohistochemical staining at 10.5 dpc, could not be confidently detected at 15.5 dpc with this method. A striking advantage of MRI over standard histology was illustrated by the clear imaging of the oedema present in a proportion of the Cited2 knockout embryos. Owing to the dehydration procedure required for sectioning, this feature was greatly diminished (data not shown).
Although the equipment required is relatively expensive, magnetic resonance imaging is growing in popularity as a tool for physiological studies, which are typically carried out during the day. The short run time required for embryo imaging allows the acquisition of complete datasets in unattended overnight runs, and maximizes magnet usage. An added advantage is the minimal ‘hands-on’ operator time (less than one hour) required for the acquisition of a complete data set. Moreover, to use magnetic resonance microscopy as a screening tool as required in the mutagenesis process, the spatial resolution used for this study, may not be required, and this will reduce experimental time, and increase throughput. Specimens of particular interest could then subsequently be imaged at the highest resolution available. Furthermore, as magnetic resonance microscopy is non-invasive, abnormal embryos can subsequently be sectioned and stained using standard techniques or, alternatively, studied using the episcopic fluorescence image capture (EFIC) technique referred to earlier (Weninger & Mohun, 2002).
We believe that this method is particularly suitable to three-generation recessive screens for embryonic malformations where typically far fewer specimens (e.g. < 100 G1 males) are studied than in dominant high-throughput screens (Kasarskis et al. 1998; Herron et al. 2002). These studies typically rely upon identifying visible external embryonic malformations. Clearly many internal malformations without visible external phenotypes (e.g. adrenal agenesis) will be missed by a visual examination alone. Importantly, adrenal agenesis was not reported in mice lacking Cited2 using the EFIC technique (Weninger & Mohun, 2002), but was clearly detected using MRI. Hence a technique such as MRI that allows efficient internal examination will be a powerful adjunct in this type of screen. It must be stressed that although MRI has advantages over histology as a fast screening application, it cannot substitute for histology where cellular detail of tissue structure is required, as, at least in its current mode, the resolution is supracellular.
Thus magnetic resonance microscopy appears to be particularly suitable for identifying developmental malformations in post-organogenesis stage embryos with lethal mutations. In embryos with specific gene-targeted mutations, a complete and systematic examination would reduce the chance of an unexpected defect (e.g. adrenal agenesis) being missed. Moreover, magnetic resonance imaging should be particularly useful for rapidly identifying developmental malformations in high-throughput recessive mutagenesis screens (e.g. Kasarskis et al. 1998; Justice et al. 1999; Herron et al. 2002) where a large number of embryos need to be screened. It also has potential for rapidly determining the nature, type and frequency of developmental malformations that occur as a result of maternal exposure to teratogenic drugs or environmental toxins, another situation where a large number of embryos need to be studied (Dellarco & Kimmel, 1997). Furthermore, embryonic magnetic resonance imaging has the potential of being a powerful tool in studies designed to identify pharmacological interventions, e.g. folate (Barbera et al. 2002), or environmental factors that affect the incidence of developmental malformations in defined mouse models.
Acknowledgments
S.D.B. and J.E.S. contributed equally to this work. We thank Andrew Copp for advice on the interpretation of the neural malformations, Ruth Arkell and Graeme Waddington for helpful discussions, and Jenny Corrigan for the embryo sections. These studies were funded by the British Heart Foundation and the Wellcome Trust. S.B. is a Wellcome Trust Senior Fellow in Clinical Science.
References
- Bamforth SD, Braganca J, Eloranta JJ, Murdoch JN, Marques FI, Kranc KR, et al. Cardiac malformations, adrenal agenesis, neural crest defects and exencephaly in mice lacking Cited2, a new Tfap2 co-activator. Nat. Genet. 2001;29:469–474. doi: 10.1038/ng768. [DOI] [PubMed] [Google Scholar]
- Barbera JP, Rodriguez TA, Greene ND, Weninger WJ, Simeone A, Copp AJ, et al. Folic acid prevents exencephaly in Cited2 deficient mice. Hum. Mol. Genet. 2002;11:283–293. doi: 10.1093/hmg/11.3.283. [DOI] [PubMed] [Google Scholar]
- Capdevila J, Vogan KJ, Tabin CJ, Izpisua Belmonte JC. Mechanisms of left-right determination in vertebrates. Cell. 2000;101:9–21. doi: 10.1016/S0092-8674(00)80619-4. [DOI] [PubMed] [Google Scholar]
- Copp AJ. Death before birth: clues from gene knockouts and mutations. Trends Genet. 1995;11:87–93. doi: 10.1016/S0168-9525(00)89008-3. [DOI] [PubMed] [Google Scholar]
- Dellarco VL, Kimmel CA. Risk assessment of environmental agents for developmental toxicity: current and emerging approaches. Mutat. Res. 1997;396:205–218. doi: 10.1016/s0027-5107(97)00185-1. [DOI] [PubMed] [Google Scholar]
- Dhenain M, Ruffins SW, Jacobs RE. Three-dimensional digital mouse atlas using high-resolution MRI. Dev. Biol. 2001;232:458–470. doi: 10.1006/dbio.2001.0189. [DOI] [PubMed] [Google Scholar]
- Gonzalez RC, Wintz P. Digital Image Processing. Reading, MA: Addison-Wesley Co.; 1983. [Google Scholar]
- Herron BJ, Lu W, Rao C, Liu S, Peters H, Bronson RT, et al. Efficient generation and mapping of recessive developmental mutations using ENU mutagenesis. Nat. Genet. 2002;30:185–189. doi: 10.1038/ng812. [DOI] [PubMed] [Google Scholar]
- Huang GY, Wessels A, Smith BR, Linask KK, Ewart JL, Lo CW. Alteration in connexin 43 gap junction gene dosage impairs conotruncal heart development. Dev. Biol. 1998;198:32–44. doi: 10.1006/dbio.1998.8891. [DOI] [PubMed] [Google Scholar]
- Justice MJ, Noveroske JK, Weber JS, Zheng B, Bradley A. Mouse ENU mutagenesis. Hum. Mol. Genet. 1999;8:1955–1963. doi: 10.1093/hmg/8.10.1955. [DOI] [PubMed] [Google Scholar]
- Kasarskis A, Manova K, Anderson KV. A phenotype-based screen for embryonic lethal mutations in the mouse. Proc. Natl Acad. Sci. USA. 1998;95:7485–7490. doi: 10.1073/pnas.95.13.7485. [DOI] [PMC free article] [PubMed] [Google Scholar]
- Kaufman MH. The Atlas of Mouse Development. London: Academic Press.; 1994. [Google Scholar]
- Lander ES, Linton LM, Birren B, Nusbaum C, Zody MC, Baldwin J, et al. Initial sequencing and analysis of the human genome. Nature. 2001;409:860–921. doi: 10.1038/35057062. [DOI] [PubMed] [Google Scholar]
- Schneider JE, Bamforth SD, Farthing CR, Clarke K, Neubauer S, Bhattacharya S. Rapid identification and 3-D reconstruction of complex cardiac malformations in transgenic mouse embryos using fast gradient echo sequence magnetic resonance imaging. J. Mol. Cell Cardiol. 2003b doi: 10.1016/s0022-2828(02)00291-2. in press. [DOI] [PubMed] [Google Scholar]
- Schneider JE, Bamforth SD, Grieve SM, Clarke K, Bhattacharya S, Neubauer S. High-resolution, high-throughput magnetic resonance imaging of mouse embryonic anatomy using a fast gradient echo sequence. Magma. 2003a doi: 10.1007/s10334-003-0002-z. in press. [DOI] [PubMed] [Google Scholar]
- Sharpe J, Ahlgren U, Perry P, Hill B, Ross A, Hecksher-Sorensen J, et al. Optical projection tomography as a tool for 3D microscopy and gene expression studies. Science. 2002;296:541–545. doi: 10.1126/science.1068206. [DOI] [PubMed] [Google Scholar]
- Smith BR, Johnson GA, Groman EV, Linney E. Magnetic resonance microscopy of mouse embryos. Proc. Natl Acad. Sci. USA. 1994;91:3530–3353. doi: 10.1073/pnas.91.9.3530. [DOI] [PMC free article] [PubMed] [Google Scholar]
- Smith BR. Magnetic resonance imaging analysis of embryos. In: Lo CW, editor. Developmental Biology Protocols. Totawa, NJ: Humana Press Inc.; 2000. pp. 211–216. [DOI] [PubMed] [Google Scholar]
- Smith BR. Magnetic resonance microscopy in cardiac development. Microsc. Res. Tech. 2001;52:323–330. doi: 10.1002/1097-0029(20010201)52:3<323::AID-JEMT1016>3.0.CO;2-F. [DOI] [PubMed] [Google Scholar]
- Weninger WJ, Mohun T. Phenotyping transgenic embryos: a rapid 3-D screening method based on episcopic fluorescence image capturing. Nat. Genet. 2002;30:59–65. doi: 10.1038/ng785. [DOI] [PubMed] [Google Scholar]
- Yin Z, Haynie J, Yang X, Han B, Kiatchoosakun S, Restivo J, et al. The essential role of Cited2, a negative regulator for HIF-1α, in heart development and neurulation. Proc. Natl Acad. Sci. USA. 2002;99:10488–10493. doi: 10.1073/pnas.162371799. [DOI] [PMC free article] [PubMed] [Google Scholar]


