Abstract
Three-dimensional (3D) study of cancellous bone tissue organization is necessary to understand how modelling and remodelling processes regulate bone structure and connectivity. It requires imaging methods that have both sufficient resolution power and width and depth of field. Since clinical imaging methods fall far short of the first requirement, we can only study prepared tissue in isolation from the body. Scanning electron microscopy (SEM) of macerated plane parallel slices is the most productive method, but we meet special technical problems in imaging porous bone because samples need to be relatively thick to maintain both continuity and context. Problems due to charging under the electron beam can be controlled by imaging with only high-energy backscattered electrons (BSE). This gives an important additional benefit that the direction of apparent illumination can be manipulated by positioning the detector, and multiple detector positions can be employed strategically to generate images in which colour is used to help in coding surface morphology. However, we next confront the difficulty of the limited depth of field. This can be improved by taking series of images, moving the sample along the electron optic axis, and combining these to generate a single extended-focus image. SEM imaging geometry gives a change in magnification with change of working distance, and it is shown that this must be corrected for each image of the through-focus sequence. Colour coding the lighting direction and increasing the depth of field are approaches that can be combined, and are well matched to the possibilities offered by communication by digital data projection. Finally, the latter means also offer another powerful technique for 3D representation through the display of through tilt image sequences. The novel routines considered here are generally applicable to all classes of microanatomical SEM sample.
Keywords: 3D imaging, bone, increased field depth, osteoporosis, scanning electron microscopy
Introduction
Scanning electron microscopy of unembedded tissue is now a very well known – if not so well understood – imaging ‘method’. In reality, the SEM is much more of a toolbox than a single tool, but its contents are not well exploited in microanatomical research. The majority of work is conducted using dried samples, though negative and positive plastic replicas, frozen-wet and damp-wet tissue can also be imaged. Soft tissues are mostly water, and when dehydrated have a very low density. In conventional biomedical SEM, a heavy metal coating is applied to increase the electron scattering and low-energy secondary electron (SE) generation at the sample surface. SE imaging is by far the commonest imaging mode, although it is the most sensitive to beam-induced electrostatic charging and spontaneous discharging phenomena. It is also a strange imaging mode, in that SE can leave the surface travelling in any possible direction, yet their paths are bent towards the charged grid which forms the first element of the detector system. Thus there is only a small component of information relating to the orientation of the sample surface facet with respect to the SE collector. The strongest signal variation derives from the local slope of the surface with respect to the overall surface and the electron beam direction. All edges of all ridges and spikes appear bright.
The possibility of using the direct optical fluorescence (cathodoluminescence, CL) of a labelled phase under electron beam bombardment has been hardly been touched in our field, although CL of a scintillator material is exploited in the signal conversion train of SE imaging. Against this, attempts to image using element-characteristic X-radiation from biomedical samples have been all too common, regrettably omitting to observe the very poor spatial discrimination which must result with a bulk, dried biological tissue sample with this approach.
Much recent previous work from our own laboratories and of others with similar interests has exploited quantitative imaging using fast backscattered electrons (qBSE). Here, the aim has been avoid the influence of any form of topography upon the generation of image contrast. To this end, the samples are embedded in plastic and machined by grinding and polishing or by diamond micromilling to achieve a flat surface. Variations in the mineral content in the calcified skeletal and dental tissues can be quantified by measuring the BSE signal under closely standardized conditions.
In much earlier work, we generated three-dimensional (3D) data by recording two (or more) images of the same field of view for stereoscopic (or pseudo-hologram viewing) and 3D measurements from stereophoto-grammetry, mostly using SE imaging. SE detectors are stunningly efficient. Finely focused beams of low convergence and large depth of field at long working distances make for easy acquisition of stereo images. The SE image is so out of the ordinary that serious conceptual morphological errors will arise if the true 3D scene is not seen. Thus it is curious that most SE SEM users in the developmental and cell biology and anatomical fields shrink from the presentation of 3D data.
It is also bizarre that fast electron detectors are not widely used in our field, now that they are commonly available. The standard gold-coated SEM sample used for SE imaging gives more than enough signal in the BSE mode. (The bone or tooth sample is dense enough in its own right and can be efficiently and cheaply coated with evaporated carbon.) With BSE imaging, we can nicely evade the aforementioned peculiar disadvantages of SE, namely edge brightness, lack of spatial cues from direction of ‘illumination’ and linear image disruption by discharging.
This paper extols and attempts to illustrate the virtues of morphological (topographical) BSE imaging. It discusses a set of related imaging methods that have been evolved to generate insights into calcified tissue structure and development, but are generally applicable and useful for all samples with complex 3D shapes. They assume the use of an automated digital SEM: they can be used separately or in conjunction and deserve dynamic data display.
We both frustrate ‘charging’ and obtain directionality of apparent illumination direction by using only fast backscattered electrons (BSE). In BSE SEM, the detector appears to be the source of illumination. Images conveying directional information about 3D morphology can be made by combining recordings made with separate detector positions. Convenient means are to use either a single detector moved to three contrasting positions, equivalent to lighting sources at different obliquities, or three sectors of an on-axis annular detector. In both cases, three stored images are combined as red, green and blue components in a composite colour image.
The depth of field of the SEM is insufficient for porotic bone and many other classes of microanatomical sample, especially when imaged using BSE. To increase field depth, a series of images is recorded, moving the sample towards the detector. The SEM projection is perspective, and apparent size changes as the sample is moved axially. The images are scaled to match the magnification to that of the last in the series, and processed to extract an image that is in focus from back to front.
Digital imaging further makes it possible and desirable to record through tilt series that give powerful 3D impression when played back as a ‘movie’.
Materials
Bone samples, whether of small or large mammal origin, are preserved until processing by deep freezing or fixation in 70% ethanol. Regions of interest are exposed by sawing with water-cooled diamond saws, and/or by fine grinding and polishing using silicon-carbide-coated abrasive paper under water, or by freeze polishing against dry abrasive paper over a liquid-nitrogen-cooled, massive metal block. Typically, all external and internal soft tissue elements are removed by digestion using a commercial, bacterial pronase enzyme-based, alkaline detergent (Tergazyme, Alconox Inc., New York, NY, USA) or 0.05 m NaOH at 50 °C. Samples are washed, dehydrated in ethanol, dried, coated from both sides by carbon by evaporation and held using small conical pegs of conductive carbon putty, typically several millimetres above a surface covered with carbon (conductive tape) to provide a detail-free background (Figs 1–5 = panels a–x).
Fig. 1.
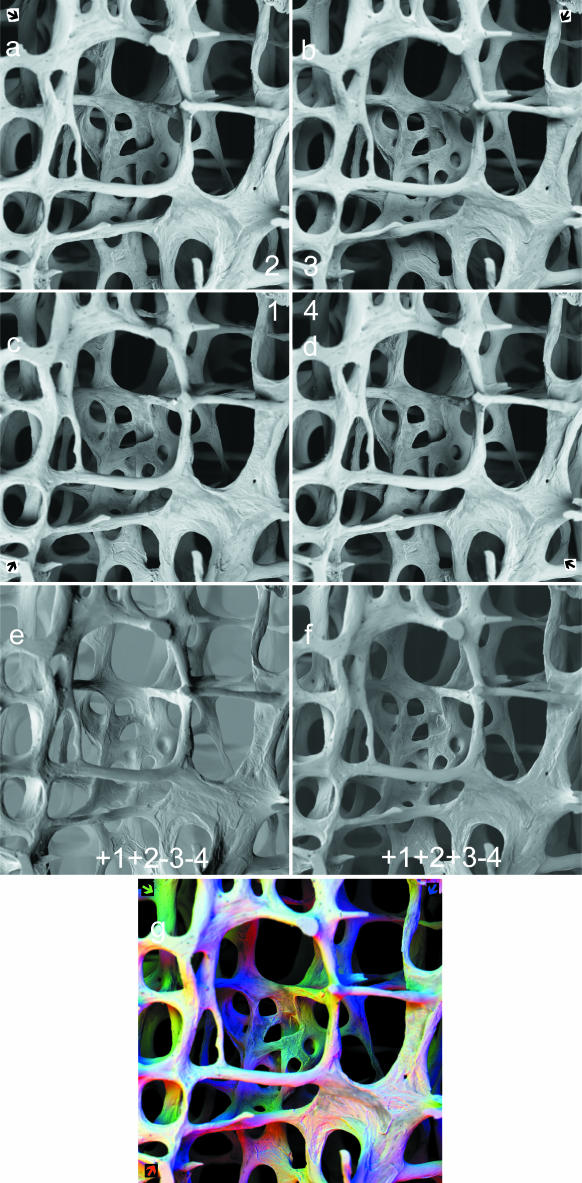
panels a–g: 90° sectors of annular solid-state BSE detector. 30 kV BSE scanning electron micrographs of 68-year-old human female L4 vertebral body trabecular bone (vertical slice cleaned of cells and coated with evaporated carbon to make it electrically conductive): secondary hyperparathyroidism of chronic renal failure accounts for patches of new, fine-trabecular bone and of superficial unmineralized ‘osteoid’ appearing darker in a–d and grey in g. Field width = 2.23 mm. Working distance from final lens (WD) = 25 mm: detector is 4.5 mm thick, 0.5 mm from lens. Thus sample to detector distance in this case = 19 mm. a–d: Top four panels: sector 1,2,3,4 BSE images of same field at same focus level in panels c,a,b,d, respectively, sector number in centre corner of cluster, arrow showing direction of apparent illumination due to that sector in outer corners. e: Lower left (1 + 2) – (3 + 4). f: Lower right + 1 + 2 + 3 – 4. panel g: R = 1↗, G = 2, B = 3 combination of panels c,a,b, respectively. Coloured arrows show direction of apparent illumination due to three 90° sectors.
Fig. 5.
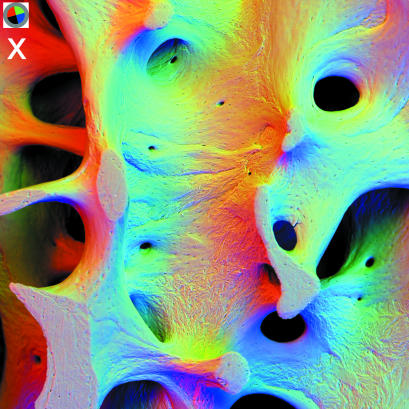
panel x: 90° sectors of annular solid state BSE detector. 20 kV BSE scanning electron micrographs of 31-year-old human male L4 vertebral body trabecular bone (vertical slice cleaned of cells and coated with evaporated carbon to make it electrically conductive). Field width = 2.70 mm, WD = 21 mm. Inset top left shows position of active detector sectors, i.e. direction of apparent illumination due to three 90° sectors. R = 2, G = 3, B = 4.
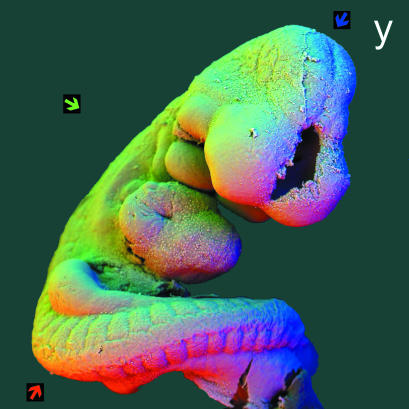
Soft tissue samples are fixed in cacodylate-buffered glutaraldehyde (postfixed in OsO4), dehydrated to ethanol, substituted with Freon 113, and critical point dried via carbon dioxide, mounted, and gold sputter coated (Fig. 6 = colour plate panel y).
Fig. 6.
panel y: 90° sectors of annular solid-state BSE detector, to demonstrate that methods also work for conventionally prepared biological soft tissue SEM samples. 30 kV BSE scanning electron micrograph of 9-day post-fertilization mouse embryo, fixed in 3% glutaraldehyde in 0.2 m cacodylate buffer, post-fixed in 3% osmium tetroxide in same buffer, both for 16 h, dehydrated in ethanol, substituted with Freon-113 and critical point dried from carbon dioxide, mounted on spherical Aluminium rivet, sputter coated with gold. Fieldwidth = 1.85 mm. WD = 17 mm. Three of 4 angular sectors of an annular detector were used to obtain three different images which were then used to synthesize a colour image: coloured arrows show directions of apparent illumination. R = 1, G = 2, B = 3.
Methods
Detector types
By analogy with ordinary learned experience from the real world, a BSE detector appears to be a source of illumination in SEM (Reimer & Pfefferkorn, 1973; Wells, 1974; Goldstein & Yakowitz, 1975). This is partly true for SE detectors too, but the sample itself appears to be self-luminous in respect of edge brightness. Dedicated BSE detectors in those SEMs which have them are most commonly of three main types: (1) scintillator; (2) two-sector, annular solid state; and (3) four-sector, annular solid state (all Figures in this paper).
A–B
Two-sector annular detectors are in widespread use for ‘A minus B’, also commonly called ‘topographic BSE’ imaging, where a single, live, running difference signal between the two halves of the subtended field of view of detection is used. A–B images are also strange: we have no everyday experience of ‘black lighting’, which is the effect generated by the inverted or negative sector. Thus there is little use for this method in biological morphological imaging, although it is well known in materials science applications of SEM. The four-sector detectors can be used in the same way (Fig. 1a–d), employing two opposing sectors or sector pairs (Fig. 1e).
1 + 2 + 3(−4)
A generally useful morphological imaging mode with the four-sector device set to one sector negative, or inactive: if the sectors are named 1234, such images are called +123–4 (Fig. 1f) or +123, respectively, to distinguish them from +1234. Of course, it should be borne in mind that any rough object will generate topographic contrast: the +ALL is equivalent to ring (flash) illumination in ordinary photography.
Changing single detector position
The scintillator BSE detector is the oldest type (but may be of modern manufacture) and can only be used for the purposes considered herein if it can be moved towards and away from the electron beam axis (the author has used this type, but it is not illustrated here). The movement option is provided in order to house it out of harm's way when not in use. The two-sector solid-state device may also be movable in some SEM configurations: it can be used as one single detector in contrasting on- and off-axis positions to acquire separate images. The four-sector devices are usually movable in most SEM configurations. Again, they can be used as one single detector in contrasting on- and off-axis positions to acquire separate images. Four-sector annular detectors give the best range of options, but a set of three or more separate single detectors in suitable positions are available in some older SEMs and would be equally applicable.
The focus in this paper is on the acquisition and exploitation of images from four sectors of the same annular detector separately or from three positions of the same detector (which may be of any type). RGB colour images conveying directional information about 3D morphology can be made by combining three digital recordings made with separate detectors.
123, 234, 341, 412
In the simplest case, separate images are obtained with a single 90° annular-detector sector operative, and all other combinations may be made off line by summing and differencing these images (Fig. 1a–g). However, there may be reasons why it would be useful to use two or three adjacent sectors simultaneously for each image. In the case that three sectors are on and positive, the fourth may be switched negative. In any case, we have images, which will be designated 1,2,3 and 4. These may be played sequentially to make monochrome movie sequences in which the direction of illumination sweeps around the periphery of the field of view. For RGB, we usually use 1 = R, 2 = G, 3 = B. For RGB movie sequences, the second parent RGB frame will be 2 = R, 3 = G, 4 = B, the third 3 = R, 4 = G, 1 = B and the fourth 4 = R, 1 = G and 2 = B. These may be played sequentially such that colour and direction of illumination sweep around the periphery of the field of view. Extra intermediate frames can be added by interpolation between both monochrome and colour parent frames.
In Off Far (IOF)
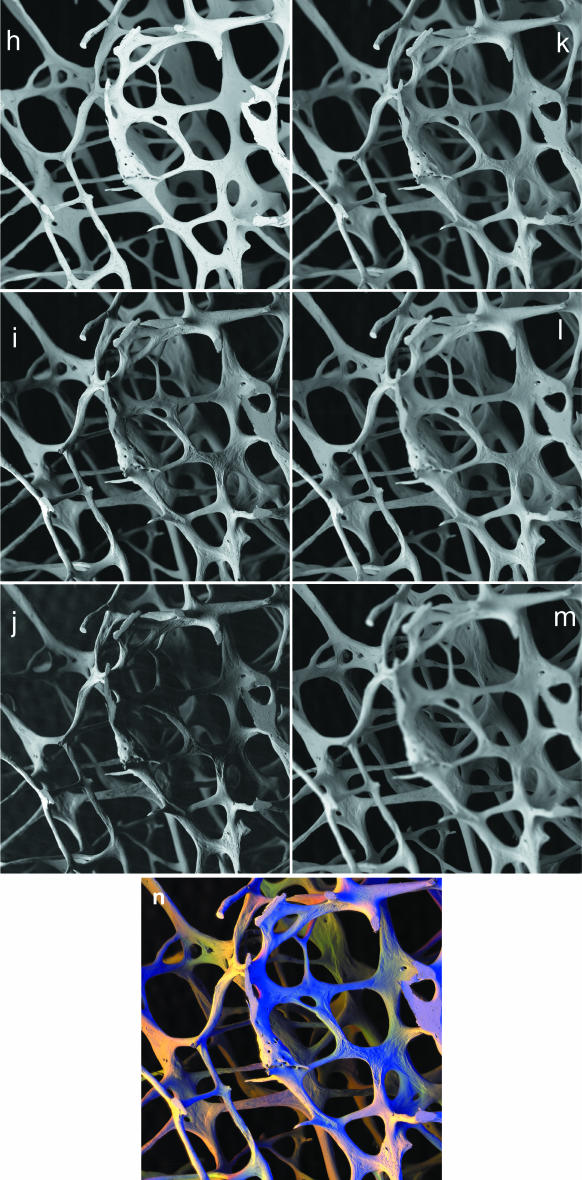
The entire detector is placed in three contrasting positions, which will be equivalent to three lighting sources at different obliquities (Fig. 2h–m). If the detector is annular and would normally surround the electron beam, one image is obtained in the usual overhead ‘I’ position (Fig. 2h). A second will be obtained with the detector assembly moved to ‘O’, the first off-axis position at which the electron beam can pass to one side Fig. 2(i). A third is obtained at another increment of shift to a Far (‘F’) location (Fig. 2j). Evidently, the solid angle of collection of BSEs reduces as the detector is moved, because it is further from the sample. Beam current and gain settings will need to be modified between I, O and F positions. In Fig. 2(n), F is assigned as Red, O as Green and I as Blue in the RGB image: colour varies with surface slope and direction. In a movie sequence (e.g. a GIF or an AVI file for computer display), the apparent light source will rock from an overhead ring light position to extreme obliquity. Again, extra frames can be added by interpolation between the existing ones.
Fig. 2.
panels h–m: In, Off, Far positions employing all sectors of annular solid state BSE detector. 20 kV BSE scanning electron micrographs of 84-year-old human female L4 vertebral body trabecular bone. Twelve levels were recorded with the sample being moved mechanically 250 µm towards the detector at each step. At each level, the same detector was placed in three contrasting positions for three separate recordings. In position = (‘overhead’, annular detector surrounding the electron beam axis), Off-axis position, the first position at which the electron beam clears the BSE detector to one side. Far off-axis position = further movement of detector. Field width = 4.05 mm. WD = 23 mm. h,i,j: I,O,F images of same field at same focus level, 750 µm below top of sample. k,l,m: Combined IOF images at focus 250 µm, 1500 µm, 2500 µm below top of sample.panel n: After generating each colour composite image, the first 11 were changed to match the magnification to that of the last, and they were then processed using AutoMontage™ to extract an image in focus from back to front, where R = Far, G = Off, and B = In. Colour varies with surface slope and direction.
Depth of field? and In focus?
It is generally stated that SEMs have a large depth of field. However, it is inadequate for porotic bone samples (Figs 2 and 3). When using SE imaging, one will normally be able to increase the working distance to increase depth of field, since there is no meaningful difference in signal strength and the only sacrifice is in resolution – but that is not a problem because we assume that a relatively large field diameter is required to document the context in the scene. In the BSE case, however, signal strength obeys the inverse square law for distance from sample to collector. Thus increase in working distance necessitates increase in beam current to maintain the same signal strength: whereas BSE is much more forgiving than SE imaging (using BSE thwarts ‘charging’ under the electron beam), there are limits as to what the sample will withstand. In studying bone surfaces, we require sharp detail to interpret the surface correctly as forming, resting or resorbing (Boyde, 1972), and out of focus blur, whilst actually increasing our consciousness of 3D depth, is generally undesirable. (Decreasing the beam defining aperture to increase field depth is inadvisable: to do so also spoils resolution and increases noise.)
Fig. 3.
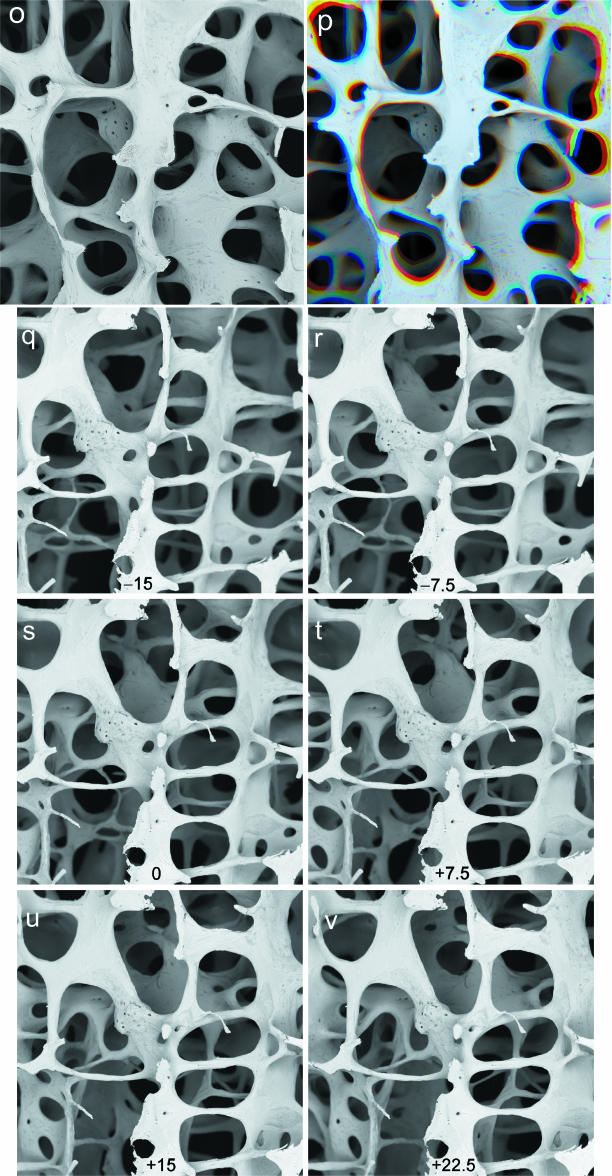
panels o,p: Single through-focus series employing all sectors of annular solid-state BSE detector. 30 kV BSE scanning electron micrographs of 77-year-old human female L4 vertebral body trabecular bone. Fourteen levels were recorded with the sample being moved mechanically 250 µm towards the detector at each step. Field width = 3.71 mm. WD 25 mm. o: The first 13 images were scaled to match the magnification to that of the last in the series, and they were then processed using AutoMontage software to extract an image that is in focus from back to front. panel p: Combination of three unmodified images at R = top focus, G = 1 mm deep and B = 2 mm deep to show change of magnification with mechanical focus. panels q-v: Through-tilt series, again employing all sectors of annular solid state BSE detector. Sample was tilted at 2.5° intervals (through range of 40°). Images shown here are subset at 7.5° intervals, arranged such that each horizontal pair may be viewed stereoscopically.
Commercially available software packages which handle through-focus sets of digital optical light microscopic images to produce in-focus output are becoming increasingly widespread. One aim of the present studies was to determine their applicability to SEM imagery (Fig. 3o,p). The system, which we purchased, was AutoMontage™ (Syncroscopy, Synoptics Ltd, Cambridge, UK, http://www.syncroscopy.com).
The SEM used was a Zeiss DSM962 automated digital system using a Kontron IBAS external control computer (both purchased from Zeiss, Welwyn Garden City, Herts., UK). Images were acquired in Kontron IMG format and converted to TIF or BMP format, prior to any other manipulation using Paint Shop Pro (Versions 5, 6 or 7: Jasc Software Inc., Eden Prairie, MN, USA, http://www.jasc.com).
Practical experimentation will immediately reveal that SEM through-focus sets cannot be used without further preprocessing of the parent images. The image rotates if one focuses the SEM in the usual way (familiar to most SEM users, namely by altering the strength of the current flowing through the final condenser lens). This could be corrected by rotating the digital images, but the result is less satisfactory than changing magnification, and it is more difficult to align a stack of through-focus images one on the next. One possibility would be to alter the scan (raster) rotation for every focus step, but in our SEM, the resolution of setting the scan rotation is one degree, which is not sufficiently precise.
Thus we revert to mechanical focus by moving the sample, as in light microscopy. Here, we encounter the problem that the projection in an SEM is perspective, so that the apparent magnification changes if the sample is moved axially (Fig. 3p): however, it is simpler to correct this magnification change (Fig. 3o). To increase the field depth in the present work, series (n = 10–20) of images were recorded with the sample being moved mechanically (e.g. 75–250 µm) towards the detector at each step. The magnifications of n – 1 of the image stacks are changed to match that of the last in the series, and processed with Auto-Montage software to extract an image which is in focus from back to front (by patching together a composite using those patches which were in best focus). A large pixel array (high resolution) of 2048 × 2048 is used to minimize problems of changing the image dimensions.
Ideally, one could control the change in magnification at acquisition. However, as instituted in our present SEM system, digital control = control to one digit, which is not a fine enough increment.
The procedures for replaying monochrome and RGB colour sequences can be combined with the increased field depth method. Obviously, very large numbers of parent images will be accumulated if the number of foci is multiplied by the number of detector segments at each level. Two routes can be followed to reduce the workload. Either a single in-focus image is derived from each detector set, and these are then combined to give four RGB parent outputs, or a single RGB image is derived from each focal plane, and these are then processed to generate the four in-focus images. At present, the operator-time, rate-limiting step is that of changing magnification at each plane, and the second route is therefore less tedious.
Back to Basics: scanning tilt
There is possibly no better way of achieving 3D imagery of any object in the SEM than by recording and replaying a set of images taken with a small tilt angle difference. Thus analogous ‘rotation’ displays are now widely used as final display output from data sets acquired from Z scanning in confocal optical microscopy or from rotation scanning in computerized microtomographic X-ray imaging.
Practical matters of concern include (A) how to bring the sample to a eucentric position so that the field does not move on tilting the specimen stage; (B) alternatively, how to provide an increment of shift for each tilt step to compensate for the movement due to the non-coincidence of the field of view with tilt axis; (C) how many steps; and (D) at what angular interval.
(A) This is solved by trial and error, through finding the final lens current setting (which determines focus) at which a focused feature does not move when the sample is tilted. This will be unique for any SEM, and can be used for all tilt sequence recording, always bringing the sample to focus by mechanical height adjustment. One will, at the same time, generally determine and use the raster scan rotation setting that corresponds to this working distance such that the tilt axis corresponds with either the line (horizontal) or the frame (vertical) direction of the image: however, the requirement that this is so is absolutely not absolute when playing back image sequences and exploiting tilt-motion parallax.
(B) This is simple to institute, given automation of stage XY motion as well as Z (height, mechanical focus).
(C) The minimum number of steps is one, i.e. two images, as in a stereo-pair. It is really surprising that a powerful 3D effect will be appreciated if two, not too discrepant, tilted views are presented in oscillating sequence. What is ‘not too different’ will depend on the local 3D depth, but will typically be about 5° and not more than 10°. This means that all archival stereo pairs can be displayed in modern lecture environments without recourse to the use of anaglyph (red–green or red–blue filters) or polarizing filters (albeit that simply excellent anaglyph display arrived with computers and the data projector!). When displaying tilt-motion parallax images (in contrast to stereoscopic parallax), a powerful 3D effect will arise from bottom to top sequences which emulate the scene change seen in walking forwards over the ground. This will be seen even in low-contrast images, and probably reflects the ability of the human eye–brain psychological complex to spot ground-surface irregularities and to avoid tripping.
(D) The maximum number of images and their spacing in a tilt sequence will only be set by limits to the time available for acquiring, processing and using the sequences. 10° is far too big a jump. 5° steps work for many scenes if a range of 30° can be used, 2.5° is good for all scenes, and 1° is excellent.
Results and discussion
There are substantial general advantages of SEM over all other methods in 3D studies of bone matrix organization. The range of magnifications and directions of view make it possible for the enduring SEM observer to reach valid conclusions about general and local phenomena. This is fine if you are that observer, but what is the minimum number of images that will convey the truth to a third person who has never spent the time at the microscope?
All the improved imaging methods considered here permit more meaningful analyses of details of changes at bone surfaces (Figs 1–5 panels a–x). They have considerable viewer impact, and encourage more interest from students and professionals. They may eventually prove to be the light that shows the path to the correct understanding of the changes occurring in human bone with ageing and osteoporosis. In stating this, it must be understood that all concepts of bone turnover and remodelling are based on necessarily limited surveys of c. 10-µm-thick sections, albeit that this is supplemented by data from double tetracycline mineralization-front labelling. In contrast, SEM surveys of bone mineral (mineralization front, resting mineralized and resorbing or resorbed) surfaces show a very large proportion of all the surface in 3D context. They demonstrate lack of coupling of resorption and formation in the elderly, where a huge preponderance of resorbed surfaces may prevail. Other work from this laboratory suggests that such surfaces are covered by marrow adipocytes (Boyde, 2001).
All the methods considered here benefit from dynamic visual display, a fact which can unfortunately not be demonstrated in print. They would also have been impractical and unusable prior to the arrival of the digital data projector, which has revolutionized the quality of audio-visual aids for platform presentations at meetings. The commonest medium is currently PowerPoint™, and this is limited to 950 wide by 710 pixels high for on-screen presentation. This resolution is deliberately spoilt by most users who place several small images in one 'slide’ thereby losing most of the useful detail in every image.1 Nevertheless, it is a great improvement over the video tape medium, with all the hassle of conversion, loss of resolution in converting to tape recording, setting up equipment, etc. With the spread of confocal microscopy, it is now very common for dynamic 3D displays to be used in presenting data, and the old-fashioned prejudice against using ‘lots of slides’ is rapidly diminishing as audiences understand that it is the number of topics or scenes or concepts which need to be held in check, not the means of dealing with each one in turn.
All the methods considered here benefit the stereoscopically blind. The author was surprised to be informed by several people who cannot use stereoscopic parallax that they were able to 'see 3D’ for the first time when the underlying display principal was motion parallax ± change of lighting direction.2
Previous use of colour coding of SEM images has mostly been confined to simultaneous encoding of different signals or signalling modalities. It is, for example, well known in X-ray mapping, where displays of characteristic X-rays from different elements are combined in the same frame. Other examples are to combine X-ray, SE, BSE and/or CL imagery, and in making anaglyph stereo images off-line (Boyde, 1971) or for on-line real-time 3D display (Boyde, 1974).
The use of two or more detectors in generating coloured secondary electron images was described in US Patent 5 212 383 by D. Scharf (1993). The directionality of SE detectors is limited, but may be improved if symmetrically placed and used simultaneously, when their respective collection fields will compete to reduce the bending of electron paths over the top of the sample. Scharf used his complex ‘wideband multidetector multiplex colour synthesizer’ to combine the images. In contrast, the RGB addition procedures used here employ the highly directional BSE signal, detectors which are in widespread use and ubiquitous and economical software, Paint Shop Pro, which also contains the necessary animation software.
The advantages of BSE in directionality have been realized in physical and materials science applications fields of SEM for a long time: for materials of uniform composition, the slope of surface facets can be obtained from measurements of the signal strength in contrasting directions. I hope that this note will encourage others to explore their potential in biomedical topographic imaging.
Fig. 4.
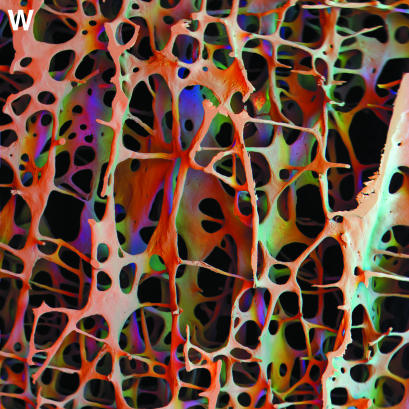
panel w: In, Off, Far positions employing all sectors of annular solid-state BSE detector. Scanning electron micrograph of 84-year-old male porotic bone. A 10-mm window in a 3-mm-thick vertical slice of fourth lumbar vertebral body trabecular bone, cleaned and coated with carbon: this is an exceptionally wide field of view (low magnification) image from an SEM. 30 kV. WD = 41 mm. In position (surrounding the electron beam axis) was assigned as red, a first off-axis position as green and a far off-axis position as blue in a combined image. Colour varies with surface slope and direction.
Acknowledgments
Parts of the work described here were presented at ASGBI meetings in London & Dublin, 2001 and at ‘How to make a hand’ 23–25 July 2002 in Dundee. The mouse embryo shown in Fig. 6 (colour plate panel y) was prepared by my late friend Arnold Tamarin and I dedicate this paper to his memory.
Endnotes
There is no sense in using standard procedures offered as default in PowerPoint, since data projectors are perfect out to the four corners of the field, unlike the classical optical slide projector, which is rarely flat field and rarely evenly illuminated, nevertheless having far greater resolution than 710 pixels. Anatomists must use images to the best advantage, and that is to show one at a time zoom-through magnification in the same field, and show contrasting experimental findings in sequence, not all at once.
Again, that which impacts motion, however, does not help in print. A web site at which limited sequences can be downloaded is http://www.anat.ucl.ac.uk/research/boyde
References
- Boyde A. Direct recording of stereoscopic images with the scanning electron microscope by the anaglyph colour technique. Med. Biol. Illustration. 1971;21:130–133. 10.1046/j.1469-7580.2003.00146.x. [PubMed] [Google Scholar]
- Boyde A. Scanning electron microscopic studies of bone. In: Bourne GH, editor. The Biochemistry and Physiology of Bone. 2. Vol. 1. New York: Academic Press; 1972. pp. 259–310. 10.1046/j.1469-7580.2003.00146.x. [Google Scholar]
- Boyde A. A stereo-plotting device for SEM micrographs: and a real-time 3-D system for the SEM. Scanning Electron Microscopy. 1974;1974:93–100. 10.1046/j.1469-7580.2003.00146.x. [Google Scholar]
- Boyde A. Cell–matrix interface in bone. Bone. 2001;28(5 Suppl.):S156–247. 10.1046/j.1469-7580.2003.00146.x. [Google Scholar]
- Goldstein JI. In: Practical Scanning Electron Microscopy. Yakowitz H, editor. New York: Plenum Press; 1975. 10.1046/j.1469-7580.2003.00146.x. [Google Scholar]
- Reimer L, Pfefferkorn G, editors. Raster-Elektronenmikroskopie. Berlin: Springer-Verlag; 1973. 10.1046/j.1469-7580.2003.00146.x. [Google Scholar]
- Scharf D. Color Synthesizing Scanning Electron Microscope. US Patent 5 212 383. 1993 10.1046/j.1469-7580.2003.00146.x.
- Wells OC, editor. Scanning Electron Microscopy. New York: McGraw-Hill; 1974. 10.1046/j.1469-7580.2003.00146.x. [Google Scholar]


