

Abstract
We examined the distribution of Notch family members and their ligands during the development of articular cartilage and the growth plate. Notch 1 was expressed by the chondrocytes of the developing articular surface but became increasingly restricted to the deeper layers after birth whilst expression of this family member was restricted to hypertrophic chondrocytes in the growth plate. Notch 2 and 4, Delta and Jagged 2 showed a broadly similar distribution, being present throughout the articular cartilage during development and becoming increasingly restricted to deeper layers with age. Hypertrophic chondrocytes within the growth plate also expressed Notch 2 and 4, Delta and Jagged 2 (which was also expressed in prehypertrophs). Notch 3 and Jagged 1 were absent from developing articular cartilage but were present in deeper layers at later time points (> 1 month) and both receptor and ligand were expressed in hypertrophic chondrocytes at all ages examined. These results highlight the complex Notch signalling interactions that result in the formation of the heterogeneous articular cartilage and allow for the co-ordinated ossification and elongation of the growth plate. Mechanisms by which these processes are controlled are discussed in light of recent advances in the understanding of Notch signalling pathways.
Keywords: chondrocyte, growth plate, knee, mouse
Introduction
Articular cartilage is an avascular, aneural connective tissue with a high matrix to cell volume ratio. The matrix comprises mainly type II collagen fibres and the high-molecular-weight aggregating proteoglycan aggrecan. The tissue is not, however, biochemically and morphologically homogeneous. Variations in both chondrocyte morphology and the biochemical structure of the matrix exist from the surface zone to the deeper calcified layer. The surface zone of the tissue is characterized by flattened, discoid cells that secrete proteoglycan 4 (Schumacher et al. 1994). The mid-zone of the tissue comprises rounded cells arranged in perpendicular columns and in addition to type II collagen and aggrecan expresses cartilage intermediate layer protein (CILP; Lorenzo et al. 1998) whilst the deep zone and calcified zone chondrocytes express type X collagen and alkaline phosphatase during growth (Schmid & Linsenmayer, 1985). Additionally, subtle differences in glycosaminoglycan side chain attachments to the aggrecan core protein are evident not only between the distinct zones but also between areas subject to differing mechanical loads and with varying age (Bayliss et al. 1999).
Clearly, the differentiation and proliferation events occurring during the development of articular cartilage must therefore be strictly controlled both temporally and spatially in order for the distinct zonal architecture of the tissue to be established. Various studies have shown that the surface zone of articular cartilage is centrally involved in the regulation of tissue development and growth. Not only does the surface of articular cartilage play a major role in the morphogenesis of the diarthrodial joint via differential matrix synthesis (Ward et al. 1999) but the expression of many growth factors and their receptors at the articular surface suggests that this region represents an important signalling centre (Archer et al. 1994; Hayes et al. 2001). Additionally, it has been shown in vivo that the surface zone of articular cartilage is responsible for the appositional growth of articular cartilage (Hayes et al. 2001) and that this growth is facilitated by a population of chondroprogenitor cells resident in the surface 2–3 cell layers (Archer et al. 2002; Dowthwaite et al. 2002).
In addition to the many growth factors and receptors present at the articular surface (Archer et al. 1994), we have recently shown the expression of Notch receptor family members in the surface zone of bovine articular cartilage (Dowthwaite et al. 2002). The Notch family is a highly conserved family of cell surface signalling molecules that regulates many asymmetric developmental cell fate decisions which can be either inductive (e.g. the specification of arterial endothelial cells; Lawson et al. 2001) or lateral-inhibitory (e.g. Drosophila neurone specification; Artavanis-Tsakonas et al. 1995). With reference to cartilage, the Delta–Notch 2 signalling pathway has been shown to be important in regulating the progression of prehypertrophic chondrocytes to hypertrophic chondrocytes during chick growth plate elongation (Crowe et al. 1999). In this system, Delta–Notch 2 signalling that occurs downstream of the Indian Hedgehog (IHH), bone morphogenetic protein (BMP) and parathyroid hormone-related protein (PTHrP) pathway inhibits the differentiation of prehypertrophic to hypertrophic chondrocytes and overexpression of Delta results in stunted limbs with reduced ossification (Crowe et al. 1999). Additionally, we have shown that a subpopulation of chondrocytes derived from the surface zone of articular cartilage specifically express Notch 1 and that these Notch 1 positive cells contain a chondrocyte progenitor population (Archer et al. 2002; Dowthwaite et al. 2002).
Here, we highlight the expression of Notch family signalling molecules from E15 to adulthood in the articular cartilage and the growth plate of the mouse and show temporo-spatial changes in family members that may account for the co-ordinated growth and establishment of these distinct cartilage subpopulation phenotypes.
Materials and methods
Animals
BalbC mice were killed at regular stages during embryonic and postnatal development and the hind limbs removed. A minimum of five animals were sampled at each of the following time points: E15, E16, E17 & E20, neonate, 1 week, 2 weeks, 3 weeks, 1 month, 2 months and 3 months.
Tissue processing
Limbs were skinned and immersed in 10% neutral buffered formal saline for 1 week with constant agitation. Limbs were then washed briefly in distilled water and decalcified in 10% ethylenediamine-tetra-acetic acid (EDTA) in 0.1 m phosphate-buffered saline (pH 7.4; PBS) until radiologically clear. Samples were snap frozen and cryosections cut at 10 µm. Sections were then collected onto 3-aminopropyltriethoxysiline (APES)-coated slides.
Immunocytochemistry
Sections were labelled with the following antibodies to Notch family members: goat anti-human Notch 1, rabbit anti-human Notch 2, goat anti-mouse Notch 3, goat anti-mouse Notch 4, rabbit anti-human Delta, rabbit anti-human Jagged 1 and rabbit anti-human Jagged 2. All antibodies were obtained from Santa Cruz Biotechnology (Santa Cruz, CA, USA) and used at a concentration of 5 µg mL−1 in PBS for 1 h at room temperature. Primary antibodies were visualized using appropriate FITC-conjugated secondary antibodies (Sigma, Dorset, UK). Samples were then counterstained with propidium iodide (1 µg mL−1 in PBS), mounted under Vectashield (Vector Laboratories, Peterborough, UK) and examined using dual-channel confocal microscopy. Controls comprised sections incubated without primary antibody to test the specificity of the secondary antibody and incubation with non-immune serum to test for non-specific binding of the primary antibody. Additionally, pre-incubating with epitope-specific peptides to which the antibodies were raised abolished primary antibody labelling.
Results
Knee cartilages
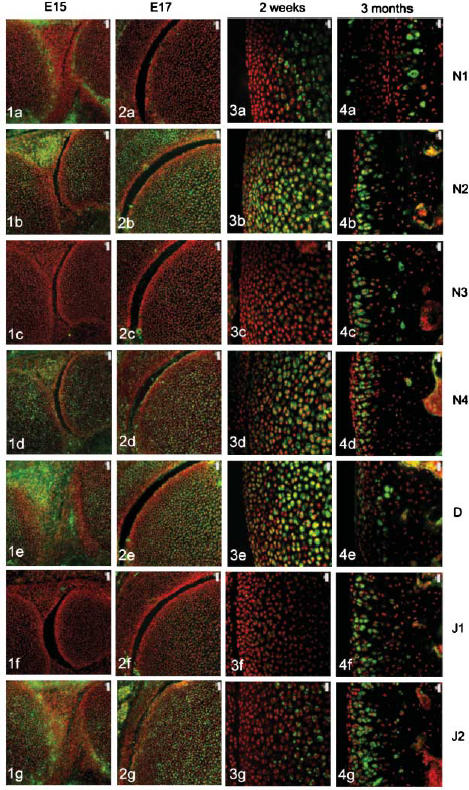
The four Notch receptors and their ligands had distinct distributions during fetal and postnatal development of both the articular cartilage and the epiphyseal growth plate. Prior to knee joint cavitation (E15, E16), Notch 1 (Fig. 1a) was distributed in the surface layers of the articular cartilage of the femur and tibia. Notch 2 and 4, Delta and Jagged 2 (Fig. 1b, 1d, 1e, g, respectively) were widely distributed throughout the cartilage anlagen and the developing menisci. Notch 3 was not apparent in the articular cartilage anlagen or the developing menisci at these stages (Fig. 1c) and Jagged 1 was present as distinct foci within the developing meniscus but not within the cartilage (Fig. 1f).
Fig. 1.

Notch family distribution in developing and growing mouse knee articular cartilage. Note the changes in expression pattern for individual family members with increasing age as outlined below. Notch 1 distribution was initially limited to the surfaces of the cavitating joint (Figs 1a and 2a) but became increasingly restricted to deeper layers with increasing age (Figs 3a and 4a). Notch 2 and Notch 4 expression were more widespread before birth (Figs 1b,d and 2b,d) but became increasingly restricted to deeper layers after birth (Figs 3b,d and 4b,d). Notch 3 was not expressed before birth (Figs 1c and 2c) but became increasingly expressed after birth except at the articular surface (Figs 3c and 4c). Delta and Jagged 2 were widely expressed before birth (Figs 1e,g and 2e,g) whereas Jagged 1 was only expressed in epiphyseal chondrocytes before birth (Fig. 2f). After birth, Delta and Jagged 2 became increasingly restricted to the deeper layers of the articular cartilage with the occasional chondrocyte in the surface layers labelling positively (Figs 3e,g and 4e,g). Jagged 1 was more widely expressed after birth (Figs 3f and 4f). Scale bars = 50 µm (Figs 1 and 2), and 20 µm (Figs 3 and 4).
After cavitation of the knee joint at E17 and up to birth, Notch 1 was limited in its distribution to the surface 1–2 cell layers of the femur (Fig. 2a) and tibia but was not present in the menisci. Notch 2 and 4, Delta and Jagged 2 showed a broadly similar distribution to each other although slight differences in the distribution of these molecules were evident. Notch 2 was more widespread than Notch 4 (Fig. 2b,d) and Delta was predominant in the epiphyseal cartilage rather than the articular cartilage (Fig. 2e) whilst Jagged 2 was present throughout the tissues of the developing knee joint (Fig. 2g). During this time, weak label for Notch 3 was observed in the epiphyseal cartilage of the femur (Fig. 2c) and tibia and no label for Jagged 1 was observed (Fig. 2f).
Fig. 2.

Notch family distribution in developing and growing mouse knee articular cartilage. Note the changes in expression pattern for individual family members with increasing age as outlined below. Notch 1 distribution was initially limited to the surfaces of the cavitating joint (Figs 1a and 2a) but became increasingly restricted to deeper layers with increasing age (Figs 3a and 4a). Notch 2 and Notch 4 expression were more widespread before birth (Figs 1b,d and 2b,d) but became increasingly restricted to deeper layers after birth (Figs 3b,d and 4b,d). Notch 3 was not expressed before birth (Figs 1c and 2c) but became increasingly expressed after birth except at the articular surface (Figs 3c and 4c). Delta and Jagged 2 were widely expressed before birth (Figs 1e,g and 2e,g) whereas Jagged 1 was only expressed in epiphyseal chondrocytes before birth (Fig. 2f). After birth, Delta and Jagged 2 became increasingly restricted to the deeper layers of the articular cartilage with the occasional chondrocyte in the surface layers labelling positively (Figs 3e,g and 4e,g). Jagged 1 was more widely expressed after birth (Figs 3f and 4f). Scale bars = 50 µm (Figs 1 and 2), and 20 µm (Figs 3 and 4).
After birth and up to 2 weeks, Notch 1 became increasingly localized to the deeper layers of the articular cartilage (Fig. 3a) whilst Notch 2, Notch 4 and Delta were distributed from deep layers through to the articular surface (Fig. 3b, 3c,e). Weak label for Notch 3 was observed in the deeper layers of the articular cartilage (Fig. 3c) that matched the distribution of Jagged 2 (Fig. 3g). Label for Jagged 1 was apparent but weak in the middle layer of the articular cartilage (Fig. 3f).
Fig. 3.

Notch family distribution in developing and growing mouse knee articular cartilage. Note the changes in expression pattern for individual family members with increasing age as outlined below. Notch 1 distribution was initially limited to the surfaces of the cavitating joint (Figs 1a and 2a) but became increasingly restricted to deeper layers with increasing age (Figs 3a and 4a). Notch 2 and Notch 4 expression were more widespread before birth (Figs 1b,d and 2b,d) but became increasingly restricted to deeper layers after birth (Figs 3b,d and 4b,d). Notch 3 was not expressed before birth (Figs 1c and 2c) but became increasingly expressed after birth except at the articular surface (Figs 3c and 4c). Delta and Jagged 2 were widely expressed before birth (Figs 1e,g and 2e,g) whereas Jagged 1 was only expressed in epiphyseal chondrocytes before birth (Fig. 2f). After birth, Delta and Jagged 2 became increasingly restricted to the deeper layers of the articular cartilage with the occasional chondrocyte in the surface layers labelling positively (Figs 3e,g and 4e,g). Jagged 1 was more widely expressed after birth (Figs 3f and 4f). Scale bars = 50 µm (Figs 1 and 2), and 20 µm (Figs 3 and 4).
At 3 months, Notch 1 was restricted to the deep zone of the articular cartilage (Fig. 4a) and Notch 2, 3 and 4, Jagged 1 and 2 were distributed throughout the depth of the articular cartilage except for the surface 1–2 cell layers (Fig. 4b, 4c, 4d, 4f,g, respectively). Delta was present in the surface 2–3 cell layers and was present in some chondrocytes of the middle and deep zone (Fig. 4e).
Fig. 4.

Notch family distribution in developing and growing mouse knee articular cartilage. Note the changes in expression pattern for individual family members with increasing age as outlined below. Notch 1 distribution was initially limited to the surfaces of the cavitating joint (Figs 1a and 2a) but became increasingly restricted to deeper layers with increasing age (Figs 3a and 4a). Notch 2 and Notch 4 expression were more widespread before birth (Figs 1b,d and 2b,d) but became increasingly restricted to deeper layers after birth (Figs 3b,d and 4b,d). Notch 3 was not expressed before birth (Figs 1c and 2c) but became increasingly expressed after birth except at the articular surface (Figs 3c and 4c). Delta and Jagged 2 were widely expressed before birth (Figs 1e,g and 2e,g) whereas Jagged 1 was only expressed in epiphyseal chondrocytes before birth (Fig. 2f). After birth, Delta and Jagged 2 became increasingly restricted to the deeper layers of the articular cartilage with the occasional chondrocyte in the surface layers labelling positively (Figs 3e,g and 4e,g). Jagged 1 was more widely expressed after birth (Figs 3f and 4f). Scale bars = 50 µm (Figs 1 and 2), and 20 µm (Figs 3 and 4).
Growth plate
At E15 (Fig. 5a) and E16 Notch 1 was absent in the diaphyseal cartilage but was present in the calcified cartilage of the primary centre of ossification. Notch 2 was detected in the osteocytes of the bony collar, flattened prehypertrophic chondrocytes and enlarged hypertrophic chondrocytes of the primary centre of ossification (Fig. 5b). Sparse label for Notch 3 was present at these early stages of ossification in hypertrophic chondrocytes and the osteocytes of the primary centre of ossification (Fig. 5c), whilst intense label for Notch 4 and Delta was present in the final 2–3 layers of flattened prehypertrophic chondrocytes and in the majority of hypertrophic chondrocytes (Fig. 5d,e). Weak label for Jagged 1 was present in hypertrophic chondrocytes at E15 (Fig. 5f) and E16 and intense label for Jagged 2 was present in all of the hypertrophic chondrocytes of the primary centre of ossification (Fig. 5g).
Fig. 5.

Notch family distribution in the developing mouse epiphyseal plate. All family members are expressed in the primary centre of ossification at E15 to varying degrees (Fig. 5a–g), for example Notch 2 is widespread (Fig. 5b) whereas Notch 3 is far more restricted (Fig. 5c). With increasing age and the development of the secondary centre of ossification, Notch family members exhibit diverse patterns of distribution. Notch 1 is restricted to hypertrophs initially (Fig. 6a) but by 2 weeks is expressed in hypertrophs and resting/proliferative cells (Figs 7a and 8a). Notch 2 and 4 are widespread throughout the growth plate prenatally but become restricted to hypertrophs with increasing age (Figs 6b,d, 7b,d and 8b,d) whilst Notch 3 remains restricted to hypertrophs (Figs 6c, 7c and 8c). The initial widespread distribution of Delta (Figs 5e and 6e) becomes more attenuated to hypertrophs and resting chondrocytes with age although some maturing cells express this ligand (Figs 5e, 6e, 7e and 8e). Jagged 1 was restricted to hypertrophic chondrocytes (Figs 6f, 7f and 8f) whereas Jagged 2 was more widespread but became restricted to hypertrophs by 3 months (Figs 6g, 7g and 8g). Delineation of prehypertrophic (pre) from proliferating (pro) and hypertrophic (hyp) chondrocytes is shown at top of columns.
After knee joint cavitation at E17 and formation of the secondary centre of ossification, Notch 1 and 3 were present in hypertrophic chondrocytes alone (Fig. 6a,c) whilst Notch 2 and 4 and Delta were present throughout the growth plate (Fig. 6b, 6d,e, respectively). Jagged 1 was sparsely expressed in the growth plate except for the hypertrophic chondrocytes whilst Jagged 2 was widely expressed (Fig. 6f,g).
Fig. 6.

Notch family distribution in the developing mouse epiphyseal plate. All family members are expressed in the primary centre of ossification at E15 to varying degrees (Fig. 5a–g), for example Notch 2 is widespread (Fig. 5b) whereas Notch 3 is far more restricted (Fig. 5c). With increasing age and the development of the secondary centre of ossification, Notch family members exhibit diverse patterns of distribution. Notch 1 is restricted to hypertrophs initially (Fig. 6a) but by 2 weeks is expressed in hypertrophs and resting/proliferative cells (Figs 7a and 8a). Notch 2 and 4 are widespread throughout the growth plate prenatally but become restricted to hypertrophs with increasing age (Figs 6b,d, 7b,d and 8b,d) whilst Notch 3 remains restricted to hypertrophs (Figs 6c, 7c and 8c). The initial widespread distribution of Delta (Figs 5e and 6e) becomes more attenuated to hypertrophs and resting chondrocytes with age although some maturing cells express this ligand (Figs 5e, 6e, 7e and 8e). Jagged 1 was restricted to hypertrophic chondrocytes (Figs 6f, 7f and 8f) whereas Jagged 2 was more widespread but became restricted to hypertrophs by 3 months (Figs 6g, 7g and 8g). Delineation of prehypertrophic (pre) from proliferating (pro) and hypertrophic (hyp) chondrocytes is shown at top of columns.
At 2 weeks after birth, Notch 1 was present in occasional prehypertrophic and in the majority of hypertrophic chondrocytes (Fig. 7a). The final 2–3 flattened cells of the prehypertrophic layer and all of the hypertrophic zone were labelled with Notch 2 at this stage (Fig. 7b) whilst Notch 3 was localized to the hypertrophic compartment alone (Fig. 7c). In contrast, Notch 4 was present in the rounded proliferating chondrocytes and the hypertrophic cells, with label being present in the occasional flattened prehypertrophic chondrocyte (Fig. 7d). At this stage, Delta was present in both the proliferating chondrocytes and the hypertrophic chondrocytes (Fig. 7e) whilst Jagged 1 and Jagged 2 were present in the hypertrophic region alone (Fig. 7f,g).
Fig. 7.

Notch family distribution in the developing mouse epiphyseal plate. All family members are expressed in the primary centre of ossification at E15 to varying degrees (Fig. 5a–g), for example Notch 2 is widespread (Fig. 5b) whereas Notch 3 is far more restricted (Fig. 5c). With increasing age and the development of the secondary centre of ossification, Notch family members exhibit diverse patterns of distribution. Notch 1 is restricted to hypertrophs initially (Fig. 6a) but by 2 weeks is expressed in hypertrophs and resting/proliferative cells (Figs 7a and 8a). Notch 2 and 4 are widespread throughout the growth plate prenatally but become restricted to hypertrophs with increasing age (Figs 6b,d, 7b,d and 8b,d) whilst Notch 3 remains restricted to hypertrophs (Figs 6c, 7c and 8c). The initial widespread distribution of Delta (Figs 5e and 6e) becomes more attenuated to hypertrophs and resting chondrocytes with age although some maturing cells express this ligand (Figs 5e, 6e, 7e and 8e). Jagged 1 was restricted to hypertrophic chondrocytes (Figs 6f, 7f and 8f) whereas Jagged 2 was more widespread but became restricted to hypertrophs by 3 months (Figs 6g, 7g and 8g). Delineation of prehypertrophic (pre) from proliferating (pro) and hypertrophic (hyp) chondrocytes is shown at top of columns.
By 3 months, Notch family members were restricted to the hypertrophic compartment (Fig. 8a) with the exception of Notch 2 which was observed occasionally in flattened prehypertrophic cells (Fig. 8b). Delta was present in proliferating chondrocytes, occasional prehypertrophic chondrocytes as well as all hypertrophic chondrocytes (Fig. 8e). Jagged 1 and 2 showed a broadly similar distribution at 3 months with label present in the hypertrophs (Fig. 8f,g).
Fig. 8.
Notch family distribution in the developing mouse epiphyseal plate. All family members are expressed in the primary centre of ossification at E15 to varying degrees (Fig. 5a–g), for example Notch 2 is widespread (Fig. 5b) whereas Notch 3 is far more restricted (Fig. 5c). With increasing age and the development of the secondary centre of ossification, Notch family members exhibit diverse patterns of distribution. Notch 1 is restricted to hypertrophs initially (Fig. 6a) but by 2 weeks is expressed in hypertrophs and resting/proliferative cells (Figs 7a and 8a). Notch 2 and 4 are widespread throughout the growth plate prenatally but become restricted to hypertrophs with increasing age (Figs 6b,d, 7b,d and 8b,d) whilst Notch 3 remains restricted to hypertrophs (Figs 6c, 7c and 8c). The initial widespread distribution of Delta (Figs 5e and 6e) becomes more attenuated to hypertrophs and resting chondrocytes with age although some maturing cells express this ligand (Figs 5e, 6e, 7e and 8e). Jagged 1 was restricted to hypertrophic chondrocytes (Figs 6f, 7f and 8f) whereas Jagged 2 was more widespread but became restricted to hypertrophs by 3 months (Figs 6g, 7g and 8g). Delineation of prehypertrophic (pre) from proliferating (pro) and hypertrophic (hyp) chondrocytes is shown at top of columns.
Discussion
This study clearly demonstrates the diverse spatio-temporal expression of Notch family members during the development and growth of both articular cartilage and the growth plate (Fig. 9). Additionally, this is the first study to highlight the expression of the major members of the Notch family during cartilage development. We have previously shown that surface zone chondrocytes of bovine articular cartilage express Notch 1 and that this population of Notch-1-positive cells contains a population of chondrocyte progenitor cells (Archer et al. 2002; Dowthwaite et al. 2002). Here, we show that Notch 1 is expressed by murine chondrocytes at the articular surface before birth but that expression becomes restricted to deeper layers after birth. The surface of the articular cartilage during development is recognized as being an important area for differential matrix synthesis during joint cavitation (Ward et al. 1999) and differential cell division to allow for appositional growth (Hayes et al. 2001). The expression of Notch 1 in the surface of developing articular cartilage may play a role in determining cell fate during cartilage development, since the continued growth of the cartilage depends on the presence of a cartilage progenitor cell (Hayes et al. 2001). Whilst we do not know if Notch 1 determines differentiation along the chondrocyte pathway or maintains cells in a proliferative state, we have evidence that blocking Notch 1 signalling in isolated progenitor cells abolishes the ability of these cells to form chondrocyte colonies (Dowthwaite et al. 2002) suggesting that Notch 1 signalling determines the proliferation rather than the differentiation of surface zone cells. The restriction of Notch 1 to deeper zones of cartilage after birth in the mouse differs from that in the bovine which maintains surface zone expression of Notch 1 until at least 7 days after birth (Dowthwaite et al. 2002). This difference in expression may represent differences in the overall life spans of the two species or it may simply be a species difference.
Fig. 9.

Summary of Notch family distribution in mouse articular cartilage before birth and at maturity (3 months). S, surface zone; M, middle zone; D, deep zone.
Jagged 2 is also expressed at the surface of the developing joint (and throughout the rest of the tissue) and this expression may be important in determining cell fate in this important signalling region. Whilst very little is known about the role of the Notch family in articular cartilage, specific roles for Notch–ligand interactions are being elucidated and Notch 1–Jagged 2 interactions have been described as playing vital roles in other cell fate decisions (e.g. spermatogenesis and cochlear hair cell development; Lanford et al. 1999; Hayashi et al. 2001).
Notch 2 and Delta expression in the growth plate correlate with the expression patterns demonstrated in the developing chick limb where these family members were shown to negatively regulate the progression of prehypertrophic chondrocytes into hypertrophs (Crowe et al. 1999), suggesting a similar role for these family members during mouse growth plate development. The widespread distribution of Notch 2 in developing, growing and mature articular cartilage suggests that this member of the family plays an essential role not only in the development of the tissue but also in its homeostasis at adulthood. Notch 2 may perform this role by modulating the signal transduction of other Notch family members since it has been shown that Notch 2 can inhibit signal transduction events mediated by both Notch 1 and Notch 3 (Shimizu et al. 2002).
Notch 3 has been shown to play a biphasic role in cell cycle regulation in vitro (Campos et al. 2002). During subconfluent growth, Notch 3 inhibits cell cycle progression thus slowing growth, whilst at confluency, Notch 3 prevents growth arrest (Campos et al. 2002). The fact that Notch 3 appears to retard the cell cycle may explain its expression in the mature chondrocytes of both the articular cartilage (expressed 2 weeks after birth) and the growth plate where the cells are fully differentiated, post-mitotic and have no direct cell–cell contact. A similar role in cellular maturation in dendritic cells and keratinocytes has been proposed for Jagged 1 (Nickoloff et al. 2002; Weijzen et al. 2002) and the expression of Jagged 1 in late-stage (mature) chondrocytes would appear to support these data.
The expression of Notch 4 throughout the articular cartilage and hypertrophs of the growth plate may relate to the avascular nature of the tissue since Notch 4 is known to be anti-angiogenic and inhibits vascular ingression (Leong et al. 2002). Notch 4 expression in the articular cartilage would prevent vascular invasion so maintaining the structural integrity of cartilage. Hypertrophic chondrocytes express the angiogenic factor VEGF (vascular endothelial growth factor; Carlevaro et al. 2000) which is believed to be responsible for the neovascularization of cartilage anlagen during endochondral ossification. Notch 4 expression in hypertrophs may therefore allow for the co-ordinated ingression of the vasculature during endochondral ossification since uncontrolled vascular ingression would lead to premature ossification.
It must be remembered that the Notch family of cell signalling molecules are believed to require activation by a cell surface ligand (Artavanis-Tsakonas et al. 1995) although evidence is accumulating that Notch can be activated by soluble ligands (Wong et al. 2000). In cartilage there is little cell–cell contact except in the surface zone and this tissue may provide a novel insight into Notch signalling mechanisms in a relatively hypocellular tissue.
References
- Archer CW, Morrison H, Pitsillides AA. Cellular aspects of the development of diarthrodial joints and articular cartilage. J. Anat. 1994;184:447–456. [PMC free article] [PubMed] [Google Scholar]
- Archer CW, Boyer S, Redman S, Bishop J, Dowthwaite GP. The identification and characterisation of articular cartilage progenitor cells. Trans. ORS. 2002;48:9. [Google Scholar]
- Artavanis-Tsakonas S, Matsuno K, Fortini ME. Notch signalling. Science. 1995;268:225–232. doi: 10.1126/science.7716513. [DOI] [PubMed] [Google Scholar]
- Bayliss MT, Osborne D, Woodhouse S, Davidson C. Sulfation of chondroitin sulfate in human articular cartilage. The effect of age, topographical position and zone of cartilage on tissue composition. J. Biol. Chem. 1999;274:15892–15900. doi: 10.1074/jbc.274.22.15892. [DOI] [PubMed] [Google Scholar]
- Campos AH, Wang W, Pollman MJ, Gibbons GH. Determinants of notch-3 receptor expression and signalling in vascular smooth muscle cells: implications in cell cycle regulation. Circ. Res. 2002;29:999–1006. doi: 10.1161/01.res.0000044944.99984.25. [DOI] [PubMed] [Google Scholar]
- Carlevaro MF, Cermelli S, Cancedda R, Descalzi Cancedda F. Vascular endothelial growth factor (VEGF) in cartilage neovascularization and chondrocyte differentiation: auto paracrine role during endochondral bone formation. J. Cell Sci. 2000;113:59–69. doi: 10.1242/jcs.113.1.59. [DOI] [PubMed] [Google Scholar]
- Crowe R, Zikherman J, Niswander L. Delta-1 negatively regulates the transition from prehypertrophic to hypertrophic chondrocytes during cartilage formation. Development. 1999;126:987–998. doi: 10.1242/dev.126.5.987. [DOI] [PubMed] [Google Scholar]
- Dowthwaite GP, Bishop JC, Redman SN, Rooney P, Evans DJR, Boyer S, et al. The surface of articular cartilage contains a progenitor cell population. J. Cell Sci. 2002 doi: 10.1242/jcs.00912. in press. [DOI] [PubMed] [Google Scholar]
- Hayashi T, Kageyama Y, Ishizaka K, Xia G, Kihara K, Oshima H. Requirement of Notch 1 and its ligand Jagged 2 expressions for spermatogenesis in rat and human testes. J. Androl. 2001;22:999–1011. doi: 10.1002/j.1939-4640.2001.tb03441.x. [DOI] [PubMed] [Google Scholar]
- Hayes AJ, MacPherson S, Morrison H, Dowthwaite GP, Archer CW. The development of articular cartilage: Evidence for an appositional growth mechanism. Anat. Embryol. 2001;203:469–479. doi: 10.1007/s004290100178. [DOI] [PubMed] [Google Scholar]
- Lanford PJ, Lan Y, Jiang R, Lindsell C, Weinmaster G, Gridley T, et al. Notch signalling mediates hair cell development in mammalian cochlea. Nat. Genet. 1999;21:253–254. doi: 10.1038/6804. [DOI] [PubMed] [Google Scholar]
- Lawson ND, Scheer N, Pham V, Kim C-H, Chitnis AB, Campos-Ortega J, et al. Notch signalling is required for arterial-venous differentiation during embryonic vascular development. Development. 2001;128:3675–3683. doi: 10.1242/dev.128.19.3675. [DOI] [PubMed] [Google Scholar]
- Leong KG, Hu X, Li L, Noseda M, Larrivee B, Hull C, et al. Activated notch 4 inhibits angiogenesis: role of beta1- integrin activation. Mol. Cell Biol. 2002;22:2830–2841. doi: 10.1128/MCB.22.8.2830-2841.2002. [DOI] [PMC free article] [PubMed] [Google Scholar]
- Lorenzo P, Neame P, Sommarin Y, Heinegard D. Cloning and deduced amino acid sequence of a novel cartilage protein (CILP) identifies a proform including a nucleotide pyrophosphohydrolase. J. Biol. Chem. 1998;273:23469–23475. doi: 10.1074/jbc.273.36.23469. [DOI] [PubMed] [Google Scholar]
- Nickoloff BJ, Qin JZ, Chaturvedi V, Denning MF, Bonish B, Miele L. Jagged-1 mediated activation of notch signalling induces complete maturation of human kerationocytes through NF-kappaB and PPARgamma. Cell Death Differ. 2002;9:842–855. doi: 10.1038/sj.cdd.4401036. [DOI] [PubMed] [Google Scholar]
- Schmid TM, Linsenmayer TF. Developmental acquisition of type X collagen in the embryonic chick tibiotarsus. Dev. Biol. 1985;107:273–281. doi: 10.1016/0012-1606(85)90319-7. [DOI] [PubMed] [Google Scholar]
- Schumacher BL, Block JA, Schmid TM, Aydelotte MB, Kuettner KE. A novel proteoglycan synthesised and secreted by chondrocytes of the superficial zone of articular cartilage. Arch. Biochem. Biophys. 1994;311:144–152. doi: 10.1006/abbi.1994.1219. [DOI] [PubMed] [Google Scholar]
- Shimizu K, Chiba S, Saito T, Kumano K, Hamada Y, Hirai H. Functional diversity among Notch 1, Notch 2, and Notch 3 receptors. Biochem. Biophys. Res. Comm. 2002;291:775–779. doi: 10.1006/bbrc.2002.6528. [DOI] [PubMed] [Google Scholar]
- Ward AC, Dowthwaite GP, Pitsillides AA. Hyaluronan in joint cavitation. Biochem. Soc. Trans. 1999;27:128–135. doi: 10.1042/bst0270128. [DOI] [PubMed] [Google Scholar]
- Weijzen S, Velders MP, Elmishad AG, Bacon PE, Panella JR, Nickoloff BJ, et al. The notch ligand jagged-1 is able to induce maturation of monocyte-derived human dendritic cells. J. Immunol. 2002;169:4273–4278. doi: 10.4049/jimmunol.169.8.4273. [DOI] [PubMed] [Google Scholar]
- Wong MK, Prudovsky I, Vary C, Booth C, Liaw L, Mousa S, et al. A non-transmembrane form of Jagged-1 regulates the formation of matrix-dependent chord like structures. Biochem. Biophys. Res. Commmun. 2000;24:853–859. doi: 10.1006/bbrc.2000.2173. [DOI] [PubMed] [Google Scholar]