Abstract
This paper reports on the development of a theoretical model to simulate the growth and repair of microdamage in bone. Unlike previous theories, which use simplified descriptions of damage, this approach models each individual microcrack explicitly, and also models the basic multicellular units (BMUs) that repair cracks. A computer simulation has been developed that is capable of making a variety of predictions. Firstly, we can predict the mechanical behaviour of dead bone in laboratory experiments, including estimates of the number of cycles to failure and the number and length of microcracks during fatigue tests. Secondly, we can predict the results of bone histomorphometry, including such parameters as BMU activation rates and the changing ratio of primary to secondary bone during ageing. Thirdly, we can predict the occurrence of stress fractures in living bone: these occur when the severity of loading is so great that cracks grow faster than they can be repaired. Finally, we can predict the phenomenon of adaptation, in which bone is deposited to increase cortical thickness and thus prevent stress fractures. In all cases results compare favourably with experimental and clinical data.
Keywords: compact bone, fracture mechanics, microdamage, remodelling, stress fractures
Introduction
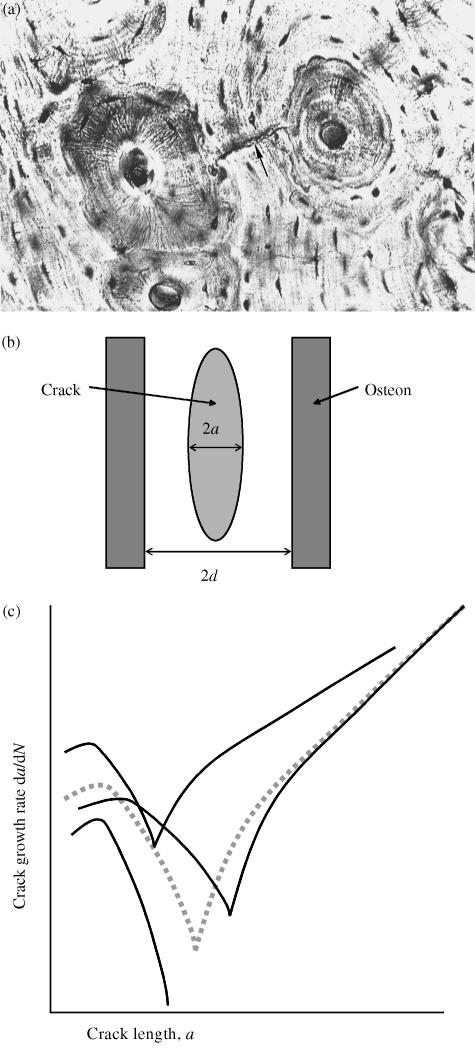
Bone contains small cracks, typically 100 µm in length when viewed on sections cut transverse to a bone's longitudinal axis and somewhat longer when seen on longitudinal sections (Fig. 1). The existence of these so-called ‘microcracks’ or ‘microdamage’ has been known for some four decades, during which time their importance, and especially their significance for the mechanical performance of bone, has increased. Microcracks were first studied in a systematic way by Frost (1960), who devised methods for their observation and classification, and demonstrated unequivocally that they existed in vivo and were not simply artefacts of the methods used for preparing histological samples. Since that time, a body of evidence has grown that links microdamage to a number of important phenomena, including bone remodelling and adaptation and the clinical problems of stress fractures and fragility fractures. We believe that these types of fractures occur because the number and length of cracks increases to the point at which some cracks become macroscopic – reaching lengths of the order of millimetres – causing pain and, in extreme cases, complete fracture of bones. We further believe that bone acts to try to prevent these fractures, using two strategies: (1) repair of microcracks using resorption cavities and (2) adaptation, taking the form of bone deposition to reduce stresses in areas where damage levels are becoming too high.
Fig. 1.
(a)Transverse section showing typical histological structure; two secondary osteons (diameter approximately 200 µm) are visible, with a small crack between them (arrowed). Taken from Griffin et al. (1997) (b) Schematic longitudinal section showing a typical crack and osteons. (c) Schematic illustration of the variation of crack growth rate with crack length (logarithmic scales). The dotted line shows average behaviour; the other lines illustrate typical scatter from one crack to another. The minimum point in each curve occurs when the crack length a becomes equal to the structural dimension d. Curves of this kind can be generated using Eq. (2), by varying certain constants.
The use of the word ‘believe’ in the previous paragraph is deliberate, emphasizing the fact that, currently, there is little if any direct evidence for these links between damage, repair, adaptation and fracture. There is, however, a large amount of what we might call ‘circumstantial evidence’. For example, it seems highly likely that resorption cavities (also called basic multicellular units – BMUs) do not move randomly through bone but specifically target areas containing cracks (Burr & Martin, 1993; Burr, 2000). The absolute necessity for repair, and the conclusion that stress fractures are inevitable without it, has been deduced from theoretical studies (Taylor, 1998a) and also from experience of subjects whose bones, owing to disease or drug treatments, are unable to repair themselves (Flora et al. 1980). To summarize the current state of research in this field, we know that the phenomenon of microcracking exists, and we suspect that a study of it will illuminate our understanding of the mechanical behaviour of bone. However, we have not yet reached the point at which we can quantify the effect of microdamage or make any predictions that can be compared with experimental data.
The issue of quantification is an important one. The field of biomechanics is, by its nature, one in which there is an overlap between the scientific disciplines of medicine/biology and physics/engineering. These fields have their own, very different, traditions of research and investigation. Medical research relies heavily on the observation of living systems – patients in clinical situations and animals in controlled experiments. Conclusions are drawn from the analysis of measured data, using statistical methods to find links between, for example, the level of microdamage in a bone and the age of the subject (Schaffler et al. 1994). By contrast, workers in the physical and engineering sciences normally proceed by developing theoretical models, expressed in mathematical language, which can be used to make a priori predictions of the results of experiments. The success of the theoretical model is measured by the quantitative accuracy of its predictions, and the universality of its application.
Progress in biomechanics can only be made if both of these traditions are followed simultaneously, in interdisciplinary research groups. In this respect, mention can be made of three groups who, through an understanding of both the biological and the mechanical aspects of the problem, have been able to make progress in studying microdamage. Firstly, John Currey and Peter Zioupos (e.g. Zioupos et al. 1996) have measured the evolution of microdamage, focusing their attentions largely on dead bone. They linked the amount of damage to changes in other mechanical properties, notably elastic stiffness (Young's modulus), thus paving the way for an approach using the techniques of damage mechanics. Damage mechanics is extensively applied for the study of complex failure modes in engineering materials as it is able to capture mathematically the relationship between damage (e.g. microcracking or plastic deformation) and mechanical properties (e.g. elastic stiffness or failure strength). Secondly, Bruce Martin has developed sophisticated models of the damage-mechanics type (e.g. Martin, 1995), drawing heavily on his experience with David Burr and others who have studied microcrack development in vivo and its relation to bone remodelling parameters such as BMU behaviour (Burr et al. 1998). Thirdly, our own research group has developed new methods for detecting and measuring microcracks using serial staining techniques (O’Brien et al. 2002b), combining this with theoretical modelling based on fracture mechanics.
The aim of the present paper is to describe the development of our theoretical model, which is unique in so far as it attempts to predict explicitly the length of every microcrack in a given volume of bone, and to follow the growth and repair of these microcracks in a specific simulation. We developed this model because we felt that progress could only be made in this field if all the experimental data being generated by ourselves and others could be compared, in a precise and quantitative manner, with predictions from a single theoretical model. This was an ambitious aim, which has still only been partially fulfilled. This paper describes, without concentrating on the mathematical details, the genesis and development of this model, its achievements to date – including some new predictions of the behaviour of living bone – and its prospects for the future.
Methods and materials: development of the theoretical model
An equation for microcrack growth
Our theoretical model began with a mathematical description of the rate of crack growth for a single microcrack (Taylor, 1997). Table 1 gives a list of the various mathematical symbols used below, and their definitions. The crack is assumed to grow by fatigue, so its growth is governed by its length (2a) and by the range of cyclic stress in the surrounding material (Δσ). We reasoned that the crack would grow relatively quickly when it was very small, as it will form in a relatively weak part of the bone. Crack growth will slow down as it reaches any features in the bone that act as barriers to growth; observation has shown (Griffin et al. 1997; O’Brien et al. 2002a) that the principal barriers in human bone are the cement lines surrounding secondary osteons (Fig. 1a,b) so their spacing (2d) becomes another factor in the model. When the crack is very long (compared with the osteon spacing) it has much more energy and thus will no longer be affected by individual barriers; it will tend to accelerate as it grows, with the amount of growth on each stress cycle, da/dN, being governed by the range of cyclic stress intensity ΔK, where
Table 1.
Definitions of mathematical symbols used
| Symbol | Definition |
|---|---|
| a | Crack length (measured from centre to tip) |
| A | Constant in the equation for crack density |
| B | Constant in the equation for crack density |
| C, C′ | Constants in the equation for crack growth rate |
| d | Microstructural barrier spacing |
| F | Geometry factor in the equation for ΔK |
| n, n′, m | Constants in the equation for crack growth rate |
| N | Number of stress cycles |
| Δσ | Range of stress (peak-to-peak) in a stress cycle |
| σmax | Maximum stress in a stress cycle |
| ΔK, ΔKth | Range (peak-to-peak) of stress intensity, and its threshold |
| ρv | Density of cracks (number of cracks per unit volume) |
| (1) |
Here F is a constant that depends on the shape of the crack. Similar behaviour is well known in the growth of cracks in metals, fibre-composites and other engineering materials (e.g. Miller & de los Rios, 1992). Using this established wisdom, we developed an equation to describe crack growth in bone, as follows:
| (2) |
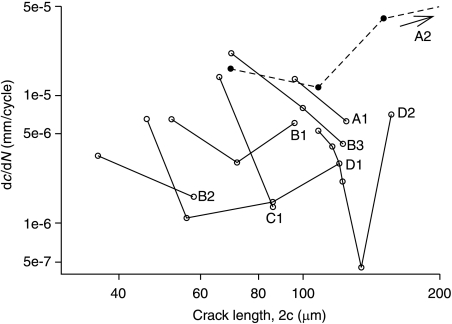
The first term dominates when the crack is relatively long, and the second term dominates when the crack is short: each term is set to zero if it becomes negative. Figure 1 shows the general form of the variation of growth rate with crack length. Crack growth reaches a minimum value when the crack length is similar to the barrier spacing, i.e. when the crack tips have reached the cement lines. When this equation was originally proposed (Taylor, 1997) there was no direct experimental evidence to support it: values for the various constants were estimated from other data such as the change in elastic stiffness with crack length (Taylor, 1998b). Subsequently, it was shown by Akkus & Rimnac (2001) that microcracks in bone did indeed show growth rate characteristics of this form: Fig. 2 shows some of their experimental data.
Fig. 2.
Crack propagation data from short fatigue cracks in compact bone: crack growth rate as a function of crack length. Each line corresponds to one individual crack (Akkus & Rimnac, 2001).
One feature of microcracks in bone is rather unusual and worthy of comment: as Fig. 1(b) shows, they tend to be elliptical in shape and orientated approximately parallel to the longitudinal axis of the bone. At first sight this seems surprising because the driving force for crack growth would be larger if the crack was more inclined to the long axis. The explanation is found in the anisotropy of bone: longitudinal cracks form easily by interlamellar splitting so their orientation is determined by the material's structure rather than the direction of loading. Theoretically, if the angle between crack and longitudinal axis is zero then there is no driving force for crack growth. In practice, cracks lie at slight angles to this axis, typically 20°: the predominant type of loading is longitudinal compression, which generates shear stresses across the crack faces.
Statistical factors
The experimental data (Fig. 2) illustrate dramatically the wide variation in behaviour from one crack to another. Each line on the plot represents one individual crack: the general behaviour is the same for each crack but the positions of the lines vary greatly, causing differences of several orders of magnitude between growth rates of different cracks at the same length. In some cases crack growth ceases completely when the crack tip reaches the barrier, so the subsequent increase in crack growth is missing. This large amount of scatter is to be expected because each crack will be sensitive to the material in its local environment. This scatter was reproduced in the theoretical model by varying certain constants in Eq. (2). In principle, all the constants can be considered to be stochastic, i.e. to be characterized by a distribution with a mean and a standard deviation. However, we reasoned that it should only be necessary to do this for three constants, as these are the ones in which large variations exist. These are: (1) the rate constant for short crack growth (C′), (2) the long-crack threshold ΔKth (whose variation has a strong effect on the minimum growth rate) and (3) the spacing of osteons (2d). These variables were assumed to have normal (i.e. Gaussian) distributions except for C′, which was log-normal. More details can be found in Taylor et al. (2002). Figure 1 shows schematically how this affects the growth behaviour of individual cracks. In principle, then, we now have a way of describing the growth characteristics of each individual crack in a large population of cracks such as exists in a given bone.
Crack initiation and failure
Two further factors are needed in order to describe the growth of cracks in a sample of bone. Firstly, we need to specify the conditions under which cracks are formed: when will a crack first appear and what length will it be at that time? We assumed that all cracks are formed during the first stress cycle (essentially at time zero) and that at this point all cracks have the same length, equal to 1 µm. These assumptions may seem strange, but they are in fact in line with current thinking on the behaviour of fatigue cracks in other materials (Miller & de los Rios, 1992). The initiation stage – the number of stress cycles needed to form a crack in initially perfect material – is generally small enough that it can be neglected compared with the time taken for the crack to grow to a dangerous length. The initial length of the crack (1 µm) was taken to be the typical spacing between lamellae, but it was found that the results did not strongly depend on this value in any case. One factor that cannot be determined from theoretical considerations is the number of cracks that will form. We reasoned that the number of initiated cracks would increase with stress level, and found experimentally that the data conformed to an equation of the form
| (3) |
Here ρV is the density of cracks (number per unit volume), σmax is the maximum stress in the stress cycle, and A and b are constants.
We also need to specify the conditions for final failure of the bone, in order to be able to simulate stress fractures. This was assumed to occur when any one of the cracks in the population reached a length of 1 mm. This value is not critical because by this time the crack is growing so fast (compared with when it has a length of 0.1 mm, for example) that the final number of cycles to failure is not greatly affected. The densities of cracks involved is sufficiently low that we can safely assume that there will be no interaction between cracks.
Repair and adaptation
Two further factors are needed before the model is complete: the simulation of the repair activity of BMUs and the effect of bone adaptation. Repair was simulated by creating, in the model, a BMU for each crack. The BMU is caused to appear when crack length exceeds some threshold value – we chose a length of 100 µm. Thereafter, the growth and movement of the BMU conform to behaviour previously measured by Frost (1969) and many other workers since. For example, a typical rate of movement of the resorption cavity along the bone is 40 µm day−1: this controls the rate at which a crack can be removed. A typical diameter for the cavity is 200 µm, which limits the size of crack that can be repaired.
Unlike BMU activity, the dynamics of bone adaptation are poorly understood, though it is known that cortical bone can be deposited at rates between 1 and 100 µm day−1 (Martin et al. 1998). We assumed that deposition would start if a crack became so long that it could no longer be repaired by a single BMU (2a = 200 µm), and would cease if all cracks in the bone were shorter than this value. Currently, it is not known how bone is able to detect the presence of microcracks or to initiate the processes of repair and adaptation. It seems likely that these decisions are taken at the level of individual cells (osteocytes), probably communicating with each other via cell processes that are located in thin channels (canaliculi) in the bone. The excessive straining or failure of these cells or their processes may give rise to biochemical signals, but as yet the nature of these signals is unknown.
Results and discussion
The behaviour of dead bone
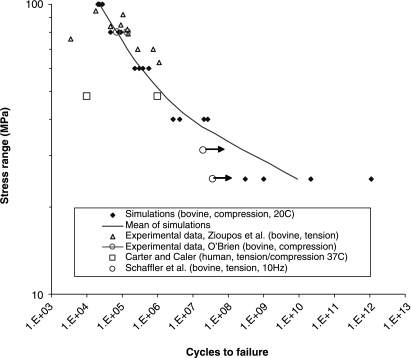
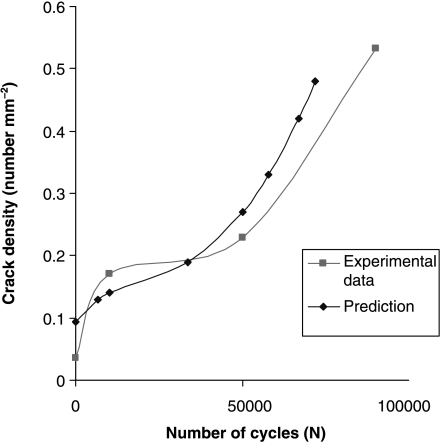
We first used the model to predict data from experiments conducted on dead bone. The details of this investigation have been described elsewhere (Taylor et al. 2002; Taylor & Lee, 2003): here we present two examples to illustrate the kind of information that can be obtained. Figure 3 shows predictions of the number of cycles to failure for samples of cortical bone subjected to cyclical stresses of various magnitudes in standard laboratory fatigue tests. Our theoretical model can be built into a computer program to simulate a series of fatigue tests, predicting not only the general trend in behaviour but also the degree of scatter from one test sample to another. Figure 4 shows predictions of the number density of cracks as a function of the number of applied stress cycles. This graph has a complex shape in which there is an initial rapid increase in the density of cracks, followed by a period of relative dormancy with another increase as failure approaches. Other experimental data that could be predicted include: (1) crack length (average and standard deviation) as a function of time during a fatigue test, (2) the number of cracks that are growing (as opposed to dormant) at any point in time and (3) the effect of sample size (larger samples will, on average, fail sooner than smaller ones because they contain more cracks).
Fig. 3.
Comparison of simulated and experimental fatigue test data, plotting the number of cycles to failure as a function of the applied stress range. Arrows on data points indicate non-failure. References are as follows: Zioupos et al. (1996), O’Brien et al. (2003), Carter & Caler (1983) Schaffler et al. (1990).
Fig. 4.
Experimental data (O’Brien et al. 2003) and predictions showing the variation in crack density with number of cycles during a fatigue test at a stress level of 80 MPa.
A major difficulty with this type of model is the large number of constants in the equation, including the extra constants needed to describe the statistical variation of certain parameters. This implies that, in order for the model to be useful, it must be capable of predicting a large amount of experimental data. In this respect our predictions of the behaviour of dead bone were successful owing to the large range of different types of data that could be considered. Specifically, the model has 14 independent constants (i.e. 14 degrees of freedom) but we were able to predict 20 different experimental constants, thus making ‘real’ predictions of six independent experimental results. The accuracy of prediction was high – the average difference between measured and predicted values being only 26%. This test of the accuracy and usefulness of the theoretical model is an important step in establishing its validity, giving us confidence in any future predictions we can make.
Living bone: repair and adaptation
To investigate the dynamics of the damage/repair/adaptation system in living bone we set up simulations in which a typical long bone was represented by a parallel-sided tube subjected to a cyclical load applied in compression, at a frequency of 5000 cycles day−1, with a minimum load of zero, giving an initial value of Δσ, which will then change if deposition occurs on the bone's surface. The number of cracks was chosen so as to model one thin ‘slice’ of this bone, of length 450 µm. We examined primarily the effect of changing the initial stress range, running the same simulation 10 times at each stress level to obtain some simple statistics. Our simulations had three possible outcomes:
stability – no bone deposition, no failure;
adaptation – bone deposition leading to a new, stable condition in which the bone cortex is thicker;
failure – a stress fracture, which occurs if one or more cracks grow more quickly than they can be repaired, eventually reaching the target length (1 mm).
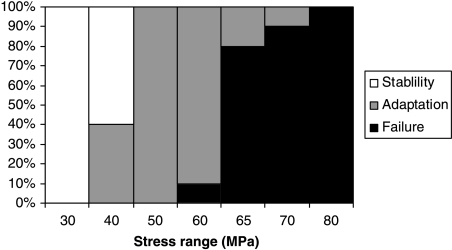
Figure 5 summarizes the results, showing the outcomes at different stress levels. For Δσ ≥ 80 MPa, failure occurred in all cases; at 50 MPa all simulations showed deposition of bone, and ≤ 30 MPa all simulations were stable. There was some overlap between outcomes at the other stress levels, as would be expected from the statistical nature of the simulations. Thus at 40 MPa, 40% of the simulations showed some deposition, the other 60% being stable, whereas in the range 60–70 MPa an increasing proportion of samples failed rather than being saved by deposition.
Fig. 5.
Summary of results simulating the behaviour of a living bone subjected to cyclical stress at various different levels. Ten simulations were run at each stress level. The vertical axis shows the percentage of each of three types of behaviour that occurred.
The current simulation is clearly simplistic in the assumptions it makes about bone geometry and loading, and therefore was not expected to give precise predictions. Nevertheless, the results have several very realistic features. The stress level at which adaptation begins, 40 MPa, is equivalent to a strain of 2350 µɛ for a typical elastic modulus of 17 GPa. This is similar to the maximum strain levels that are known to occur during strenuous activities in humans and many other animals, which generally lie in the range 2000–3500 µɛ[Rubin (1984) and also Ekenman et al. (1998) have measured values as high as 4000 µɛ in certain jumping exercises]. If such a stress cycle is performed 5000 times per day this is equivalent to running several kilometres each day. Clearly this level of activity, or higher, is sufficiently unusual that some adaptation is to be expected. At 60 MPa (3530 µɛ), stress fractures begin to occur: this corresponds to the upper limit of possible in vivo strains. In practice, stress fractures are known to occur at lower strain levels: that this does not happen in our simulations is probably due to statistical size effects (see below).
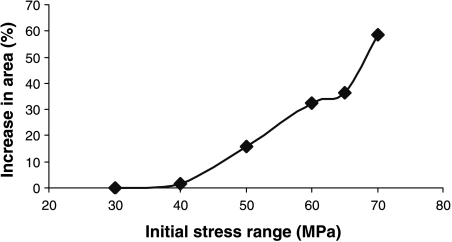
Figure 6 shows the average amount of bone deposition that occurred, as a function of the initial stress level. At 40 MPa the amount of deposition was very small; between this level and the point at which stress fractures begin (60 MPa), bone area increased by 20–30%, at which point deposition ceased. This is very similar to values measured for professional athletes and others who engage in extensive exercise for long periods: for example, Jones et al. (1977) measured a thickness increase of 35% in the playing arms of professional tennis-players.
Fig. 6.
Increase in area (due to bone deposition) during simulations, as a function of the initial stress range.
At 60 MPa and above fractures start to develop, and very large increases in bone area occur in those cases when they are prevented. It may not be physically possible to deposit this much new bone, and in any case these stress levels are greater than any that would occur in vivo. When stress fractures occur, they do so over time periods from 11 to 40 days, depending on the stress level. This agrees closely with the clinical literature, which reports that the incidence of stress fractures (for example in military recruits) peaks in the period 2–8 weeks from the start of exercise (Burr, 1997). In our simulation the upper limit of 40 days is related to the time needed for repair: if cracks are growing so slowly that they take more than 40 days to cause failure, then they will always be repaired in time.
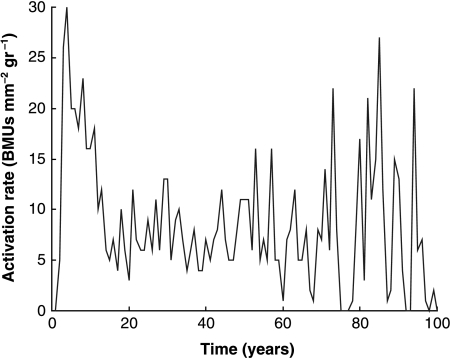
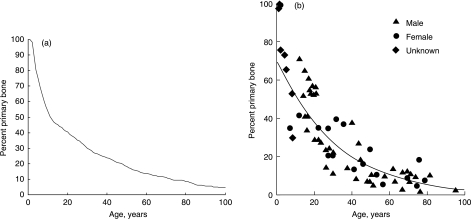
Because the simulation includes the creation of BMUs, which themselves give rise to secondary osteons, we can record two further parameters that are commonly measured experimentally: the activation rate for BMUs and the proportion of secondary bone vs. primary bone. Figures 7 and 8 show results from a simulation in which the stress level was chosen to be 25 MPa for 45 000 cycles day−1– a typical level for a normal active person. The BMU activation rate (Fig. 7) shows considerable variation from year to year, being dependent on the growth rates of individual cracks, whose behaviour is highly scattered when they are small owing to our stochastic variables. This prediction can be compared with experimental values measured in vivo (Frost, 1969), which fell in the range 1–20 BMUs mm−2 yr−1. The higher values, of the order of 20, occurred in young people owing to bone growth and modelling, which is not covered in our simulation so our results for the age range 0–20 are expected to be lower than true values. For mature people, Frost measured activation rates of 1.1 and 2.2 BMUs mm−2 yr−1 for ages ranges of 30–39 and 70–89 years, respectively. Our simulation gives very similar results, even showing a tendency for the activation rate to increase in the oldest subjects, which one would not at first expect to happen. The success of the simulation implies that BMU activity in skeletally mature subjects is due entirely to the need for repair of microdamage. Figure 8 shows the changing proportion of primary to secondary bone with age as measured for human subjects, and the very similar results achieved using our simulation.
Fig. 7.
Activation rate for BMUs in the simulated bone in each year of life for a stress range corresponding to a normal, active lifestyle.
Fig. 8.
The decreasing percentage of primary bone due to formation of secondary bone during life. The simulation – on the left – compares favourably with experimental results (Martin et al. 1998) – on the right.
Limitations and future potential of the model
There is no denying that development of a theoretical model in this field is a very ambitious enterprise. However, we believe that such a model is essential if any real progress is to be made in understanding the relationship between damage, repair, remodelling and adaptation. Many computer simulations have been devised to attempt to predict bone adaptation but these models work from global mechanical parameters such as stress or strain-energy density, using arbitrary relationships between these parameters and the degree of bone deposition or resorption. It is becoming clear that the link between experimental data and theory cannot be made unless we include in our models the specific physical mechanisms that operate – in this case microcracks and BMUs.
One limitation of our model is that it requires a significant amount of computing power to follow the growth of each crack individually. In the present work we considered only a thin slice of bone tube, 450 µm thick; this will contain several hundred cracks and a typical simulation takes about 10 min on a normal computer (PC). To model an entire tibia would take several days or require the use of a more powerful computer. The computation required is similar to that needed for a detailed stress analysis using the finite-element method, and in fact this simulation could be run in conjunction with a finite-element analysis to determine how stress levels would change during adaptation. One important effect of size is that, if we model a larger volume of bone, the probability of a stress fracture occurring will increase owing to the statistical effect created by the larger number of cracks present. This effect is quite dramatic, and may explain why stress fractures do not occur within the in vivo stress range in our present simulations (Fig. 5). Another limitation of our model is that it does not include any simulation of bone resorption, which occurs at low stress levels; it is planned to add this aspect to the model at a later stage.
Our model is by no means complete: it contains many simplifications and assumptions, but we have been surprised by its current successes, by the number of phenomena that can be simulated and the relatively accurate quantitative predictions that can be achieved in many cases. At this stage we make no strong claims for the model, beyond stating that it provides a framework upon which more detailed and sophisticated models can be constructed. This is because we have taken a ‘bottom-up’ approach, starting from the basic physical micromechanisms involved.
This is a basic study whose clinical applications are not immediate; however, the results do suggest some clinical uses in the future. For example, predictions of stress fracture during exercise could be expressed in terms of risk factors for given individuals, which would be functions of the applied forces and numbers of repetitions in the exercises, and the quality of the individual's bone stock, which would itself be a function of age etc. Absolute predictions are unlikely to be successful given the many assumptions made, but it might be possible to predict quite accurately the relative factors, for example the increased risk associated with a given change in exercise regime for a given person. Currently, it is not possible to observe and measure microcracks in vivo but work to develop such a technique is ongoing in our laboratories. If this technique becomes a reality then our theoretical model will become much more important as part of a clinical tool.
References
- Akkus O, Rimnac CM. Cortical bone tissue resists fatigue fracture by deceleration and arrest of microcrack growth. J. Biomech. 2001;34:757–764. doi: 10.1016/s0021-9290(01)00025-2. [DOI] [PubMed] [Google Scholar]
- Burr DB, Martin RB. Calculating the probability that microcracks initiate resorption spaces. J. Biomech. 1993;26:613–616. doi: 10.1016/0021-9290(93)90023-8. [DOI] [PubMed] [Google Scholar]
- Burr DB. Bone, exercise and stress fractures. Exerc. Sport. Sci. Rev. 1997;25:171–194. [PubMed] [Google Scholar]
- Burr DB, Turner CH, Naick P, Forwood MR, Ambrosius W, Hasan MS, et al. Does microdamage accumulation affect the mechanical properties of bone? J. Biomech. 1998;31:337–345. doi: 10.1016/s0021-9290(98)00016-5. [DOI] [PubMed] [Google Scholar]
- Burr DB. Damage detection and behaviour in bone. In: Prendergast PJ, Lee TC, Carr AJ, editors. In Proceedings of the 12th Conference of the European Society of Biomechanics. Dublin: Royal Academy of Medicine in Ireland; 2000. p. 38. eds. [Google Scholar]
- Carter DR, Caler WE. Cycle-dependent and time-dependent bone fracture with. repeated loading. J. Biomed. Eng. 1983;105:166–170. doi: 10.1115/1.3138401. [DOI] [PubMed] [Google Scholar]
- Ekenman I, Halvorsen K, Westblad P, Fellander-Tsai L, Rolf C. Local bone deformation at two predominant sites for stress fractures of the tibia: an in vivo study. Foot and Ankle International. 1998;19:479–484. doi: 10.1177/107110079801900711. [DOI] [PubMed] [Google Scholar]
- Flora L, Hassing GS, Parfitt AM, Villanueva AR. Comparative skeletal effects of two diphophonates in dogs. Metab. Bone Dis. Rel. Res. 1980;25:389–407. doi: 10.1016/0221-8747(81)90045-x. [DOI] [PubMed] [Google Scholar]
- Frost HM. Presence of microscopic cracks in vivo in bone. Henry Ford Hospital Med. Bull. 1960;8:25–35. [Google Scholar]
- Frost HM. Tetracycline-based histological analysis of bone remodelling. Calcified Tissue Res. 1969;3:211–237. doi: 10.1007/BF02058664. [DOI] [PubMed] [Google Scholar]
- Griffin LV, Gibeling JC, Martin RB, Gibson VA, Stover SM. A model of flexural fatigue damage accumulation for cortical bone. J. Orthop. Res. 1997;15:607–614. doi: 10.1002/jor.1100150418. [DOI] [PubMed] [Google Scholar]
- Jones HH, Priest JD, Hayes WC, Tichenor CC, Nagel DA. Humeral hypertrophy in response to exercise. J. Bone Joint Surg. 1977;59A:204–208. [PubMed] [Google Scholar]
- Martin RB. Mathematical model for repair of fatigue damage and stress fracture in osteonal bone. J. Orthop. Res. 1995;13:309–316. doi: 10.1002/jor.1100130303. [DOI] [PubMed] [Google Scholar]
- Martin RB, Burr DB, Sharkey NA. Skeletal Tissue Mechanics. New York: Springer-Verlag; 1998. [Google Scholar]
- Miller KJ, de los Rios ER. Short Fatigue Cracks. London: MEP.; 1992. [Google Scholar]
- O'Brien FJ, Taylor D, Brennan O, Lee TC. The effect of bone microstructure on the initiation and growth of microcracks. 48th Annual Meeting of the Orthopaedic Research Society; Dallas, Texas. 2002a. p. 324. [DOI] [PubMed] [Google Scholar]
- O'Brien FJ, Taylor D, Lee TC. An improved labelling technique for monitoring microcrack growth in compact bone. J. Biomech. 2002b;35:523–526. doi: 10.1016/s0021-9290(01)00200-7. [DOI] [PubMed] [Google Scholar]
- O'Brien FJ, Taylor D, Lee TC. Microcrack accumulation at different intervals during fatigue testing of compact bone. J. Biomech. 2003;36/7:973–980. doi: 10.1016/s0021-9290(03)00066-6. [DOI] [PubMed] [Google Scholar]
- Rubin CT. Skeletal strain and the functional significance of bone architecture. Calcified Tissue Int. 1984;36:511–518. doi: 10.1007/BF02406128. [DOI] [PubMed] [Google Scholar]
- Schaffler MB, Radin EL, Burr DB. Long-term fatigue behaviour of compact bone at low strain magnitude and rate. Bone. 1990;11:321–326. doi: 10.1016/8756-3282(90)90087-f. [DOI] [PubMed] [Google Scholar]
- Schaffler MB, Choi K, Milgrom C. Microcracks and aging in human femoral compact bone. Proceedings of the 40th Annual Meeting of the Orthopedic Research Society; 1994. pp. 190–32. [Google Scholar]
- Taylor D. Bone maintenance and remodelling: a control system based on fatigue damage. J. Orthop Res. 1997;15:601–606. doi: 10.1002/jor.1100150417. [DOI] [PubMed] [Google Scholar]
- Taylor D. Fatigue of bone and bones: an analysis based on stressed volume. J. Orthop. Res. 1998a;16:163–169. doi: 10.1002/jor.1100160203. [DOI] [PubMed] [Google Scholar]
- Taylor D. Microcrack growth parameters for compact bone deduced from stiffness variations. J. Biomech. 1998b;31:587–592. doi: 10.1016/s0021-9290(98)00050-5. [DOI] [PubMed] [Google Scholar]
- Taylor D, O'Brien F, Lee TC. A theoretical model for the simulation of microdamage accumulation and repair in compact bone. Meccanica. 2002;3179:1–10. [Google Scholar]
- Taylor D, Lee TC. A crack growth model for the simulation of fatigue in bone. Int. J. Fatigue. 2003;25:387–396. [Google Scholar]
- Zioupos P, Wang XT, Currey JD. Experimental and theoretical quantification of the development of damage in fatigue tests of bone and antler. J. Biomech. 1996;29:989–1002. doi: 10.1016/0021-9290(96)00001-2. [DOI] [PubMed] [Google Scholar]


