Abstract
A cell composition analysis was made of the pancreatic islets in postnatal H253 mice. This line has a lacZ insertion on the X chromosome so that in female hemizygotes 50% of cells should be positive for β-galactosidase and 50% negative. Immediately after birth, the islets were of a heterogeneous cell composition. However, by 4 weeks some islets have become homogeneous. This suggests that islets progress towards monoclonality in a similar way to the intestinal crypts and stomach gastric glands. Pancreatic islets may therefore represent ‘structural proliferative units’ in the overall histological organization of the pancreas. Reduction of genetic heterogeneity might arise from cell turnover, fission of islets or both. Analysis of the cell composition of the X-inactivation mosaic mice also provides the first clear evidence for islet fission in pancreatic development. Irregularly shaped islets resembling dumb-bells, with a characteristic neck of α-cells, were observed with decreasing frequency with increasing age. Three-dimensional reconstruction confirmed their resemblance to conjoined islets. The cell composition analysis showed: (1) the relatedness of the two sides of a dumb-bell islet is significantly higher than between two non-dumb-bell islets and (2) the relatedness of two randomly selected islets decreases as the distance between them increases. This suggests that dumb-bell islets are in a state of fission rather than fusion, and that islet fission is a mode of islet production in the postnatal pancreas.
Keywords: acini, dumb-bell islet, H253 mouse, islet fission, islets of Langerhans, pancreas, stem cells, structural-proliferative units, X-inactivation mosaic
Introduction
The pancreas is an especially important organ from a medical perspective as it is the target of two major diseases: diabetes mellitus and pancreatic cancer. It is to be hoped that a better understanding of the development of the pancreas will eventually contribute to the development of novel therapies for the treatment of either or both of these diseases. The two main functions of the pancreas are performed by distinct types of glandular tissue: the exocrine pancreas secretes enzymes and salts into the gut, and the endocrine pancreas secretes hormones into the bloodstream, which regulate blood glucose levels. The exocrine pancreas comprises a system of terminal and intercalary acini with small lumens, connected by ducts. The endocrine cells are predominantly aggregated into the islets of Langerhans, embedded within the exocrine tissue. The insulin-producing β-cells form the central islet core and account for 60–80% of the islet cells. Composing the peripheral islet mantle are the glucagon-secreting α-cells and smaller numbers of δ-cells and PP-cells, which synthesize and release somatostatin and pancreatic polypeptide, respectively. The relationship between this histological appearance and the organization of cell renewal is not understood. Indeed, even the embryological cell lineage is not really understood, except in so far as all the epithelial cell types are known to be derived from the embryonic endoderm (Pictet & Rutter, 1972; Percival & Slack, 1999; Gu et al. 2002). Some other epithelia are organized into ‘structural–proliferative units’ or SPUs, which are self-contained units of tissue organization equipped with their own stem cells (Potten, 1978, 1998). However, it is presently not known whether the visible structures within the pancreas represent SPUs.
As in other vertebrates, the pancreas of the mouse originates embryologically as separate dorsal and ventral rudiments that subsequently fuse to form a single organ. At around embryonic day (E) 9.5, the dorsal pancreatic bud first appears as an evagination in the primitive gut endoderm, at the foregut–midgut junction. This is followed by the appearance of the ventral pancreatic rudiment on the opposite side of the gut tube around 1 day later. Migration of the ventral bud around the foregut results in fusion of the two buds at around E16–17 to form the single unified organ. The pancreatic buds grow into their surrounding mesoderm and rapidly form new protrusions. Acini and ducts become clearly visible as histologically differentiated structures by E14.5. Some hormone-containing cells can be detected in the dorsal pancreas from the earliest stages. At E9.5 cells appear in the region lining the ducts, many containing glucagon and a lesser number expressing insulin; cells expressing somatostatin or pancreatic polypeptide are, respectively, detected at around E15 and perinatally (reviewed by Slack, 1995).
Islets, with their characteristic architecture of central insulin-producing cells and non-insulin-producing cells in the periphery, do not form until near the end of gestation, at around E18.5 (Herrera et al. 1991). It is generally believed that islet formation occurs by the aggregation of pre-existing cells (Deltour et al. 1991; Percival & Slack, 1999). However, the clonal organization of the pancreas has not been examined as a function of time in postnatal animals. We felt it important to do this as it might provide useful information on cell turnover and cell lineage. To this end we have conducted a cell composition analysis of the pancreas from H253 X-inactivation mosaic mice. This line has 14 copies of the E. coli lacZ gene in tandem array close to the Hprt locus on the X-chromosome (Tam & Tan, 1992; Tan et al. 1995). The transgene is driven by the promoter of the ubiquitously expressed 3-hydroxy-3-methylglutaryl coenzyme A (HMG CoA) reductase gene. Female homozygotes or males show uniform expression of β-galactoside (β-gal) in all tissues, at least during embryonic stages. During early embryonic development, one of the two X-chromosomes in each cell of female mammals becomes randomly silenced (Lyon, 1961). After this stage, clones of cells from female heterozygous (or more accurately, hemizygous) H253 animals either stably express, or stably do not express, β-galactosidase, depending on which of the two X-chromosomes was inactivated. This means that the whole embryo is a fine-grained mosaic of β-gal+ and β-gal− cells. Any subsequent departure from a well-mixed clonal pattern within a particular tissue can arise only if a small number of cells populates each structural unit of the tissue. In the limiting case in which each structural unit is populated by the descendants of just one cell, it should become homogeneous with respect to β-gal expression. This is, for example, the case in the gastric glands and intestinal crypts (Ponder et al. 1985; Canfield et al. 1996; Nomura et al. 1998). Previous studies on H253 mice have shown that X-inactivation is completed by E9.5 (Tan et al. 1993). The possibility of reactivation of the previously silent X-chromosome has been examined and found not to occur to any significant degree (Nomura et al. 1998).
It was hoped that a study of the structural units of the pancreas in H253 hemizygotes would provide information about the evolution of their clonal composition and thereby information about their cell lineage and cell turnover. Our results show that pancreatic islets are of a heterogeneous cell composition in the neonatal period. As the mice age, a proportion of islets becomes homogeneous, and therefore mono- or oligo-clonal. This shift in islet cell composition is presumably brought about by a rapid decline in the number of progenitors or stem cells in each islet. This might arise either from cell death within islets or from a division of islets, either of which would reduce the effective number of progenitor cells in each islet. Fission of islets has not previously been described, but we have used the mixed cell composition seen in the H253 female hemizygotes to prove that the dumb-bell-shaped islets seen in young (and more infrequently, older) mice are, in fact, dividing and not fusing. The results show that pancreatic islets are much more dynamic over the first few postnatal weeks than hitherto believed and suggests that pancreatic islets may be structural–proliferative units, in the same way as intestinal crypts or gastric glands.
Materials and methods
Mice
H253 mice were created by Dr S. Tan (Tam & Tan, 1992) and were used with his permission. The mice were obtained from the MRC Mammalian Genetics Unit, Harwell, UK, and housed under standard conditions on a 13-h light : 11-h dark cycle (lights on 06:30–19:30 h, including 30-min periods of dim lighting to provide false dawn and dusk) at 21 ± 2 °C and at a relative humidity of 55 ± 10%. Food (CRM formula; Special Diets Services, Witham, Essex, UK) and water were provided ad libitum.
H253 male mice were mated to F1 (C57BL/6 × CBA) females or to female H253 hemizygotes. All female offspring from the first mating scheme were hemizygous for the transgene whereas from the second mating scheme 25% of offspring were females homozygous for the lacZ transgene, 25% were hemizygous females, 25% were hemizygous males and the remaining 25% of the offspring were non-transgenic males.
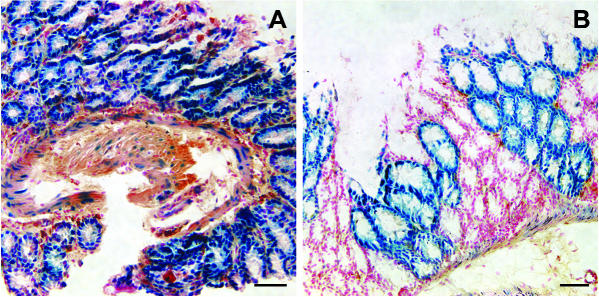
Offspring from crosses were genotyped on the basis of β-gal expression pattern in the crypts of the small intestine or gastric glands of the stomach; both the crypts (Ponder et al. 1985) and the gastric glands (Canfield et al. 1996; Nomura et al. 1998) of adults have previously been shown to be monoclonal. Following 4-chloro-5-bromo-3-indolyl-β-d-galactopyranoside (X-gal) staining, a ubiquitous pattern is shown by homozygous females and hemizygous males (Fig. 1A), whereas hemizygous females exhibit a mosaic of homogeneous β-gal+ and homogeneous β-gal− crypts (Fig. 1B).
Fig. 1.
Characteristic pattern of X-gal staining for β-gal activity in the intestinal crypts. (A) H253 homozygous female. (B) Hemizygous, X-inactivation mosaic female. Scale bar = 100 µm.
Developmental series
Series 1 was analysed at postnatal (PN) day 3 (n = 2), PN7 (n = 2), PN14 (n = 2), PN21 (n = 2), PN28 (n = 1), PN12 weeks (n = 2), PN26 weeks (n = 3) and PN52 weeks (n = 2). Series 2 was analysed at PN5, PN10, PN15, PN20, PN25 and PN30 (n = 5 per time point). Series 3 was analysed at just PN28 (n = 3 hemizygotes with two positive controls). Animals were killed by cervical dislocation and their pancreata rapidly excised. Series 1 was analysed by X-gal staining, Series 2 by immunostaining for β-gal and Series 3 by both methods on adjacent sections.
Simvastatin treatment
Results from Series 1 and 2 indicated some variability in the expression of β-gal in islet cells. To decrease this variability and to elevate the overall production of β-gal in cells retaining the active marker, simvastatin (Calbiochem 567020) was administered orally (1 mg 100 mL−1 drinking water) for 10 days between PN20 and 30 to two litters of H253 mice examined at PN30. Simvastatin lowers cholesterol, a negative inhibitor of HMG CoA reductase (Goldstein & Brown, 1990; Stone et al. 2002).
Controls for promoter activity
Pancreatic tissue from non-transgenic male and homozygous female (or hemizygous male) littermates at each time point was analysed to act as a negative control for transgene expression in the former case and as a positive control in the latter case.
Specimen analysis
Fixation and wholemount X-gal staining
Excised pancreata were fixed by immersion in Tissue Fixative (4% PFA, 2 mm MgSO4, 5 mm EGTA in 100 mm Sorensen's phosphate buffer – 100 mm Na2HPO4 and 100 mm NaH2PO4 – pH 7.4) for 45 min to 1.5 h on ice. They were subsequently washed in Tissue Rinse Solution A (2 mm MgCl2, 5 mm EGTA in 100 mm PO4 buffer, pH 7.4) for 30 min at room temperature (RT), then rinsed in Tissue Rinse Solution B (2 mm MgCl2, 0.01% w/v sodium deoxycholate, 0.02% w/v Nonidet P-40 in 100 mm PO4 buffer, pH 7.4) for 5 min at RT. After draining, the tissue was incubated overnight in the dark at 37 °C or 30 °C in fresh, prewarmed Tissue Stain Base (2 mm MgCl2, 0.01% sodium deoxycholate, 0.02% Nonidet P-40, 5 mm K3Fe(CN)6, 5 mm K4Fe(CN)6·6H2O in 100 mm Sorensen's phosphate buffer, pH 7.4) with 1 mg mL−1 of X-gal (4-chloro-5-bromo-3-indolyl-β-d-galactopyranoside; Boehringer Mannheim or Melford Laboratories). Following reaction, pancreata were rinsed in three changes of PBSA.
Paraffin sections
X-gal-stained pancreata were dehydrated overnight, embedded in paraffin-wax by standard methods and sectioned at 7 µm before mounting on glass microscope slides. Slides were either obtained precoated (Polysine™, BDH) or untreated (Single Frost Blue Star, Chance Propper Ltd) and then coated with APTES; slides were washed in hot soapy water, rinsed in MilliRO water, treated with 95% ethanol/1% acetic acid, then dried before immersion in 2% APTES in acetone for 8 min, acetone for 2 × 10 s and MilliRO water for 10 s; prepared slides were dried overnight. The paraffin sections were dewaxed in Histoclear (National Diagnostics) and rehydrated through a graded ethanol series before immunocytochemical staining.
Frozen sections
Following fixation as above, tissue samples were cryoprotected in 5%, then 15% sucrose in 0.1 m potassium phosphate buffer (0.1 m KH2PO4 and 0.1 m K2HPO4), pH 7.6, at 4 °C over successive nights then embedded in OCT compound (BDH). Ten- or 15-µm-thick frozen sections were cut at −17 °C and mounted on gelatin-coated glass microscope slides (Single Frost Blue Star, Chance Propper Ltd). To prepare the slides, they were first submerged in 1 : 1 hydrochloric acid and 100% v/v ethanol for a minimum of 2 h and washed under running water. Following draining, slides were submerged for 10 min in freshly prepared ice-cold gelatin chrome alum solution (0.6% gelatin w/v; 0.03% w/v chromium potassium sulphate) and allowed to air-dry.
Immunoperoxidase cytochemistry
Sections were processed at 4 °C in a humid chamber according to the streptavidin–biotin peroxidase complex (ABC) method in which horseradish peroxidase (HRP) was visualized using 3,3′-diaminobenzidine (DAB) as substrate. The deparaffinized and rehydrated sections were successively: (1) treated with 0.6% H2O2 in PBSA for 30 min at RT; (2) washed in running water; (3) permeabilized in 0.1% Triton-X-100 in PBSA for 1 h at RT; (4) blocked with 2% BB containing 0.1% Triton-X-100 for 1 h at 4 °C; (5) incubated with primary antiserum diluted in 2% BB/0.1% Triton-X-100 overnight at 4 °C; (6) incubated with the relevant biotin-conjugated secondary antiserum diluted in 2% BB/0.1% Triton-X-100 for 1 h at 4 °C; (7) treated with the HRP-labelled streptavidin-biotin complex kit (StreptABComplex; DAKO, Denmark) for 1 h at 4 °C according to the manufacturer's instructions; and (8) treated with 0.1 m Tris buffer, pH 7.4, containing 0.67 mg mL−1 DAB (Sigma) and 0.03% H2O2 (w/v) until appearance of reaction product at RT. When colour development had reached the desired stage, the reaction was halted with tap water, intensifying the reaction product. Between incubations, sections were washed in PBSA for 3 × 15 min. Sections were counterstained in nuclear Fast Red (Vector), dehydrated in graded ethanol, cleared in Histoclear and mounted in DPX (BDH).
Immunofluorescence cytochemistry
Cryosections were successively: (1) washed for 3 × 5 min to solubilize OCT; (2) permeabilized in 0.15% Triton-X-100 in PBSA for 1 h at RT; (3) blocked with 2% BB containing 0.1% Triton-X-100 for 2–3 h at RT; (4) incubated with primary antiserum diluted in 2% BB/0.1% Triton-X-100 overnight at 4 °C; (5) incubated with the relevant fluor-conjugated secondary antibody diluted in 2% BB/0.1% Triton-X-100 for 2 h at RT in the dark; and (6) counterstained in 0.5 µg mL−1 4′,6-diamidino-2-phenylindole (DAPI; Sigma D-9542) then mounted in Gelvatol medium in the dark in the absence of further rounds of antibody incubations. Gelvatol mountant was prepared by dissolving 20 g of polyvinyl alcohol in 80 mL of 10 mm Tris, pH 8.6, including 0.2% NaN3. This was mixed with 50 mL glycerol containing 3 g of n-propyl gallate. Between incubations, sections were washed in PBSA for 3 × 15 min. Where more than one primary antibody was used, the first staining cycle was completed before the second was commenced. Sections were processed at 4 °C in a humid chamber. Adjacent serial sections on the same slide were isolated using a hydrophobic barrier pen (ImmEdge™ Pen, Vector) to permit them to be differentially immunostained (for distinct antigens such as insulin or glucagon, or their absence as control) and to conserve antisera.
Antibodies
The primary antibodies used with source and working dilution were: polyclonal guinea-pig anti-bovine insulin (Sigma I-6136; 1 : 300); monoclonal mouse anti-glucagon (Sigma G-2654; 1 : 300); polyclonal rabbit anti-β-galactosidase (Molecular Probes A-11132; 1 : 300). The biotin-conjugated secondary antibodies used were: goat biotin-conjugated anti-guinea-pig IgG (Sigma B-5518; 1 : 300); horse biotin-conjugated anti-mouse IgG (Vector BA-2000; 1 : 300). The fluor-conjugated secondary antibodies used were: rabbit TRITC-conjugated anti-guinea-pig IgG (Sigma T-7153; 1 : 300); horse Texas Red-conjugated anti-mouse IgG (Vector TI-2000; 1 : 300); goat fluorescein-conjugated anti-rabbit IgG (Vector FI-1000; 1 : 300).
Scoring cell composition
Sections selected for analysis were spaced throughout each pancreas such that no islet was examined more than once and each islet was scored from a single section. Specimens were examined and scored using a Leica DMRB fluorescent microscope. Histochemically stained islets from Series 1 were scored directly from the paraffin sections. Under ×400 magnification islets were identified using glucagon staining to highlight the islet periphery. An islet was defined as five or more contiguous glucagon-immunopositive cells. The number of β-gal+ vs. β-gal− cells within each islet in each section was determined.
Images of specimens were taken with a Spot RT Colour digital camera (National Diagnostics Inc.) and stored as uncompressed 24-bit tagged image file format (.tif) images. Immunofluorescence-stained islets from Series 2 and 3 were scored from hard copies of merged images following adjustment of the three colour channels using the Adobe Photoshop 6.0 package. The total number of β-gal+ and β-gal− cells in each islet in each of the analysed sections was scored.
The morphological examination of islet shape was made from the same paraffin sections of Series 1 animals with controls.
Computer-aided dumb-bell islet 3D reconstruction
The three-dimensional (3D) reconstruction of a representative ‘dumb-bell’ islet was performed as follows. Following spatial calibration of the images, a Macro running in NIH Image 1.6 was used to align serial images to create a z-stack. Using the IDL 5.5 (Research Systems, Inc.) program in conjunction with a stylus and touch-sensitive flat-panel monitor, the outline of the islet was manually traced from the stack of aligned sections. A single object identity was assigned to this islet appearing in the consecutive sections and in this manner a tessellated surface mesh was generated. This was then exported to the POV-Ray program, which projected views of these outlines defining the surface of the mesh. A QuickTime™ movie file representing a 360° rotation around the modelled islet was generated.
Statistical analysis
To analyse the composition data for dumb-bells and non-dumb-bell islet pairs, linear regressions were plotted between: (1) percentage β-gal+ cell composition of each side for each of the dumb-bell islets; (2) similarity of cell composition between non-dumb-bell islet pairs vs. edge-to-edge interislet distance between them; and (3) area (total number of cells) of each side for each of the dumb-bell islets, using the Minitab™ v.13 statistical software package. The Spearman rank correlation coefficient rs for non-normal data was calculated manually to test for a significant correlation between variables. In the event of any outlying data points (outliers), regressions were re-plotted and rs re-calculated without them. Differences between mean dumb-bell and non-dumb-bell islet cross-sectional areas were compared for statistical difference by the two-sample t-test (Minitab™ v.13).
Results
Changing islet composition with time
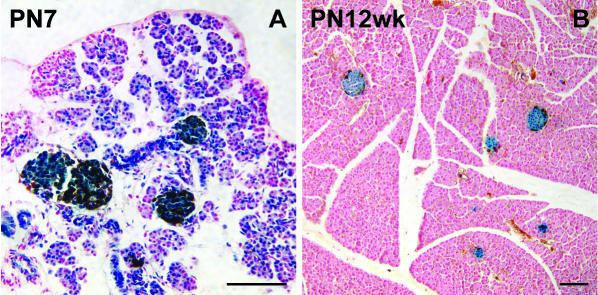
Previous studies of H253 mice have concentrated on embryonic stages. To examine the expression of the β-gal transgene after birth, pancreata were examined from male transgenic and female homozygous H253 animals in which every cell should theoretically express the transgene. Uniform β-gal activity was indeed observed in all pancreatic islets and ducts of all animals under PN18 weeks (Fig. 2). The β-gal is predominantly nuclear, as expected because the transgene encodes a nuclear localization sequence. Non-transgenic animals showed no X-gal staining in the pancreas, confirming the absence of potentially interfering endogenous galactosidases (not shown).
Fig. 2.
β-gal activity is retained in the islets but declines in the acini. (A) X-gal staining is absent in some acini in a PN7 transgenic male. (B) Complete loss of acinar β-gal activity in a PN12 weeks homozygous female. Specimens stained with X-gal and immunoperoxidase-stained for glucagon. Scale bar = 100 µm.
Almost uniform β-gal activity was also observed in the pancreatic acini of E17.5 embryos but in the postnatal mice, the acinar β-gal activity decreased markedly (Fig. 2). Some individual variability was seen in the timing of this loss, although all acinar cells in all animals examined were β-gal− by PN21. We believe that this postnatal loss of acinar β-gal activity is due to a reduced activity of the HMG CoA reductase promoter in this cell type. Cell lineage analysis of the acini was not therefore attempted. Uniform β-gal activity was seen in islets until about PN18 week when some heterogeneity became apparent, probably also due to promoter shutdown. We concluded that cell lineage analysis could be safely carried out on islets up to at least 3 months postnatally.
Islets were analysed from three series of female hemizygote mice, as described in the Materials and methods section. The first series was the largest, the pancreata being examined by X-gal staining and glucagon immunoperoxidase and the ages sampled extended from birth to 1 year of age. The second series used β-gal immunofluorescence combined with either insulin or glucagon immunofluorescence, in order to examine the individual endocrine cell types. The third series were treated with simvastatin to enhance β-gal expression and then adjacent sections were stained either with X-gal, or by immunofluorescence for β-gal and either insulin or glucagon.
Islets were observed of all three possible compositions: mixed β-gal+/β-gal−, homogeneous β-gal+ or homogeneous β-gal−. At the earliest neonatal time points, islets were all of a heterogeneous β-gal+/β-gal− cell composition (Fig. 3), showing a fine-grained mosaicism of widely intermingled β-gal+ and β-gal− cells. At 4 weeks of age, however, some islets were composed of cells of a single genotype: either homogeneous β-gal+ or homogeneous unlabelled cells. In the first series a progression from mixed to mostly homogeneous was seen over the first 4 weeks. This progression was not seen in the second and third series, although some homogeneous islets were found by 4 weeks.
Fig. 3.
Neonatal islets are of a heterogeneous cell composition but some undergo a conversion to a homogeneous state by 1 month after birth. (A) Heterogeneous islets in a PN7 mosaic female. Note fine-grained mosaicism and widespread intermingling of β-gal+ and β-gal− cells. (B) Homogeneous β-gal+ islets in a PN21 mosaic female. (C) Homogeneous β-gal− islets in a PN26 weeks mosaic female. Specimens stained with X-gal and immunoperoxidase-stained for glucagon. Scale bar = 100 µm.
As a result of the discrepancy between the first and second series, the third series were treated with simvastatin. This drug lowers serum cholesterol, a negative inhibitor of HMG CoA reductase, resulting in increased transcription of HMG CoA reductase messenger ribonucleic acid (mRNA) (Goldstein & Brown, 1990). In H253 mice this has previously been shown to lead to an increase in expression of the lacZ gene (Stone et al. 2002). We consider the results from the simvastatin series to be the most reliable and so the following figures come from this group.
The positive controls of Series 3 comprised 28 islets from two transgenic male mice. Among these, 99.6% of the cells were determined to be β-gal+ by histochemical detection of β-gal activity, so islet β-gal expression was considered to be effectively ubiquitous. By comparison, of the same 28 islets in the adjacent sections immunostained for β-gal and glucagon, only 82% of the cells in the same islets were positive. So the immunofluorescence, although suitable for comparative purposes, does not show all of the β-gal-positive cells.
In Series 3, 37 islets were examined from three mosaic females at 30 days of age. Of these, 34 were heterogeneous and three homogeneous. An islet ‘percentage homogeneity’ index was calculated as: (number of cells of the prevailing genotype/total number of cells) × 100, and so ranges between 50% and 100%. It should be noted that the prevailing genotype may be either β-gal positive or negative, as homogenization can go in either direction. This index gives equal weighting to islets of different sizes and was therefore termed the ‘islet-weighted percentage homogeneity’, although in fact the data were very similar when expressed on a cell-weighted basis (not shown). The mean islet-weighted (and cell-weighted) homogeneity was 76%. In the first series, a much higher proportion of islets were homogeneous at time points beyond 21 days, although because the quality of specimen preparation was lower, these could not be quantified with the same degree of accuracy.
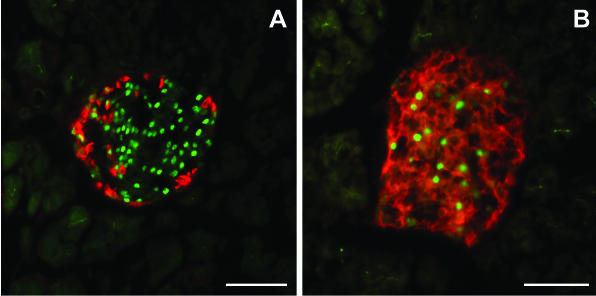
In Series 2 and 3 it was possible to examine the cell composition of the individual endocrine cell types. In general it was found that where the islet was mixed, both the α- and the β-cell populations were mixed (Fig. 4). In all mosaic females of all ages, pancreatic ducts were consistently seen to be of a heterogeneous β-gal+/β-gal− cell composition, and the acini, as mentioned above, could not be scored because of loss of β-gal expression.
Fig. 4.
Cell composition of α- and β-cell populations. Islets from H253 female hemizygotes are double-labelled for β-gal (fluorescein) and the appropriate hormone (TRITC/Texas Red). Insulin+β-cell populations and glucagon+α-cell populations are both of heterogeneous β-gal+/β-gal− cell composition. (A) Glucagon. (B) Insulin. Scale bar = 50 µm.
Given random X-inactivation, islets in the mosaic females should be composed of β-gal+ and β-gal− cells in approximately equal numbers. However, this was not the case. Of the 37 islets examined, 27 were predominantly composed of β-gal+ cells, and 10 were composed mainly of unlabelled cells. This represents a significant (χ2, P < 0.01) bias towards β-gal-labelled islets. This effect was also apparent to about the same extent in the larger Series 1. One possible explanation for this would be that β-gal expression is not entirely neutral with respect to cell survival, as it is known that cellular selection can lead to unequal numbers of cells expressing the two X-chromosomes (McMahon & Monk, 1983). However, previous studies with H253 mice have shown a balanced mosaicism (e.g. Tan et al. 1995; Nomura et al. 1998), and β-galactosidase expression in mice has generally been considered neutral (Beddington et al. 1989). Another possibility is that the CBA-derived X-chromosome, which will be present in some hemizygous females, has a higher propensity for inactivation owing to its Xce a allele, compared with the Xce b allele of the H253 strain (Johnston & Cattanach, 1981; Plenge et al. 2000). However, the early time points of Series 1 showed a close to 50% proportion of β-gal-positive cells, suggesting that this is not a significant factor. Even if the X-inactivation were not exactly balanced, this would not affect the logic of the present work, which simply requires that there is a heritable mosaicism of β-gal expression in the female hemizygous mice.
The overall conclusion is that islets are initially of mixed composition and hence must be formed by aggregation of several cells. However, over the first few weeks of postnatal development, the heterogeneity of the islets diminishes. Eventually at least some islets become homogeneous, the proportion being somewhat variable between animals. This suggests that, with time, islets progress towards monoclonality, and that some actually become monoclonal. This is likely to occur if there is extensive cell turnover, such that a late islet contains descendents of only a few of the cells that were present at an earlier stage.
Dumb-bell islets
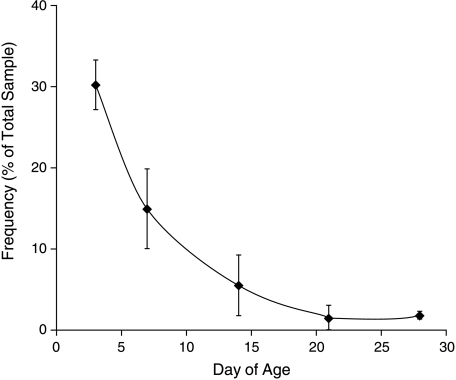
Analysis of the sections from both sexes and all genotypes of H253 mice revealed the presence of irregularly shaped islets (Fig. 5). Such ‘dumb-bell’ islets appeared to be composed of two or, rarely, more conjoined ovoid parts, each of which was similar to a more typical islet. The point of contact of the parts was marked by a ‘neck’ of glucagon-positive cells delineating the two bodies of β-cells on either side. The incidence of dumb-bell islets from PN3 to PN12 weeks was found to decline quite sharply (Fig. 6), although a small proportion of islets (< 5%) even in adults, consistently demonstrated the dumb-bell appearance after PN21.
Fig. 5.
‘Dumbbell’ islets in histological sections. (A,B) Paraffin sections of X-gal-stained mosaic female pancreas immunoperoxidase-stained for glucagon. (C) Frozen section of mosaic female pancreas immunofluorescence-stained for β-gal (fluorescein) and glucagon (Texas Red). Note neck of glucagon+ cells (arrows). Scale bar = 100 µm.
Fig. 6.
Frequency of dumb-bell islets with age. Data from Series 1; bars indicate standard errors.
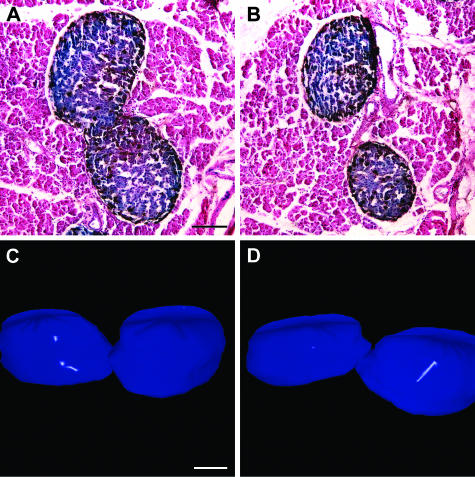
A 3D reconstruction of a typical dumb-bell islet was generated by conducting a computer-driven analysis of images of serial glucagon-stained 2D histological sections. A z-stack of serial images of these slices was obtained (Fig. 7A,B) and, using multiple computer programs, was used to generate the reconstruction (Fig. 7C,D). This islet can be seen to be elongated along one axis in comparison with more characteristic spheroidal islets. The dumb-bell resembles two ovoid islets in apposition at its neck, the narrowing of which also occurs in the third dimension. Because of its morphology, we reasoned that such an islet is either undergoing fission to yield ‘daughter’ islets, or represents two smaller islets fusing to form a single large islet. The existence of the glucagon-positive cells in the neck region is consistent with either fission or fusion, as we should expect the cell types to rearrange accordingly as the fission process proceeds.
Fig. 7.
Histological appearance and 3D reconstruction of a typical dumb-bell islet. (A,B) Same dumb-bell islet in representative paraffin sections. (C,D) Computer-aided 3D reconstruction of the pictured dumb-bell islet in two aspects, separated by a 180° rotation. Scale bar = 100 µm.
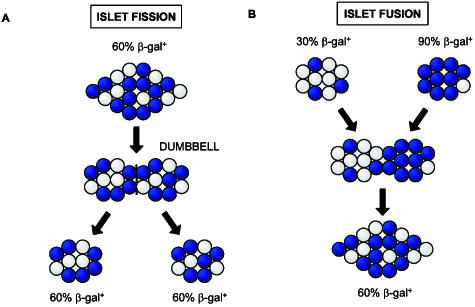
To distinguish these possibilities we analysed islet β-gal+ and β-gal− cell composition in a set of pancreata from the Series 1 mosaic females (PN3, n = 2; PN7, n = 2; PN14, n = 1; PN21, n = 1; PN28, n = 1 and PN12 weeks, n = 1). The rationale is that in any given mosaic female, there will be some variability in the cell composition of the islets. If the two sides of a dumb-bell are very similar in composition then this suggests fission of one large islet, whereas if the two sides are as different as random islet pairs, it suggests the amalgamation of two islets (Fig. 8).
Fig. 8.
Predictions about the cellular composition of dumb-bell islets depending on whether they arise by islet fission (A) or fusion (B).
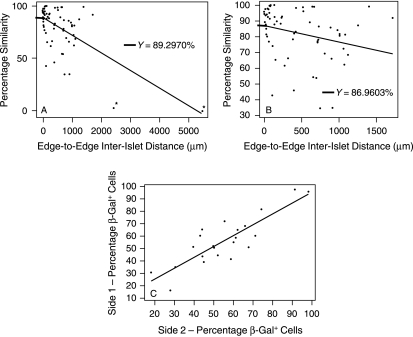
A linear regression plot of similarity of cell composition between 65 non-dumb-bell islet pairs against edge-to-edge distance between them (Fig. 9A) revealed a significant negative correlation (calculated rs = −0.441; (rs)0.05(2), 65 = 0.244). An alternative regression plot excluding two extreme outlying data points (Fig. 9B) showed a slightly weaker although still significant negative correlation (calculated rs = −0.387; (rs)0.05(2), 63 = 0.248). In other words, the further apart islets lie, the more discordant their cell composition.
Fig. 9.
Analysis of cell composition of dumb-bell and non-dumb-bell islets. (A,B) Relationship between percentage β-gal+ cells and edge-to-edge distance in random pairs of non-dumb-bell islets. (A) Including outliers (asterisks) (n = 65 pairs). (B) Outliers excluded (n = 63 pairs). (C) Relationship between percentages of β-gal+ cells on the two sides of each of 23 dumb-bell islets.
To analyse the dumb-bells, each of the two sides of 23 dumb-bell-shaped islets was arbitrarily labelled side 1 or side 2. Then a linear regression of percentage β-gal+ cell composition of side 1 against percentage β-gal+ cell composition of side 2 yielded a significant positive correlation (Fig. 9C); the Spearman rank correlation coefficient rs was 0.742; [(rs)0.05(2), 23 = 0.415]. This shows that the two sides of a dumb-bell are far more similar to each other than are pairs of randomly selected islets. The overall percentage similarity of the two sides of dumb-bells averaged 91.8%. This is very close to the y-intercept values for the islet pairs: 89.3% (whole data set) and 87.0% (data set excluding outliers), which represent the percentage similarity of cell composition between islets whose edges are touching. In other words, dumb-bell islets have sides of similar compositional similarity to touching islets, and as islets get further apart, the compositional discordance increases. This can only be the case if the dumb-bells represent dividing islets, and if the products of islet division progressively move apart from one another.
Further support for this idea comes from the fact that islets of a certain cell composition tended to occur together. Discrete groups of homogeneous β-gal+ islets and heterogeneous β-gal+/β-gal− islets were seen within the same tissue section, and patches of homogeneous unlabelled islets were also observed.
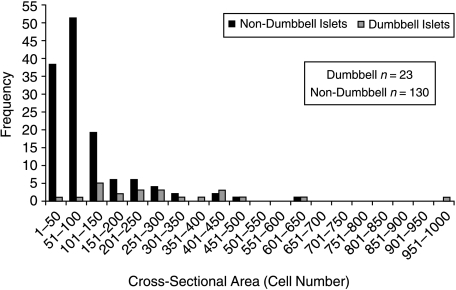
It would be expected that if dumb-bells are fissioning islets, they would be larger than non-dumb-bell islets. This hypothesis was tested by comparing the cell number of the 23 dumb-bell and 130 (i.e. 65 pairs of) non-dumb-bell islets (Fig. 10). The data ranges for the two islet classes overlaps to quite some extent. However, minimum and maximum dumb-bell islet areas were 5.2- and 2.9-fold greater than those for non-dumb-bells and mean dumb-bell islet area at 295 ± 43.6 cells was significantly greater (P < 0.05) than mean non-dumb-bell islet area (102 ± 8.76 cells).
Fig. 10.
Frequency histogram of cell numbers in sections of dumb-bell and non-dumb-bell islets.
Finally, we examined whether the dumb-bells, if indeed fissioning islets, divide symmetrically. A linear regression plot of area (total number of cells) of side 1 against the area of side 2 for the 23 dumb-bell islets revealed a significant positive correlation (rs = 0.736; (rs)0.05(2), 23 = 0.415; data not shown). So although there are some asymmetrical examples, they are generally more or less symmetrical.
Discussion
Technical aspects of the work
H253 mice have not previously been used for the analysis of the pancreas. The present work shows that the ubiquitous expression of β-gal found in embryos is not necessarily maintained into postnatal stages and in the pancreas there is a rapid loss of expression in the acini. This may be due to the high cholesterol content of acinar cells repressing transcription from the HMG CoA reductase promoter (Goldstein & Brown, 1990). The simvastatin series showed some retention of acinar expression, but not reliable enough to enable a proper cell composition analysis. By contrast, expression in the ducts and islets in the positive control animals is uniform for many months. A few individual mice of the first series seemed to be losing uniform β-gal expression at times after 18 weeks, but before this the label is stable enough for reliable composition analysis.
The X-gal staining data from the first and third series of animals was considered suitable for the analysis of this study for two reasons:
β-gal expression was ubiquitous in the islets of positive control transgenic males and homozygous females in these series of animals, and
there is confidence that the X-gal stain reveals all the β-gal+ cells.
By contrast, the immunostain of β-gal in Series 2 and 3 only seemed to show about 80% of the positive cells.
In both Series 1 and 3, homogeneous islets were more frequently composed of β-gal+ cells than unlabelled cells, although there were some uniformly unlabelled islets present. As discussed above, the reasons for this are not entirely clear, although it does not affect the conclusions of the study, which simply require that the β-gal status is heritable for the time period and cell types examined.
Cell composition analysis
In the mosaic females some homogeneous islets were seen after the first few postnatal weeks, whereas at PN3 virtually all islets were of mixed composition, displaying a fine-grained mosaicism of intermingled labelled and unlabelled cells. This ‘salt and pepper’ appearance is consistent with previous reports showing that islets form in the perinatal period by aggregation of pre-existing endocrine cells (Deltour et al. 1991; Dahl et al. 1996; Percival & Slack, 1999).
In Series 1 mosaic females, the majority of islets became homogeneous after 4 weeks, whereas in Series 3 it was a minority of islets over the same period. The index of homogeneity, which measures deviation from 50 : 50 mixing, also showed an increase during the postnatal weeks. In Series 1 this reached 98% and in Series 3 it reached 76% at 4 weeks.
In a previous cell composition analysis, Deltour et al. (1991) constructed mouse aggregation chimaeras in which one component was a transgenic embryo containing the human proinsulin gene. The human insulin is expressed only in β-cells and could be detected immunohistochemically by using an antibody to the human C-peptide. In two of four animals examined at 1.5 months or 4.5 months of age, virtually all islets were demonstrated to contain cells from both aggregated embryos. In the other two, which had low levels of chimaerism, all islets were homogeneous.
The most obvious explanation for a homogeneous islet is that it is monoclonal, i.e. that all cells are derived from a single progenitor. That mixed islets are polyclonal is self-evident, but it is probable that a proportion of the homogeneous islets are actually oligoclonal. For example, if adult islets are renewed by two progenitor or stem cells, then the likelihood of that islet appearing as homogeneous is 0.5 – the probability that both stem cells are of the same genotype – either β-gal+ and β-gal+ or β-gal− and β-gal−. As the number of stem cells supplying the islet increases, then the probability that they are all of the same genotype declines exponentially. It cannot therefore be stated that a given homogeneous islet is monoclonal but it can be inferred that the observed homogenization represents a shift towards monoclonality.
Such a conversion from a neonatal polyclonal state to one of homogeneity has been well documented in the crypts of the mouse small intestine (Schmidt et al. 1988). Studies with mouse aggregation chimaeras have revealed that although polyclonal crypts are observed in neonatal mice, they disappear over the first 2 weeks to give way to the homogeneous units of the adult (Ponder et al. 1985; Schmidt et al. 1988). More recently, lineage analysis on H253 mosaic females has been used to demonstrate a similar homogenization in the stomach gastric glands (Nomura et al. 1998). Polyclonal neonatal glands are predominantly polyclonal but from PN6 weeks the majority become homogeneous (Canfield et al. 1996; Nomura et al. 1998). Genetic homogeneity is the clearest evidence for the existence of self-contained SPUs in a tissue.
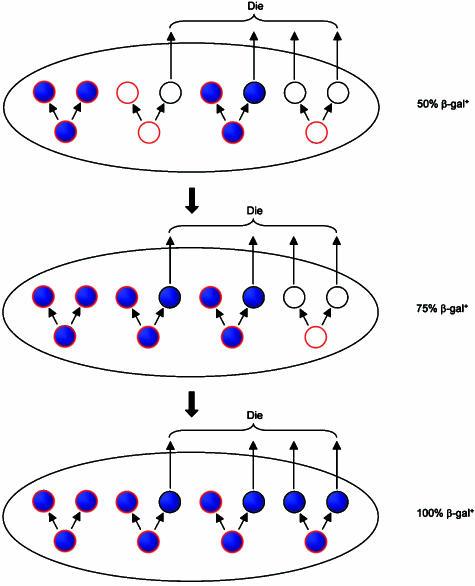
Any mechanism to bring about homogeneity will necessarily involve the overgrowth of one cell lineage and the loss of others, so the progeny of one cell eventually displace their competitors. The most likely explanation arises from situations in which the SPU contains just a few stem cells (Potten & Loeffler, 1990; Loeffler et al. 1993). Suppose that in each division round the stem cells produce an equal number of replacement stem cells, but that individual stem cells may, at random, produce two new stem cells, two cells committed to differentiate or one of each. Whenever a stem cell happens to produce two progeny committed to differentiate then this cell lineage will be lost from the stem cell pool. It will eventually disappear entirely from the SPU because of cell death. Once the whole SPU is fed from stem cells of a single genotype it will be homogeneous. The probability of it also being monoclonal increases for smaller numbers of stem cells. This process is shown diagrammatically in Fig. 11. In the case of pancreatic islets, a small number of stem cells might exist within the islet itself, or outside it, perhaps in an associated ductule.
Fig. 11.
Simple model for the genetic homogenization of an SPU in a mosaic animal. The unit consists of just eight cells, four stem cells (highlighted in red) and four differentiated cells (not highlighted). At each time point, the differentiated cells die and are replaced by stem cell division producing another four differentiated cells. As it is a matter of chance whether a given stem cell will produce another stem cell, the whole SPU becomes homogeneous after two cycles. It is not, however, monoclonal, as two of the original clones are still present.
Even if there is no specific population of stem cells associated with each islet, it is feasible for the progeny of a single cell to populate an islet within a 4-week period. One cell would need to undergo only 10 divisions to populate a 1000-cell islet with its progeny (210 = 1024) provided that all daughter cells are retained. Turnover of the endocrine compartment in the neonatal period is certainly high enough to support a simple model of islet cell overgrowth by one lineage. By combining data from previous studies (Swenne & Eriksson, 1982; Kaung, 1994; Montana et al. 1994), Finegood et al. (1995) estimated that in the rat pancreas approximately 20% of β cells at PN1 divide each day. Although β cell replication rate declines progressively in the weeks following birth, it does not stabilize at the adult rate of 3% new β cells per day until approximately PN40 (Finegood et al. 1995). Given even the adult level of β-cell replication, β-cell mass would double in 1 month if there were negligible cell death or apoptosis (Hellerström et al. 1988). Alternatively, if the rate of β-cell death matches the replication rate, then complete replacement of the β-cell population could occur in that 1-month period.
Cell death is also substantial. Using their model, Finegood et al. (1995) predicted a neonatal wave of β-cell death in the developing rat pancreas peaking at 9% of β-cells day−1 at PN12. This wave of islet cell death has subsequently been observed by direct histochemical detection of apoptotic cells. Using either propidium iodide or terminal deoxynucleotidyl transferase-mediated biotin dUTP nick-end labelling (TUNEL) to identify apoptotic cells, islet cell apoptosis has been shown to peak at PN13–14 in the neonatal rat pancreas (Scaglia et al. 1997; Petrik et al. 1998). More recently, TUNEL staining was used to demonstrate a neonatal wave of islet cell apoptosis commencing at PN5 and peaking at PN12 (9.4% apoptosis day−1) in BALB/c mice (Trudeau et al. 2000). Therefore, the peak of neonatal islet apoptosis coincides with the period within which we see the islets becoming more homogeneous in cell composition.
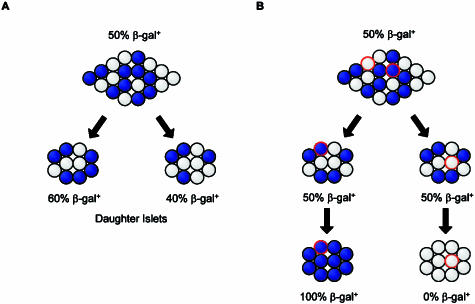
Another possible mechanism for homogenization is the fission of SPUs. In the intestine, crypt fission is a significant mechanism of crypt multiplication in which a crypt splits from the base upwards (St. Clair & Osborne, 1985; Li et al. 1994). Active crypt fission during the first 2 weeks of postnatal life not only results in a rapid expansion of crypt number (Cheng & Bjerknes, 1985) but also corresponds with the period over which clonal purification occurs. Gastric glands have similarly been reported to undergo fission by splitting across the longitudinal extent of the parental gland (Nomura et al. 1998). Fission of an SPU will partition the stem cells at random between the daughter SPUs, reducing the number of cell lineages within each of them. This represents an independent way of reducing the clonal complexity. In the case of pancreatic islets we do not know whether they contain stem cells or not. If not, the data presented above, showing that the cell composition of the two sides of a dumb-bell differs by about 10%, suggests that it would take a very long time for random partitioning of cells to the daughter islets to ‘drift’ to homogeneity (Fig. 12). But if there is a small subset of stem cells within the islets that are responsible for all of the long-term cell production, then the process could be quite fast. Alternatively, the true SPU might contain both the islet and a small adjacent region containing the stem cells, which might be unlabelled with β-gal in our experiments until they become differentiated.
Fig. 12.
Effect of fission of an SPU on the cell composition. (A) Sampling error will create small differences between the cell composition of daughter units. This will eventually lead to homogenization but with a very long time-course. (B) However, if there are just a few stem cells (highlighted in red) that are eventually responsible for populating the whole SPU, then fission can be a powerful process driving homogenization.
‘Dumb-bell’ islets
As islet fission is one potential explanation for the observed homogenization of islets, we were interested in whether the observed ‘dumb-bell’-shaped islets are indeed in a state of fission, analogous to that described in the intestinal crypts (St. Clair & Osborne, 1985; Li et al. 1994). The results show that the relatedness of the two sides of a dumb-bell islet is significantly higher than between random pairs of non-dumb-bell islets. Moreover, there is a significant negative correlation between similarity in cell composition and interislet distance. So the relatedness of two randomly selected islets decreases as the distance between them increases. Furthermore, dumb-bells are generally symmetrical, as far as can be assessed from measurement of sections approximately parallel to the long axis. All of these results strongly support the argument for islet fission, supporting both hypotheses: (1) dumb-bell islets represent a parent islet in a state of fission and (2) such islet fission is a mode of islet production in the mouse pancreas.
Studies examining crypt fission have found that crypts at the upper end of the size distribution tend to initiate fission, suggesting that crypts must attain a given size before fission commences. It has been proposed (Loeffler et al. 1993, 1997) that the threshold for initiation of fission is a doubling of the stem cell number. A further proposal is that there exists a given threshold value for the number of stem cells per crypt that, when reached, triggers fission. If islet fission is initiated when an islet attains a threshold size then one would expect a bivariate distribution of islet size. An analysis of islet sectional area revealed a considerable overlap in the ranges of islet area for the dumb-bell and non-dumb-bell islet population samples, meaning that no clear size/area threshold for triggering fission could be discerned. However, dumb-bell islets were significantly larger than non-dumb-bell islets, the mean dumb-bell islet area (295 ± 43.6 cells) being almost three-fold greater than the non-dumb-bell islet area (102 ± 8.76 cells).
Role of islet fission in the normal and regenerating pancreas
It is now known that the β-cell mass continues to grow well into adulthood. Morphometric data from wild-type mice aged from 4 weeks to 6 months and of the same mixed background (C57Bl/6J/129J) (Bruning et al. 1997; Withers et al. 1998; Kopin et al. 1999; Westphal et al. 1999) show that β-cell mass increases at least 10-fold over this period and is linearly correlated with body weight. These new β-cells are derived either through the replication of pre-existing β-cells (Hellerström et al. 1988) or via neogenesis, the budding of endocrine cells from the ductal epithelium (Bonner-Weir, 2001). It follows that the rapid neonatal increase in β-cell mass must be accompanied by a large increase in islet number after birth (Nielsen et al. 2001). The increase in total β-cell mass is associated with an increase in the number of islets. According to Hughes (1956), the number of islets increases from 664 in the neonatal rat to 4673 in the adult. It is likely that islet fission plays an important role in expanding the number of islets in the immediate neonatal period. Redistribution of endocrine tissue in this way may optimize the association of islets with blood vessels, ensuring that islets retain optimal access to blood supply.
Acknowledgments
We thank Dr S.Tan for permission to use the H253 mice and Dr Richard Adams for his involvement in the computer-generated 3D islet reconstruction. We also thank members of our laboratory and the laboratory of Dr David Tosh for helpful discussion and staff at the animal house for maintaining the animals. This work was supported by a Medical Research Council quota studentship to P.A.S. and by the grants held by the MRC Cooperative Group on Organogenesis.
References
- Beddington RSP, Morgernstern J, Land H, Hogan A. An in situ transgenic enzyme marker for the midgestation mouse embryo and the visualization of inner cell mass clones during early organogenesis. Development. 1989;106:37–46. doi: 10.1242/dev.106.1.37. [DOI] [PubMed] [Google Scholar]
- Bonner-Weir S. Beta-cell turnover – its assessment and implications. Diabetes. 2001;50:S20–S24. doi: 10.2337/diabetes.50.2007.s20. [DOI] [PubMed] [Google Scholar]
- Bruning JC, Winnay J, Bonner-Weir S, Taylor SI, Accili D, Kahn CR. Development of a novel polygenic model of NIDDM in mice heterozygous for IR and IRS-1 null alleles. Cell. 1997;88:561–572. doi: 10.1016/s0092-8674(00)81896-6. [DOI] [PubMed] [Google Scholar]
- Canfield V, West AB, Goldenring JR, Levenson R. Genetic ablation of parietal cells in transgenic mice: a new model for analyzing cell lineage relationships in the gastric mucosa. Proc. Natl Acad. Sci. USA. 1996;93:2431–2435. doi: 10.1073/pnas.93.6.2431. [DOI] [PMC free article] [PubMed] [Google Scholar]
- Cheng H, Bjerknes M. Whole population cell kinetics and postnatal development of the mouse intestinal epithelium. Anat. Rec. 1985;211:420–426. doi: 10.1002/ar.1092110408. [DOI] [PubMed] [Google Scholar]
- Dahl U, Sjödin A, Semb H. Cadherins regulate aggregation of pancreatic β-cells in vivo. Development. 1996;122:2895–2902. doi: 10.1242/dev.122.9.2895. [DOI] [PubMed] [Google Scholar]
- Deltour L, Leduque P, Paldi A, Ripoche MA, Dubois P, Jami J. Polyclonal origin of pancreatic islets in aggregation mouse chimaeras. Development. 1991;112:1115–1121. doi: 10.1242/dev.112.4.1115. [DOI] [PubMed] [Google Scholar]
- Finegood DT, Scaglia L, Bonner-Weir S. Dynamics of β-cell mass in the growing rat pancreas: estimation with a simple mathematical model. Diabetes. 1995;44:249–256. doi: 10.2337/diab.44.3.249. [DOI] [PubMed] [Google Scholar]
- Goldstein JL, Brown MS. Regulation of the mevalonate pathway. Nature. 1990;343:425–430. doi: 10.1038/343425a0. [DOI] [PubMed] [Google Scholar]
- Gu G, Dubauskaite J, Melton DA. Direct evidence for the pancreatic lineage: NGN3+ cells are islet progenitors and are distinct from gut progenitors. Development. 2002;129:2447–2457. doi: 10.1242/dev.129.10.2447. [DOI] [PubMed] [Google Scholar]
- Hellerström C, Swenne I, Andersson A. Islet cell replication and diabetes. In: Lefebvre PJ, Pipeleers DG, editors. The Pathology of the Endocrine Pancreas in Diabetes. Heidelberg, Germany: Springer-Verlag; 1988. pp. 141–170. [Google Scholar]
- Herrera PL, Huarte J, Sanvito F, Meda P, Orci L, Vassalli JD. Embryogenesis of the murine endocrine pancreas; early expression of pancreatic polypeptide gene. Development. 1991;113:1257–1265. doi: 10.1242/dev.113.4.1257. [DOI] [PubMed] [Google Scholar]
- Hughes H. An experimental study of regeneration in the islets of Langerhans with reference to the theory of balance. Acta Anat. 1956;27:1–61. doi: 10.1159/000141111. [DOI] [PubMed] [Google Scholar]
- Johnston PG, Cattanach BM. Controlling elements in the mouse. IV Evidence of non-random X-inactivation. Genet. Res. 1981;37:151–160. doi: 10.1017/s0016672300020127. [DOI] [PubMed] [Google Scholar]
- Kaung H-LC. Growth dynamics of pancreatic islet cell populations during fetal and neonatal development of the rat. Dev. Dyn. 1994;200:163–175. doi: 10.1002/aja.1002000208. [DOI] [PubMed] [Google Scholar]
- Kopin AS, Mathes WF, Nguyen M, Kethir W, Schmitz F, Bonner-Weir S, et al. The cholecystokinin-A receptor mediates inhibition of food intake yet is not essential for the maintenance of body weight. J. Clin. Invest. 1999;103:383–391. doi: 10.1172/JCI4901. [DOI] [PMC free article] [PubMed] [Google Scholar]
- Li YQ, Roberts SA, Paulus U, Loeffler M, Potten CS. The crypt cycle in mouse small intestinal epithelium. J. Cell Sci. 1994;107:3271–3279. doi: 10.1242/jcs.107.12.3271. [DOI] [PubMed] [Google Scholar]
- Loeffler M, Birke A, Winton DJ, Potten CS. Somatic mutation, monoclonality and stochastic models of stem cell organisation in the intestinal crypt. J. Theor. Biol. 1993;160:471–491. doi: 10.1006/jtbi.1993.1031. [DOI] [PubMed] [Google Scholar]
- Loeffler M, Bratke T, Paulus U, Li YQ, Potten CS. Clonality and life cycles of intestinal crypts explained by a state-dependent stochastic model of epithelial stem cell organisation. J. Theor. Biol. 1997;186:41–54. doi: 10.1006/jtbi.1996.0340. [DOI] [PubMed] [Google Scholar]
- Lyon MF. Gene action in the X-chromosome of the mouse (Mus musculus L.) Nature. 1961;190:372–373. doi: 10.1038/190372a0. [DOI] [PubMed] [Google Scholar]
- McMahon A, Monk M. X-chromosome activity in female mouse embryos heterozygous for Pgk-1 and Searle's translocation, T (X; 16), 16H. Genet. Res. 1983;41:69–83. doi: 10.1017/s0016672300021078. [DOI] [PubMed] [Google Scholar]
- Montana E, Bonner-Weir S, Weir GC. Transplanted beta cell response to increased metabolic demand. J. Clin. Invest. 1994;93:1577–1582. doi: 10.1172/JCI117137. [DOI] [PMC free article] [PubMed] [Google Scholar]
- Nielsen JH, Galsgaard ED, Møldrup A, Friedrichsen BN, Billestrup N, Hansen JA, et al. Regulation of β-cell mass by hormones and growth factors. Diabetes. 2001;50(Suppl. 1):S25–S29. doi: 10.2337/diabetes.50.2007.s25. [DOI] [PubMed] [Google Scholar]
- Nomura S, Esumi H, Job C, Tan S-S. Lineage and clonal development of gastric glands. Dev. Biol. 1998;204:124–135. doi: 10.1006/dbio.1998.9055. [DOI] [PubMed] [Google Scholar]
- Percival AC, Slack JMW. Analysis of pancreatic development using a cell lineage label. Exp. Cell Res. 1999;247:123–132. doi: 10.1006/excr.1998.4322. [DOI] [PubMed] [Google Scholar]
- Petrik J, Arany E, McDonald TJ, Hill DJ. Apoptosis in the pancreatic islet cells of the neonatal rat is associated with a reduced expression of insulin-like growth factor II that may act as a survival factor. Endocrinology. 1998;139:2994–3004. doi: 10.1210/endo.139.6.6042. [DOI] [PubMed] [Google Scholar]
- Pictet R, Rutter WJ. Development of the embryonic endocrine pancreas. In: Steiner DF, Frenkel N, editors. Handbook of Physiology. Washington DC: Williams & Wilkins; 1972. pp. 25–66. [Google Scholar]
- Plenge RM, Percec I, Nadeau JH, Willard HF. Expression-based assay of an X-linked gene to examine effects of the X-controlling element (Xce) locus. Mammalian Genome. 2000;11:405–408. doi: 10.1007/s003350010077. [DOI] [PubMed] [Google Scholar]
- Ponder BAJ, Schmidt GH, Wilkinson MM, Wood J, Monk M, Reid A. Derivation of mouse intestinal crypts from a single progenitor cell. Nature. 1985;313:689–691. doi: 10.1038/313689a0. [DOI] [PubMed] [Google Scholar]
- Potten CS. Epithelial proliferative subpopulations. In: Lord BI, Potten CS, Cole RJ, editors. Stem Cells and Tissue Homeostasis. Cambridge: Cambridge University Press; 1978. pp. 317–334. [Google Scholar]
- Potten CS. Stem cells in gastrointestinal epithelium: numbers, characteristics and death. Phil. Trans. R. Soc. Lond. B Biol. Sci. 1998;353:821–830. doi: 10.1098/rstb.1998.0246. [DOI] [PMC free article] [PubMed] [Google Scholar]
- Potten CS, Loeffler M. Stem cells: attributes, cycles, spirals, pitfalls and uncertainties. Lessons for and from the crypt. Development. 1990;110:1001–1020. doi: 10.1242/dev.110.4.1001. [DOI] [PubMed] [Google Scholar]
- Scaglia L, Cahill CJ, Finegood DT, Bonner-Weir S. Apoptosis participates in the remodeling of the endocrine pancreas in the neonatal rat. Endocrinology. 1997;138:1736–1741. doi: 10.1210/endo.138.4.5069. [DOI] [PubMed] [Google Scholar]
- Schmidt G, Winton DJ, Ponder BAJ. Development of the pattern of cell renewal in the crypt-villus unit of the chimaeric mouse small intestine. Development. 1988;103:785–790. doi: 10.1242/dev.103.4.785. [DOI] [PubMed] [Google Scholar]
- Slack JMW. Developmental biology of the pancreas. Development. 1995;121:1569–1580. doi: 10.1242/dev.121.6.1569. [DOI] [PubMed] [Google Scholar]
- St. Clair WH, Osborne JW. Crypt fission and crypt number in the small and large bowel of adult rats. Cell Tissue Kinet. 1985;14:467–477. doi: 10.1111/j.1365-2184.1985.tb00655.x. [DOI] [PubMed] [Google Scholar]
- Stone LM, Tan S-S, Tam PPL, Finger TE. Analysis of cell lineage relationships in taste buds. J. Neurosci. 2002;22:4522–4529. doi: 10.1523/JNEUROSCI.22-11-04522.2002. [DOI] [PMC free article] [PubMed] [Google Scholar]
- Swenne I, Eriksson U. Diabetes in pregnancy: islet cell proliferation in the fetal rat pancreas. Diabetologia. 1982;23:525–528. doi: 10.1007/BF00254304. [DOI] [PubMed] [Google Scholar]
- Tam PPL, Tan S-S. The somitogenic potential of cells in the primitive streak and the tail bud of the organogenesis-stage mouse embryo. Development. 1992;115:703–715. doi: 10.1242/dev.115.3.703. [DOI] [PubMed] [Google Scholar]
- Tan S-S, Williams EA, Tam PPL. X-chromosome inactivation occurs at different times in different tissues of the post-implantation mouse embryo. Nat. Genet. 1993;3:170–174. doi: 10.1038/ng0293-170. [DOI] [PubMed] [Google Scholar]
- Tan S-S, Faulkner-Jones B, Breen SJ, Walsh M, Bertram JF, Reese BE. Cell dispersion patterns in different cortical regions studied with an X-inactivated transgenic marker. Development. 1995;121:1029–1039. doi: 10.1242/dev.121.4.1029. [DOI] [PubMed] [Google Scholar]
- Trudeau JD, Dutz JP, Arany E, Hill DJ, Fieldus WE, Finegood DT. Neonatal β-cell apoptosis: a trigger for autoimmune diabetes? Diabetes. 2000;49:1–7. doi: 10.2337/diabetes.49.1.1. [DOI] [PubMed] [Google Scholar]
- Westphal CH, Muller L, Zhou A, Zhu X, Bonner-Weir S, Schambelan M, et al. The neuroendocrine protein 7B2 is required for peptide hormone processing in vivo and provides a novel mechanism for pituitary Cushing's disease. Cell. 1999;96:689–700. doi: 10.1016/s0092-8674(00)80579-6. [DOI] [PubMed] [Google Scholar]
- Withers DJ, Gutierrez JS, Towery H, Burks DJ, Ren J-M, Previs S, et al. Disruption of IRS-2 causes type 2 diabetes in mice. Nature. 1998;391:900–904. doi: 10.1038/36116. [DOI] [PubMed] [Google Scholar]


