Abstract
de Margerie hypothesized that preferred orientations of primary vascular canals in avian primary cortical bone mediate important mechanical adaptations. Specifically, bones that receive habitual compression, tension or bending stresses typically have cortices with a low laminarity index (LI) (i.e. relatively lower cross-sectional areas of circularly (C) orientated primary vascular canals, and relatively higher areas of canals with radial (R), oblique (O) or longitudinal (L) orientations. By contrast, bones subject to habitual torsion have a high LI (i.e. relatively higher C-orientated canal area) [LI, based on percentage vascular canal area, = C/(C + R + O + L)]. Regional variations in predominant collagen fibre orientation (CFO) may be the adaptive characteristic mediated by LI. Using turkey ulnae, we tested the hypothesis that site-specific variations in predominant CFO and LI are strongly correlated. Mid-diaphyseal cross-sections (100 ± 5 µm) from subadult and adult bones were evaluated for CFO and LI using circularly polarized light images of cortical octants. Results showing significant differences between mean LI of subadult (40.0% ± 10.7%) and adult (50.9% ± 10.4%) (P < 0.01) bones suggest that adult bones experience more prevalent/predominant torsion. Alternatively, this relationship may reflect differences in growth rates. High positive correlations between LI and predominant CFO (subadults: r = 0.735; adults: r = 0.866; P < 0.001) suggest that primary bone can exhibit potentially adaptive material variations that are independent of secondary osteon formation.
Keywords: bone adaptation, bone vascularity, cortical bone, laminar bone, osteons
Introduction
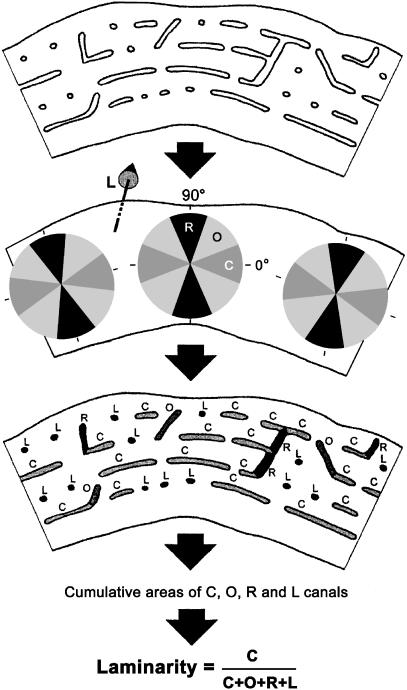
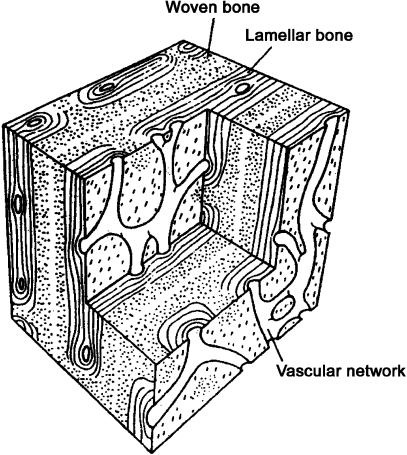
de Margerie (2002) hypothesized that preferred orientations of primary vascular canals in avian primary cortical bone correlate with important mechanical adaptations. Examining this idea in limb bones of adult mallards (which contain predominantly primary bone), de Margerie showed that bones receiving habitual bending have cortices with higher relative percentage areas represented by primary vascular canals with radial, oblique or longitudinal orientations. These bones included the radius, tibiotarsus, tarsometatarsus and phalanx 2 of foot digit III. By contrast, bones presumably loaded habitually in more prevalent torsion (humerus, ulna, carpometacarpus and femur) had relatively higher ‘laminarity’ (i.e. relatively higher percentage areas represented by circularly orientated vascular canals) (see Fig. 1 for a definition of laminarity index (LI) and Fig. 2 for an illustration of laminar bone). This is an important hypothesis because it suggests that regional patterns in primary vascular canals may causally mediate mechanically adaptive regional microstructural/ultrastructural variations in primary bone.
Fig. 1.
Measurement of vascular orientation and area. Laminarity index (LI) was defined as the ratio of the area of the circular canals to total vascular area. C, circular vascular orientation; O, oblique vascular orientation; R, radial vascular orientation; L, longitudinal vascular orientation. In accordance with the methods of de Margerie (2002), a primary vascular canal was required to exhibit a length/width ratio of 3 : 1 or greater in order to be considered ‘lying in the plane of the section’; otherwise, it was considered a longitudinal (L) canal. It should be noted that in this diagram the circular canals are relatively shorter than those observed in areas of the turkey ulna that have predominant ‘laminar vascularization’ patterns. See text for further details and discussion. (Adapted from de Margerie (2002) with permission of Blackwell Publishing.)
Fig. 2.
Block diagram of the general histological type of primary bone known as ‘laminar’, ‘plexiform’ or ‘fibrolamellar’ (Currey, 2002). This diagram shows representative primary vascular canal types. The distance between the vascular networks is 100–200 µm in bones from different species. It should be noted that the more obvious circularly orientated canals of highly orientated laminar tissue (i.e. ‘laminar vascularization’ patterns) are not depicted in this diagram. See Fig. 1 and text for further discussion of the distinctive vascular patterns that can be found in ‘laminar’ bone. (Adapted from Zioupos & Currey (1994, p. 983) with permission of Kluwer Academic Publishing.)
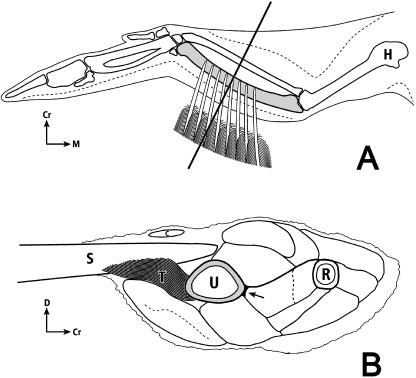
de Margerie (2002) also suggested that regional variations in predominant collagen fibre orientation (CFO) may be the adaptive characteristic causally mediated by the degree of laminarity. However, a theoretical basis for this relationship was not suggested. Recently, we have reported quantitative data dealing with the structural and material organization of subadult and adult domesticated turkey ulnae at mid-diaphysis (Skedros et al. 2003b). Similar to what is observed in mallards, the ulnae of adult turkeys contain relatively few secondary osteons; secondary osteons are rare or absent in subadult bones. In cortical octants of transversely sectioned bones, we reported site-specific variations in predominant CFO, porosity (primary and secondary osteon canals), mineral content (percentage ash) and population densities of osteocyte lacunae. Significant regional variations in CFO and/or the other microstructural characteristics were found between ‘tension’, ‘compression’ and ‘shear’ (neutral axis) regions of subadult bones. Strain-mode-specific (strain mode = tension, compression, shear) variations in CFO patterns were less evident in adult bones. However, qualitative observations suggested that subadult and adult bones appeared to have lower LI in neutral axis regions (i.e. cranial and caudal cortices). Additionally, subadult bones generally appeared to have lower LI compared with adult bones. We attributed these observed differences to the possibility that: (1) neutral axis regions, in addition to receiving more prevalent/predominant shear strains, have additional metabolic and/or biomechanical demands associated with feather ‘tethers’ (caudal cortex) and muscle insertions (cranial cortex) (Fig. 3); and (2) subadult bones generally receive more prevalent/predominant compression and/or bending loads compared with relatively more prevalent/predominant torsional loading in adult bones.
Fig. 3.
Dorsal-to-ventral view (A) and cross-section view (B) of left avian wing: H, humerus; U, ulna (shaded); R, radius; Cr, cranial; D, dorsal; M, medial; C, secondary covert feather; T, ‘tether’ of secondary feather (S) sheath (sheath = calamus wall; calamus = quill). The lower drawing is a proximal-to-distal view of the left forelimb transversely sectioned at mid-diaphysis. A secondary feather is shown diagrammatically in profile; the remainder of the drawing represents the actual cross-section. There are 18 secondary feathers in domesticated turkeys, and all of these ‘attach’ via ‘tethers’ along the caudal ulna (Lucas & Stettenheim, 1972). The arrow indicates the location of a firm insertion of muscles into the cranial cortex. (The upper figure is modified after Figs 18,4 and 18,8 in the Guild Handbook of Scientific Illustrations (Hodges, 1989) with permission of the artist Nancy Halliday and the publisher.)
The aims of this study were to examine turkey ulnae to test: (1) de Margerie's hypothesis that variations in predominant CFO are strongly correlated with LI (i.e. where higher laminarity correlates positively with more oblique-to-transverse CFO), (2) the hypothesis that topographic CFO/LI patterns are consistent with the possibility that this bone experiences a change from habitual bending in subadults to torsion in adults, and (3) the hypothesis that LI would be highest in neutral axis regions. Correlation analyses are also conducted to examine relationships between LI and variations in other structural and material characteristics. We also speculate on causal mechanisms for the high correlations shown between LI and predominant CFO, including confounding roles played by differential growth rates. Limitations in the use of LI and CFO for inferring strain-related adaptations are also considered.
Materials and methods
One ulna was obtained from each of 11 skeletally immature (young subadult, approximately 3- to 4-month-old) and 11 skeletally mature (adult, 2-year-old) domesticated (‘broad-breasted white’) turkeys. Each bone was dissected free of soft tissue and transversely cut into two 5.0-mm segments, one proximal and the other distal to mid-diaphysis (i.e. the midpoint between articular surfaces). Marrow was removed with a spatula and a brisk stream of water; solutions were not used to remove adherent tissues. The proximal segment was embedded in polymethyl methacrylate (PMMA) (Emmanual et al. 1987) in an un-demineralized, un-stained state and prepared for ultra-milling (as described below). The thicknesses of the dorsal, ventral, cranial and caudal cortices were measured by the same investigator using a digital vernier caliper (Mitutoyo™, Kanagawa, Japan). The ultra-milled segment was used for CFO and microstructural analyses, including quantification of LIs (see below and Fig. 1). The distal segment was used to determine mineral content (percentage ash) in the dorsal, ventral, cranial and caudal cortices as reported previously (Skedros et al. 2003b).
Definition of individual octants, and ‘tension’ and ‘compression’ regions
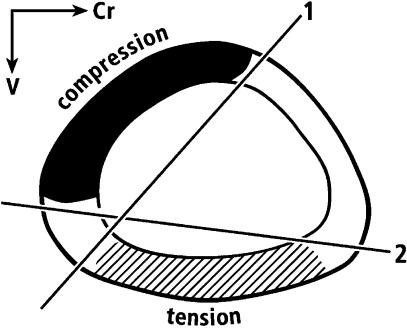
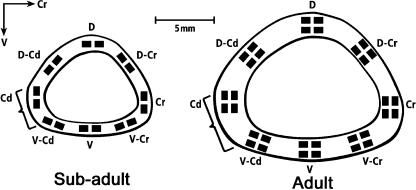
Microstructural and ultrastructural (i.e. CFO) analyses were conducted in the following cortical octants: dorsal (D), dorsal–cranial (D-Cr), cranial (Cr), ventral–cranial (V-Cr), ventral (V), ventral–caudal (V-Cd), caudal (Cd) and dorsal–caudal (D-Cd) (Figs 3 and 4). Based on in vivo strain measurements (Rubin & Lanyon, 1985), the D-Cd, D and D-Cr cortices generally receive longitudinal compression strains, and V-Cd, V and V-Cr cortices generally receive longitudinal tension strains (Fig. 5). Cortices along the habitual neutral axis (Cr and Cd) generally receive principal strains that are oblique to the long axis of the bone, and shear strains that are generally more prevalent/predominant (i.e. where shear strains are not generally dominated by longitudinal tension or compression). Although shear strains exist throughout the bone cross-section, this is the prevalent strain mode along the neutral axis because bending loads, superimposed on torsional loading, would eclipse the shear strains in the compression/tension (dorsal/ventral) regions. Microstructural and ultrastructural characteristics of each octant were examined both independently and as combined regions representing ‘tension’, ‘compression’ and ‘neutral axis’ locations. For example, the dorsal and ventral cortices were analysed for possible adaptations to compression and tension, respectively. Additional comparisons were conducted among cortical groups that do not reflect this strain-mode selection bias.
Fig. 5.
Range (‘1’ to ‘2’) of the neutral axis (NA) during the normal wing-flapping cycle. Among all regions, the cranial and caudal cortices are most consistently along the neutral axis. Adapted from Rubin & Lanyon (1985) with permission of Springer Publishing.
Circularly polarized light analysis
Using published methods (Boyde & Riggs, 1990; Skedros et al. 1996), predominant CFO was determined from circularly polarized light images using the 100 ± 5-µm ultramilled, PMMA-embedded sections obtained from each bone. One 50× image was obtained in each octant. Regional differences in CFO were inferred from corresponding differences in the intensity of transmitted light, where darker grey levels (lower numerical values) represent relatively more longitudinal collagen, and brighter grey levels (higher numerical values) represent relatively more oblique-to-transverse collagen. Grey level values are represented as integers from 0 to 255. The methods used to determine a weighted mean grey level (WMGL) from each image are described elsewhere (Skedros et al. 1996; Bloebaum et al. 1997). Grey level values of 20 and lower were eliminated because they represent tissue voids such as vascular canals and lacunae. Boyde & Riggs (1990) have shown that these methods produce similar relative differences between cranial (‘tension’; dark grey levels) and caudal (‘compression’; bright grey levels) cortices of mineralized and demineralized PMMA-embedded sections of equine radii. Although regional differences in mineralization might influence grey levels, this influence is considered negligible in the present investigation because mineralization (percentage ash) differences are typically < 1% at mid-diaphyseal equine radii and turkey ulnae (Mason et al. 1995; Skedros et al. 2003b).
Mean grey level values were quantified in one 50× image (512 × 480 pixels; approximately 2.3 mm2 per image) in each octant of each bone. This resolution is not sufficient to visualize collagen fibres individually (Bromage et al. 2003). Analysed regions sampled the central 80% of the cortex in order to avoid the variably present, highly birefringent circumferential lamellar bone in adults. Dorsal, ventral, cranial and caudal locations were immediately proximal to the locations from which the ashed samples had been taken. Methods used to quantify CFO differences as differences in grey levels (Skedros et al. 1996; Bromage et al. 2003) have produced relative differences that are similar to the ‘longitudinal structure index’ used by others (Martin & Burr, 1989; Martin et al. 1996; Takano et al. 1999; Kalmey & Lovejoy, 2002).
Laminarity analysis
‘Laminarity’ or ‘laminarity index’ (LI) refers to the relative proportion of the vascular area represented by circularly orientated primary vascular canals. This value was determined using the methods of de Margerie (2002). This designation is largely based on four basic primary vascular canal orientations (Fig. 1), and also on categories of bone with primary vascular canals orientated in more than one direction as described by de Ricqlès et al. (1991, pp. 23–25): (a) laminar vascularization – superimposed vascular layers formed by anastomosing longitudinal and circular vascular canals; (b) plexiform vascularization – laminar vascularization with radial vascular canals; (c) reticular vascularization – regularly but obliquely orientated vascular canals.
This categorization, based on vascular patterns, distinguishes the more specific nomenclature used herein from other common uses of some of these terms to describe more generally this primary bone histology (e.g. the use of the term ‘laminar’ bone as a synonym for ‘fibrolamellar’ or ‘plexiform’ bone; Currey, 2002; pp. 18–19).
The circularly polarized light images that were used to obtain CFO data were examined and primary osteonal orientation was estimated through the orientation of the vascular network. Primary vascular canals were classified into four categories using methods of de Margerie (2002) (Fig. 1): (1) circular canals (C) – canals lying in the plane of the section, approximately parallel (0 ± 22.5°) to the periosteal and endosteal surfaces; (2) radial canals (R) – canals lying in the plane of the section, approximately orthogonal (90 ± 22.5°) to the periosteal and endosteal surfaces; (3) oblique canals (O) – other canals lying in the plane of the section; and (4) longitudinal canals (L) – canals orientated perpendicular to the plane of the section.
A primary vascular canal was required to exhibit a length/width ratio of 3 : 1 or greater in order to be considered ‘lying in the plane of the section’; otherwise, it was considered a longitudinal (L) canal. The infrequent secondary (Haversian) canals were excluded from laminarity analysis. The area of each type of primary canal was quantified in the circularly polarized light images using the public domain NIH image (v.1.61) software (http://rsb.info.nih.gov/nih-image/). First, each primary canal was assigned to one of the four groups (C, R, O, L) according to the above criteria. Then, using the ‘threshold’ function of NIH image, which allows vascular canals to appear entirely black and bone to appear white on digitized greyscale images, the image areas represented by each canal type were determined.
Microstructure
Using the ultramilled section from each bone, two 200× backscattered electron images were obtained in each octant in subadult specimens. In order to analyse a roughly similar proportion of an intracortical octant location, four 200× images (two inner and two outer) were obtained in each octant in adult specimens (Fig. 4). In each cortical location of each age group, one averaged value of each parameter was obtained. The following parameters were quantified for each image (Skedros et al. 2003b) (see Appendix for abbreviations): (1) secondary osteon population density (N.On/Ar, no. mm−2), (2) fractional area of secondary bone (On.B/Ar, expressed as a percentage), (3) mean porosity (Po/Ar, expressed as a percentage) excluding osteocyte lacunae and artifactual cracks, and (4) osteocyte lacuna population density (N.Lac/Ar, no. mm−2; excluding non-lacuna porosity). In each image, N.On/Ar, On.B/Ar, Po/Ar and N.Lac/Ar were quantified using NIH image software.
Fig. 4.
Representative mid-diaphyseal cross-sections of an immature (i.e. subadult) turkey ulna (left) and mature turkey ulna (right). Brackets indicate regions of insertion of the fibrous ‘tether’ of the secondary feather sheaths. Dark rectangles indicate the locations where microscopic analyses were conducted. For the microstructural analyses, one averaged value of each parameter was obtained for each octant location. Predominant CFO and laminarity indices were also determined in these octant locations. D, dorsal; D-Cr, dorsal–cranial; Cr, cranial; V-Cr, ventral–cranial; V, ventral; V-Cd, ventral–caudal; Cd, caudal; D-Cd, dorsal–caudal.
Statistical analysis
Pair-wise comparisons between cortical regions of each turkey age group were assessed for statistical significance using a one-way anova with Fisher's least significant post-hoc test (Sokal & Rohlf, 1995) (Stat View Version 5.0, SAS Institute Inc., Cary, NC, USA). Pearson correlation coefficients for various comparisons were determined within each group.
Results
Collagen fibre orientation
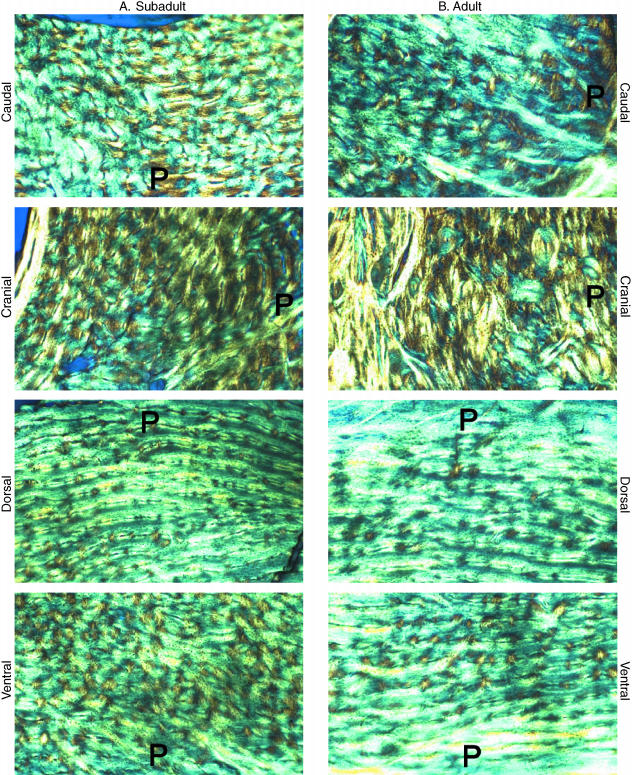
As previously reported (Skedros et al. 2003b), the mid-diaphyseal sections of both subadult and adult bones showed relatively more oblique-to-transverse CFO in the ‘compression’ region (D-Cd, D, D-Cr) than in the ‘tension’ region (V-Cd, V, V-Cr), as demonstrated by higher mean grey levels in the ‘compression’ regions (P < 0.001). By contrast, there were no significant mean grey-level differences between the cranial vs. caudal (neutral axis, ‘shear’) regions in either age group (7% difference in mature bones, P = 0.11; 5% difference in immature bones, P = 0.27). Representative circularly polarized light images are shown in Fig. 6.
Fig. 6.
Circularly polarized light images of subadult (A) and adult (B) bones. Images were taken at 50× magnification and with the same illumination. P = Image edge that is toward the periosteal surface. Field width ˜1.5 mm.
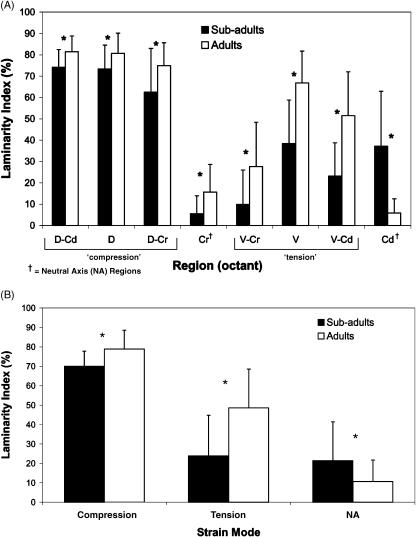
In contrast to the significant CFO differences shown between the combined ‘compression’ and ‘tension’ regions in both age groups, only the subadult bones showed such differences between individual cortical octants (i.e. dorsal vs. ventral) (Tables 1 and 2). In other words, the dorsal and ventral cortices, which are predominant ‘compression’ and ‘tension’ locations (Fig. 5), respectively, show a ‘strain-mode-specific’ predominant CFO pattern only in the immature bones. In adult bones, a relatively more uniform CFO pattern was evident. Specifically, in adult bones, the combined ventral and ventral–caudal (‘tension’) cortices showed collagen fibres with oblique-to-transverse orientation, similar to the ‘compression’ locations. This is further supported by the additional comparisons among various grouped cortical locations shown in Table 3. The ventral–cranial cortex may be a primary contributor to the difference in LI between the combined ‘tension’ region (V-Cd, V, V-Cr) and combined ‘compression’ region (D-Cd, D, D-Cr) of adult bones, as noted in Fig. 7(A). However, Table 3 suggests that there may be selection bias (especially in subadult bones) in our interpretation that the topographical CFO patterns reflect the previously defined ‘tension’, ‘compression’ and ‘neutral axis’ regions.
Table 1.
Laminarity index, ultrastructure and microstructure. * Values are given as mean ± SD
| Octant locations | LI | CFO-WMGL | Po/Ar | N.On/Ar | On.B/Ar | N.Lac/Ar |
|---|---|---|---|---|---|---|
| A. Adult bones | ||||||
| Dorsal (D) | 80.6 ± 9.5 | 182 ± 15.0 | 2.8 ± 0.7 | 0.00 ± 0.0 | 0.00 ± 0.0 | 1067.6 ± 120.7 |
| D-Cr | 74.9 ± 10.7 | 182 ± 20.6 | 3.5 ± 2.5 | 1.54 ± 0.6 | 0.76 ± 0.3 | 952.4 ± 106.2 |
| Cranial (Cr) | 15.6 ± 13.0 | 116 ± 17.0 | 3.5 ± 1.3 | 4.84 ± 1.3 | 3.82 ± 1.2 | 1293.7 ± 135.2 |
| V-Cr | 27.6 ± 20.8 | 122 ± 26.6 | 4.1 ± 2.2 | 6.86 ± 2.2 | 6.69 ± 2.3 | 952.2 ± 147.7 |
| Ventral (V) | 66.8 ± 14.9 | 182 ± 25.2 | 3.7 ± 4.3 | 0.35 ± 0.2 | 0.67 ± 0.4 | 980.1 ± 113.4 |
| V-Cd | 51.5 ± 20.5 | 157 ± 27.7 | 4.0 ± 2.0 | 24.55 ± 5.1 | 19.01 ± 3.8 | 1012.1 ± 185.4 |
| Caudal (Cd) | 5.8 ± 6.7 | 109 ± 15.1 | 5.2 ± 3.1 | 12.66 ± 2.8 | 13.49 ± 2.8 | 1272.8 ± 191.6 |
| D-Cd | 81.4 ± 7.4 | 191 ± 12.2 | 3.2 ± 1.8 | 0.56 ± 0.4 | 0.88 ± 0.8 | 957.9 ± 122.9 |
| B. Subadult bones | ||||||
| Dorsal (D) | 73.3 ± 11.2 | 173.6 ± 20.4 | 4.1 ± 0.7 | 1174.4 ± 117.1 | ||
| D-Cr | 62.5 ± 20.5 | 156.8 ± 13.5 | 5.0 ± 1.9 | 1076.0 ± 119.0 | ||
| Cranial (Cr) | 5.5 ± 8.4 | 118.1 ± 9.1 | 5.0 ± 2.0 | 1523.5 ± 209.5 | ||
| V-Cr | 9.9 ± 16.1 | 108.7 ± 11.3 | 5.1 ± 1.6 | 1234.6 ± 152.9 | ||
| Ventral (V) | 38.4 ± 20.4 | 140.7 ± 17.5 | 4.9 ± 1.2 | 1317.9 ± 196.4 | ||
| V-Cd | 23.2 ± 15.5 | 128.8 ± 21.3 | 4.5 ± 1.4 | 1357.8 ± 242.1 | ||
| Caudal (Cd) | 37.2 ± 25.7 | 107.3 ± 15.6 | 3.9 ± 0.9 | 1815.8 ± 361.2 | ||
| D-Cd | 74.2 ± 8.2 | 182.9 ± 13.7 | 3.7 ± 0.9 | 1063.3 ± 111.7 | ||
See Appendix for abbreviations.
Table 2.
Octant-to-octant comparisons (P values): subadult (A) and adult (B) bones
| Collagen fibre orientation | |||||||||
|---|---|---|---|---|---|---|---|---|---|
| Laminarity | D-Cd | D | D-Cr | Cr | V-Cr | V | V-Cd | Cd | |
| A. Subadult bones | |||||||||
| D-Cd | < 0.001 | < 0.001 | < 0.001 | < 0.001 | < 0.001 | < 0.001 | < 0.001 | ||
| D | 0.439 | < 0.01 | < 0.001 | < 0.001 | < 0.001 | < 0.001 | < 0.001 | ||
| D-Cr | 0.102 | < 0.05 | < 0.001 | < 0.001 | < 0.01 | < 0.001 | < 0.001 | ||
| Cr | < 0.001 | < 0.001 | < 0.001 | < 0.05 | < 0.001 | 0.024 | 0.185 | ||
| V-Cr | < 0.001 | < 0.001 | < 0.001 | 0.242 | < 0.001 | < 0.001 | 0.410 | ||
| V | < 0.001 | < 0.001 | < 0.001 | < 0.001 | < 0.001 | < 0.05 | < 0.001 | ||
| V-Cd | < 0.001 | < 0.001 | < 0.001 | < 0.01 | 0.113 | < 0.001 | < 0.001 | ||
| Cd | < 0.001 | < 0.001 | < 0.001 | < 0.001 | < 0.001 | 0.507 | < 0.01 | ||
| B. Adult bones | |||||||||
| D-Cd | 0.167 | 0.178 | < 0.001 | < 0.001 | 0.164 | < 0.001 | < 0.001 | ||
| D | 0.854 | 0.973 | < 0.001 | < 0.001 | 0.992 | < 0.001 | < 0.001 | ||
| D-Cr | 0.109 | 0.156 | < 0.001 | < 0.001 | 0.965 | < 0.001 | < 0.001 | ||
| Cr | < 0.001 | < 0.001 | < 0.001 | 0.289 | < 0.001 | < 0.001 | < 0.05 | ||
| V-Cr | < 0.001 | < 0.001 | < 0.001 | < 0.01 | < 0.001 | < 0.001 | < 0.01 | ||
| V | < 0.001 | < 0.001 | < 0.05 | < 0.001 | < 0.001 | < 0.001 | < 0.001 | ||
| V-Cd | < 0.001 | < 0.001 | < 0.001 | < 0.001 | < 0.001 | < 0.001 | < 0.001 | ||
| Cd | < 0.001 | < 0.001 | < 0.001 | < 0.01 | < 0.001 | < 0.001 | < 0.001 | ||
See text for abbreviations.
Table 3.
Comparisons (P values) between groups not associated with strain mode
| Group comparison | LI | CFO |
|---|---|---|
| Sub-adults | ||
| 1 vs. 2 | < 0.01 | < 0.01 |
| 3 vs. 4 | < 0.05 | 0.051 |
| 5 vs. 6 | < 0.001 | < 0.001 |
| Adults | ||
| 1 vs. 2 | < 0.05 | 0.081 |
| 3 vs. 4 | 0.737 | 0.528 |
| 5 vs. 6 | 0.075 | 0.148 |
Group 1 {D, D-Cr, Cr}; Group 2 {V, V-Cd, Cd}; Group 3 {D-Cr, Cr, V-Cr}; Group 4 {V-Cd, Cd, D-Cd}; Group 5 {V, V-Cr, Cr}; Group 6 {Cd, D-Cd, D}.
See Appendix for abbreviations.
Fig. 7.
Laminarity index by octant (A) and strain mode (B). In both subadult (n = 11) and adult (n = 11) bones, laminarity index in ‘compression’ cortices (D-Cd, D, D-Cr) is significantly higher than in ‘tension’ cortices (V-Cr, V, V-Cd) and ‘neutral axis’ (NA) cortices (Cr, Cd) (P < 0.01). In subadults, there is no significant difference in laminarity index between ‘tension’ cortices and ‘neutral axis’ cortices (P = 0.51). *Significant difference between age groups for each octant (A) or specific strain mode (B). Error bars represent one standard deviation.
Laminarity index
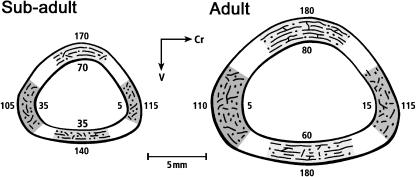
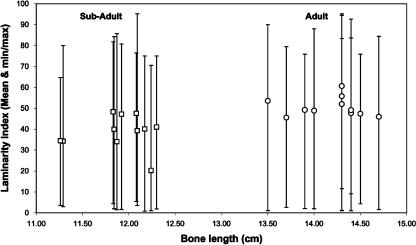
Laminarity indices (LIs) for all bones in each age group, ‘combined’ regions and octants are shown in Tables 1 and 2 and Fig. 7. Figure 8 shows diagrammatic depictions of typical differences in LI and predominant CFO between the dorsal, ventral, cranial and caudal cortices of each age group. The mean LI of all regions in subadult ulnae (40.0 ± 10.7%) was significantly lower than inadults (50.9 ± 10.4%) (P < 0.001). However, the scatter plot shown in Fig. 9 demonstrates that there is broad regional variation in LI within individuals and within each age group, and considerable overlap between age groups in maximum/minimum values.
Fig. 8.
Diagrammatic representation of typical differences in laminarity indices and predominant collagen fibre orientation (CFO) in dorsal, ventral, cranial, and caudal cortices of subadult (left) and adult (right) bones. The numerical values along the endosteal margins are laminarity indices (see Fig. 1). The values along the periosteal margins represent the mean grey level of each location, which corresponds to predominant CFO (higher numbers represent relatively more oblique-to-transverse CFO than lower numbers).
Fig. 9.
Scatter plot of bone length vs. laminarity index. Squares indicate subadult bones; circles indicate adult bones. Each symbol indicates one bone, and the vertical bars associated with each data point indicate the minimum/maximum range of the laminarity indices of the octants of the bone. The P value of this subadult (n = 88 data points) vs. adult (n = 88 data points) comparison is < 0.001.
Octant analysis in adult bones showed that LIs were highest in ‘compression’ cortices (D-Cd, D, D-Cr) and lowest in the neutral axis regions (Cr and Cd) (P < 0.001). Subadult bones also showed a relatively higher LI in ‘compression’ regions, and lower LI in neutral axis regions; however, there was no difference between ‘tension’ (V-Cd, V, V-Cr) and ‘neutral axis’ regions (P = 0.51) (Fig. 7). As shown for the predominant CFO data, additional comparisons among various cortical locations shown in Table 3 demonstrate that there may be selection bias in our interpretations that topographic variations in LI reflect the ‘tension’, ‘compression’ and ‘neutral axis’ region designations.
Microstructure
Results of additional microstructure analyses are also shown in Table 1. Statistical analyses of these regional microstructural variations have been reported previously (Skedros et al. 2003b). Results of microscopic analyses, observations and cortical thickness measurements suggest that adult bones do not contain residual bone from the subadult stage. This may indicate that the cross-section increases in size around a centroid that maintains the same relative position in three-dimensional space and that bone is ‘uniformly’ removed from endosteal surfaces.
Qualitative observations in adult bones show that secondary osteons are roughly circular in cross-section. This suggests that the osteons are generally aligned along the longitudinal axis of the bone regardless of the local primary bone histology. The migration of forming osteons may therefore not necessarily correspond to primary vascular canal orientation.
Correlation analyses
Correlations among all characteristics are reported in Table 4. High positive correlations were shown between LI and predominant CFO (adults: r = 0.866; subadults: r = 0.735; all bones: r = 0.831; P < 0.001). Not surprisingly, N.On/Ar and On.B/Ar also have a high correlation (r = 0.930; P < 0.001). The only other correlations exceeding | 0.700 | were in adult bones and were between Cort.Th and CFO (r = −0.710; P < 0.001), and Cort.Th and LI (r = −0.738; P < 0.001).
Table 4.
Correlation matrix (r values) for all variables in subadult (A) and adult (B) bones
| Po/Ar | N.Lac/Ar | CFO | L.I. | Cort.Th | |||
|---|---|---|---|---|---|---|---|
| (A) Subadult bones | |||||||
| Po/Ar | 1.000 | ||||||
| N.Lac/Ar | 0.112 | 1.000 | |||||
| CFO | −0.204a | −0.581c | 1.000 | ||||
| L.I. | −0.129 | −0.430b | 0.735c | 1.000 | |||
| Cort.Th | 0.119 | 0.416b | −0.475c | −0.470c | 1.000 | ||
Discussion
The results of the present study support the hypothesis that LI and the relative amount of oblique-to-transverse collagen fibres are highly correlated. Expected relationships in neutral axis locations, however, were not found (as discussed below). With respect to the first hypothesis, we found a strong positive correlation between LI and CFO in both subadults and adults. It is not known if this correlation reflects a causal relationship between predominant CFO and orientation of the primary vascular network. Although de Margerie (2002) did not suggest a theoretical basis for this relationship, he did suggest that higher LI (i.e. > ∼50%) may reflect habitual torsional loading, and relatively lower LI habitual bending (i.e. longitudinal compression and tension in opposing cortices). If this interpretation is correct, then the data of the present study support our suggestion (Skedros et al. 2003b) that the histomorphology of the subadult turkey ulna is correlated with more prevalent bending (mean LI: 40.0%), and the histomorphology of the adult turkey ulna is correlated with torsional loading (mean LI: 51%).
The second hypothesis is based on our previous study (Skedros et al. 2003b), which showed that, compared with subadult ulnae, adult bones have comparatively more uniform CFO rather than a compression/tension pattern in dorsal/ventral cortices, respectively. We suggested that if CFO is truly strain-mode sensitive and specific, then the ulnae of subadults might experience relatively greater and/or more prevalent bending loads. This seems to be supported by observations that young subadults flap their wings with greater frequency and vigour, and attempt to fly more frequently as compared with adults (D. Adams and T. Olson, personal communications; J.S., personal observations). Adult flapping behaviours also have a comparatively more complex rotational component, suggesting that torsional loading (and hence increased shear) is relatively more prevalent in adults. This may produce ‘shear-related adaptations’ similar to the torsionally loaded ovine tibia, chicken femur and alligator femur (Lanyon & Bourn, 1979; Carrano & Biewener, 1999; Lee, 2004), in which CFO patterns are also relatively uniform throughout an entire diaphyseal section (Skedros, 2001, 2002). In vivo strain data in growing turkey ulnae are needed to test these hypotheses.
Our third hypothesis suggests that LI would be highest in neutral axis (NA) regions. This hypothesis was not supported by the present study as we found LI to be lowest in NA regions in both subadult and adult age groups. The histomorphological organization of the turkey ulna caudal and ventral–caudal cortices may be distinct from other locations because this is the area where feather ‘tethers’ attach and shear strains are probably more localized. The cranial cortex may similarly accommodate local metabolic/mechanical demands of muscle insertion and the shifting neutral axis (Fig. 5). These explanations, which have been used to explain the comparatively higher secondary osteon densities in neutral axes of adult ulnae (Skedros et al. 2003b), might also help explain the corresponding lower LI. These differences may be adaptive because cortical bone is generally weaker in shear than in tension or compression. However, relationships between shear and bone adaptation often evade simple structure–function interpretations, as is evident in the observation that high LIs were not found in ‘shear’ locations (i.e. NA).
‘Amprino's rule’: an important consideration
The idea that primary bone microstructure may reflect bone formation rate was suggested by Amprino (1947) and recently tested experimentally in mallard limb bones by Castanet et al. (1996) and de Margerie et al. (2002). This most recent study, however, showed that only the presence and proportion of longitudinal canals are positively correlated with bone formation rate. We have previously reported that from the subadult to adult stage, the caudal cortex of the turkey ulna exhibits greater increases in thickness relative to other cortices. If the caudal cortical thickness increases at a faster rate, then the low LI (i.e. high density of longitudinal canals) may be a function of appositional bone formation rate. This may explain results in adult bones showing high negative correlations between Cort.Th and LI (r = −0.738, P < 0.001), and Cort.Th and CFO (r = −0.710, P < 0.001). However, it is also possible that this relationship reflects a longer formation period rather than localized faster growth. Studies using fluorochrome labels are needed to resolve these issues.
The observation that histological structure of primary bone may reflect formation rate is a general finding that has been reported by Currey (2002), Stover et al. (1992) and others (see de Ricqlès et al. 1991; Mori et al. 2003). This brings into question the relationships of laminarity with loading history suggested by de Margerie. de Margerie et al. (2002) imply that the difference in laminar organization of canals in mallard long bones is probably not influenced by growth rates, i.e. ‘laminar’ fibrolamellar tissue in the torsionally loaded femur and humerus does not grow faster than in the tension/compression-loaded tibia or radius. In other words, there is little correlation between vascular canal organization and growth rates. However, they examined growth rates of fibrolamellar bone by typological groups (laminar, reticular, longitudinal) and not by skeletal element. This distinction is necessary for determining if the femur, humerus and ulna simply grow faster radially than the tibia or radius.
In a recent study of growing king penguin limb bones (humerus, radius, femur, tibiotarsus), de Margerie et al. (2004) examined growth rates and associated bone tissue types (‘laminar’, ‘longitudinal’, ‘reticular’ or ‘radial’ fibrolamellar) in transverse sections. They showed that highest rates of growth were associated with ‘radial’ microarchitecture of fibrolamellar bone, where vascular cavities in the woven network are aligned radially. Our data showing relatively lower LI in subadult turkey ulnae compared with adult ulnae may be a difference that is similarly influenced, perhaps even more strongly than by loading history, by ontogenetic changes in growth rate. Regional variations in growth rates may account for the ‘unexpected’ LI and/or CFO differences in the combined regions (Table 3). It is hypothesized that accelerated growth of the altricial wing skeleton (as compared with the precocial hind limb skeleton) associated with fledgling, as described in gulls (Carrier & Leon, 1990) and suggested in mallards (including ontogenetic changes in the rate of osteogenesis in some bones) (Castanet et al. 1996), may also occur in the domesticated turkey. Additionally, there seems to be a greater tendency for the microstructure of slower growing bone to be aligned in the longitudinal direction, especially if growth is greater in that direction. For example, Petrtýl et al. (1996) speculate that the longitudinal orientation of the canals in the primary bone tissue of human femora is a consequence of longitudinal shifting of the periosteum against the bone surface. Similar interpretations have been suggested for the longitudinal primary vascular canals in the slow-growing long bones of alligators (Lee, 2004). These observations may have implications for explaining ontogenetic changes in turkey ulna histomorphology.
Causal functional/mechanistic interpretations
In view of the foregoing discussion and the high correlations between CFO and LI, we offer two simplified, testable functional/mechanistic interpretations. (1) The primary bone matrix is deposited on the primary vascular network, which exhibits a preferred orientation. The collagen matrix ‘aligns’ in a predictable fashion on the vascular network. Therefore, orientation in the vascular network, whether relatively uniform (e.g. laminar) or irregular (e.g. reticular), is the most important ‘causal mediator’ of the apparent regional differences in preferred CFO. Hence, vascular canal orientation is the most important influence on the high correlations between CFO and LI. In turn, preferred vascular orientation may simply be a product of programmed development expressed as different rates of osteogenesis within and between skeletal elements. (2) The bone matrix has topographical ultrastructural anisotropy (i.e. predominant CFO). This anisotropy can be enhanced, and may be dramatically different, between regions exposed to different mechanical loads during matrix formation. Prevalent/predominant strain characteristics that may be most clearly linked with the production of these variations include specific strain modes (i.e. tension, compression and shear). It is the ‘adaptability’ of CFO, not the vascular orientation, that is relatively more important in producing the apparent CFO differences. Prospective experimental studies, although limited, support an important causal role for strain mode in this context (Boskey et al. 1999; Puustjarvi et al. 1999; Takano et al. 1999). In this interpretation, predominant CFO may be more strongly influenced by loading history, and laminarity may be more strongly influenced by the rate of osteogenesis.
In some cases, the high correlations may be circumstantial, not causal (e.g. interpretation 2). Because a bone's microstructural organization is subject to mechanical as well as growth demands, two questions warrant further study: is the bright birefringence simply a reflection of: (1) disorganized, rapid growth of fibrolamellar tissue or (2) ultrastructural accommodation to the strain environment?
Limitations of LI and CFO as adaptive characteristics
Problems can arise when only one morphological characteristic is employed for interpreting regional variations in loading history. For example, although the expected tension/compression differences in predominant CFO were found in subadult bones, other areas that are not strongly associated with different strain modes also showed significant differences (Tables 2 and 3). By contrast, the hypothesized regional uniformity in predominant CFO was more clearly shown in the presumably torsionally loaded environment of the adult bones. In most cases LI showed similar results. If CFO/LI are truly sensitive indicators of a locally prevalent/predominant strain mode, then the ‘expected’ differences might be confounded by influences of bending and torsion that occur throughout the development of these bones. This suggests that the turkey ulna is probably not loaded in simple (i.e. uniform) bending during any stage of its development. Data questioning the ‘high sensitivity’ of topographical CFO patterns for inferring habitual bending have also been reported in adult chicken tarso-metatarsi – analyses at mid-diaphysis show that the cranial (‘compression’) cortex has more longitudinal CFO than the opposing ‘tension’ cortex (P < 0.001) (Skedros et al. 2003a). This contrasts with expectations based on in vivo strain measurements on the same bones showing consistent compression in the cranial cortex and tension in the caudal cortex (Judex et al. 1997). Prospective experimental studies are needed to establish the sensitivity and specificity, and other limitations of CFO and LI for inferring strain-related adaptations. Also needed are rigorous definitions that incorporate spatial/temporal characterizations of ‘habitual loading’, ‘predominant/prevalent’ strains, and other strain-related characteristics that are considered important influences in bone development and adaptation. Mechanical testing of machined specimens having either longitudinal, radial, laminar and reticular vascular canals is needed to determine whether a given vascular morphology better accommodates torsion loading than other loading modes. When these goals are achieved, the relative reliability of inferring regional strain history using these characteristics can be more rigorously established.
Acknowledgments
We thank Roy Bloebaum, Kent Bachus and the Salt Lake City Veterans Administration Bone and Joint Research Laboratory for providing some of the technical equipment and support used for this study, Pat Campbell and Harlan Amstutz for the use of their laboratory facilities at the Joint Replacement Institute of Orthopedic Hospital in Los Angeles, California, Erin Young for technical work, Clinton T. Rubin for providing some of the bones and Kerry Matz for illustrations. We thank Terry Olsen (Moroni Turkey Hatchery, Moroni, UT, USA) and Douglas Adams for their personal observations of turkey behaviour, and Andrew Lee for constructive criticism of the manuscript. This research was funded by the Doctors’ Education and Research Fund at Orthopedic Hospital in Los Angeles, the Department of Veterans Affairs Medical Center, Salt Lake City, and the Utah Bone and Joint Center, Salt Lake City.
Appendix
Abbreviations
- CFO
Predominant collagen fibre orientation expressed as WMGL (see below)
- Cort.Th
Cortical thickness (mm)
- L.I.
Laminarity index (%)
- N.Lac/Ar
Osteocyte lacuna population density (no. mm−2)
- N.On/Ar
Secondary osteon population density (no. mm−2)
- On.B/Ar
Fractional area of secondary osteonal bone × 100 (%)
- Porosity (Po/Ar)
Fractional area of non-lacunar porous spaces × 100 (%)
- WMGL
Weighted mean grey level. Higher numbers indicate more oblique-to-transverse collagen, lower numbers indicate more longitudinal collagen (see CFO above)
References
- Amprino R. La structure du tissu osseux envisagée comme expression de différences dans la vitesse de l’accroissement. Arch. Biol. 1947;58:315–330. [Google Scholar]
- Bloebaum RD, Skedros JG, Vajda EG, Bachus KN, Constantz BR. Determining mineral content variations in bone using backscattered electron imaging. Bone. 1997;20:485–490. doi: 10.1016/s8756-3282(97)00015-x. [DOI] [PubMed] [Google Scholar]
- Boskey AL, Wright TM, Blank RD. Collagen and bone strength. J. Bone Miner. Res. 1999;14:330–335. doi: 10.1359/jbmr.1999.14.3.330. [DOI] [PubMed] [Google Scholar]
- Boyde A, Riggs CM. The quantitative study of the orientation of collagen in compact bone slices. Bone. 1990;11:35–39. doi: 10.1016/8756-3282(90)90069-b. [DOI] [PubMed] [Google Scholar]
- Bromage TG, Goldman HM, McFarlin SC, Warshaw J, Boyde A, Riggs CM. Circularly polarized light standards for investigations of collagen fiber orientation in bone. Anat. Rec. 2003;274B:157–168. doi: 10.1002/ar.b.10031. The New Anatomist. [DOI] [PubMed] [Google Scholar]
- Carrano MT, Biewener AA. Experimental alteration of limb posture in the chicken (Gallus gallus) and its bearing on the use of birds as analogs for dinosaur locomotion. J. Morphol. 1999;240:237–249. doi: 10.1002/(SICI)1097-4687(199906)240:3<237::AID-JMOR3>3.0.CO;2-N. [DOI] [PubMed] [Google Scholar]
- Carrier DR, Leon LR. Skeletal growth and function in the California gull (Larus californicus) J. Zool. Lond. 1990;222:375–389. [Google Scholar]
- Castanet J, Grandin A, Abourachid A, de Ricqlès A. Expression of growth dynamic in the structure of the periosteal bone in the mallard, Anas platyrhynchos. CR. Acad. Sci. III. 1996;319:301–308. [PubMed] [Google Scholar]
- Currey JD. Bones: Structure and Mechanics. Princeton, NJ: Princeton University Press; 2002. [Google Scholar]
- Emmanual J, Hornbeck C, Bloebaum RD. A polymethyl methacrylate method for large specimens of mineralized bone with implants. Stain Technol. 1987;62:401–410. doi: 10.3109/10520298709108030. [DOI] [PubMed] [Google Scholar]
- Hodges E. Guild Handbook of Scientific Illustration. New York: Van Nostrand Reinhold; 1989. [Google Scholar]
- Judex S, Gross TS, Bray RC, Zernicke RF. Adaptation of bone to physiological stimuli. J. Biomech. 1997;30:421–429. doi: 10.1016/s0021-9290(96)00060-7. [DOI] [PubMed] [Google Scholar]
- Kalmey JK, Lovejoy CO. Collagen fiber orientation in the femoral necks of apes and humans: do their histological structures reflect differences in locomotor loading? Bone. 2002;31:327–332. doi: 10.1016/s8756-3282(02)00828-1. [DOI] [PubMed] [Google Scholar]
- Lanyon LE, Bourn S. The influence of mechanical function on the development and remodeling of the tibia: An experimental study in sheep. J. Bone Joint Surg. 1979;61-A:263–273. [PubMed] [Google Scholar]
- Lee AH. Histological organization and its relationship to function in the femur of Alligator mississippiensis. J. Anat. 2004;204:197–207. doi: 10.1111/j.0021-8782.2004.00275.x. [DOI] [PMC free article] [PubMed] [Google Scholar]
- Lucas AM, Stettenheim PR. Avian Anatomy Integument. Part I. Washington, DC: US Government Printing Office; 1972. [Google Scholar]
- de Margerie E. Laminar bone as an adaptation to torsional loads in flapping flight. J. Anat. 2002;201:521–526. doi: 10.1046/j.1469-7580.2002.00118.x. [DOI] [PMC free article] [PubMed] [Google Scholar]
- de Margerie E, Cubo J, Castanet J. Bone typology and growth rate: testing and quantifying ‘Amprino's rule’ in the mallard (Anas platyrhynchos) CR. Biol. 2002;325:221–230. doi: 10.1016/s1631-0691(02)01429-4. [DOI] [PubMed] [Google Scholar]
- de Margerie E, Robin J-P, Verrier D, Cubo J, Groscolas R, Castanet J. Assessing a relationship between bone microstructure and growth rate: a fluorescent labelling study in the King Penguin chick (Aptenodytes patagonicus) J. Exp. Biol. 2004;207:869–879. doi: 10.1242/jeb.00841. [DOI] [PubMed] [Google Scholar]
- Martin RB, Burr DB. Structure, Function and Adaptation of Compact Bone. New York: Raven Press; 1989. [Google Scholar]
- Martin RB, Mathews PV, Lau ST, Gibson VA, Stover SM. Collagen fiber organization is related to mechanical properties and remodeling in equine bone. A comparison of two methods. J. Biomech. 1996;29:1515–1521. [PubMed] [Google Scholar]
- Mason MW, Skedros JG, Bloebaum RD. Evidence of strain-mode-related cortical adaptation in the diaphysis of the horse radius. Bone. 1995;17:229–237. doi: 10.1016/8756-3282(95)00213-w. [DOI] [PubMed] [Google Scholar]
- Mori R, Kodaka T, Sano T, Yamagishi N, Asari M, Naito Y. Comparative histology of the laminar bone between young calves and foals. Cell Tissue Organs. 2003;175:43–50. doi: 10.1159/000073436. [DOI] [PubMed] [Google Scholar]
- Petrtýl M, Heřt J, Fiala P. Spatial organization of Haversian bone in man. J. Biomech. 1996;29:161–169. doi: 10.1016/0021-9290(94)00035-2. [DOI] [PubMed] [Google Scholar]
- Puustjarvi K, Nieminen J, Rasanen T, Hyttinen M, Helminen HJ, Kroger H, et al. Do more highly organized collagen fibrils increase bone mechanical strength in loss of mineral density after one-year running training. J. Bone Miner. Res. 1999;14:321–329. doi: 10.1359/jbmr.1999.14.3.321. [DOI] [PubMed] [Google Scholar]
- de Ricqlès A, Meunier FJ, Castanet L, Francillon-Vieillot H. Comparative microstructure of bone. In: Hall BK, editor. Bone Matrix and Bone-Specific Products. Boca Raton, FL: CRC Press; 1991. pp. 1–78. [Google Scholar]
- Rubin CT, Lanyon LE. Regulation of bone mass by mechanical strain magnitude. Calcif. Tissue Int. 1985;37:411–417. doi: 10.1007/BF02553711. [DOI] [PubMed] [Google Scholar]
- Skedros JG, Mason MW, Nelson MC, Bloebaum RD. Evidence of structural and material adaptation to specific strain features in cortical bone. Anat. Rec. 1996;246:47–63. doi: 10.1002/(SICI)1097-0185(199609)246:1<47::AID-AR6>3.0.CO;2-C. [DOI] [PubMed] [Google Scholar]
- Skedros JG. Collagen fiber orientation: a characteristic of strain-mode-related regional adaptation in cortical bone. Bone. 2001;28:S110–S111. [Google Scholar]
- Skedros JG. Use of predominant collagen fiber orientation for interpreting cortical bone loading history: Bending vs. torsion. J. Bone Miner. Res. 2002;17:000–000. [Google Scholar]
- Skedros JG, Demes B, Judex S. Limitations in the use of predominant collagen fiber orientation for inferring loading history in cortical bone. Am. J. Phys. Anthrop. Suppl. 2003a;36:193. [Google Scholar]
- Skedros JG, Hunt KJ, Hughes PE, Winet H. Ontogenetic and regional morphologic variations in the turkey ulna diaphysis: implications for functional adaptation of cortical bone. Anat. Rec. 2003b;273A:609–629. doi: 10.1002/ar.a.10073. [DOI] [PubMed] [Google Scholar]
- Sokal RR, Rohlf FJ. Biometry. The Principles and Practice of Statistics in Biological Research. 2nd edn. New York: W.H. Freeman; 1995. [Google Scholar]
- Stover SM, Pool RR, Martin RB, Morgan JP. Histological features of the dorsal cortex of the third metacarpal bone mid-diaphysis during postnatal growth in thoroughbred horses. J. Anat. 1992;181:455–469. [PMC free article] [PubMed] [Google Scholar]
- Takano Y, Turner CH, Owan I, Martin RB, Lau ST, Forwood MR, Burr DB. Elastic anisotropy and collagen orientation of osteonal bone are dependent on the mechanical strain distribution. J. Orthop. Res. 1999;17:59–66. doi: 10.1002/jor.1100170110. [DOI] [PubMed] [Google Scholar]
- Zioupos P, Currey JD. The extent of microcracking and morphology of microcracks in damaged bone. J. Mater. Sci. 1994;29:978–986. [Google Scholar]


