Abstract
The morphology of human embryonic stem (ES) cells changes with their colonial growth. For a better understanding of the growth of ES cell colonies in culture, we determined their cytochemical and ultrastructural characteristics focusing on images of living cells under a phase contrast microscope. During the initial growth stages, the colonies exhibited a mosaic appearance with discernible cell–cell borders. PAS staining coupled with amylase digestion demonstrated that the bright granules and dark deposits in the cytoplasm contained glycogen. Ultrastructurally they were glycogen accumulations, and clustered open spaces associated with various amounts of glycogen. Although intercellularly heterogeneous, these structures were detectable throughout colony growth. As the colonies grew, compaction towards the centre emerged and increased, accompanied by heterogeneous increases in coarse particles with or without a halo. TUNEL showed these particles to consist at least in part of apoptotic cells/bodies. Transmission electron microscopy indicated that most apoptotic cells had been phagocytosed by intact ES cells. Spontaneous differentiation was detected occasionally in the periphery of the colonies. The presence of PAS-positive fibrous structures not susceptible to amylase digestion and laminin-immunoreactivity indicated the accumulation of extracellular matrix in the peripheral differentiated areas. These findings made it possible to determine the growth stage of human ES cell colonies.
Keywords: apoptosis, extracellular matrix, glycogen, living image, phagocytosis
Introduction
Pluripotent human embryonic stem (ES) cells have been envisaged to serve as an experimental model for early development of various cell lineages, as well as to provide an unlimited supply of various cell types for drug screening and for cell therapy in regenerative medicine (Thomson et al. 1998). They can proliferate virtually indefinitely in culture when kept in an undifferentiated state. The undifferentiated state of human ES cells is characterized by alkaline phosphatase activity, surface marker antigens such as stage-specific embryonic antigen (SSEA)-3, SSEA-4, tumour rejection antigen (TRA)-1-60 and TRA-1-81, and expression of transcription factor Oct-4 (Thomson et al. 1998; Draper et al. 2002; Laslett et al. 2003; Hwang et al. 2004). These characteristics have proved to be useful for checking the culturing condition of human ES cells.
To monitor directly the growth of human ES cells in culture, however, and to evaluate the effect of a given inductive condition on their differentiation, establishment of a morphological standard for their undifferentiated state, based on images of the living cells, is indispensable. Together with known features such as high nucleus/cytoplasm ratios and prominent nucleoli, some structures in human ES cell colonies, such as sand-like bright granules and coarse particles with a halo, are visible under a phase contrast microscope. Such structures are deemed useful for monitoring the growth of the colonies because their distribution changes along with colony growth. Although these structures have been identified in some photomicrographs of human ES cell colonies (Amit et al. 2000; Draper et al. 2002; Laslett et al. 2003; Hwang et al. 2004), their precise nature remains to be clarified.
In the study presented here, we attempted to correlate the images of living undifferentiated human ES cells with their corresponding cytochemical and ultrastructural aspects during colony growth.
Materials and methods
Cell culture
Human ES cells of the H1 line (Thomson et al. 1998; Kaufman et al. 2001) (WiCell Research Institute, Inc., Madison, WI, USA) were cultured in 5% CO2 at 37 °C in Knockout Dulbecco's modified Eagle's medium (Gibco, Grand Island, NY, USA) supplemented with 20% Knockout serum replacement (Gibco), 100 µm non-essential amino acids (Gibco), 2 mm l-glutamine (Gibco), 100 µm 2-mercaptoethanol (Sigma, Saint Louis, MO, USA) and 4 ng mL−1 of basic fibroblast growth factor (bFGF; Invitrogen, Carlsbad, CA, USA) on feeder cell layer of mitomycin C (Sigma)-inactivated primary mouse embryonic fibroblasts (Invitrogen). The cell colonies were observed with an Olympus IX70 light microscope equipped with a phase contrast apparatus, and split every 3–5 days with collagenase type IV-dissociation (Gibco) to maintain their undifferentiated state. In the present study, ES cells in passage 33–37 were cultured for up to 7 days after splitting to trace their growth. Their undifferentiated state was confirmed by means of alkaline phosphatase enzyme cytochemistry and immunocytochemistry for SSEA-1, SSEA-3 and SSEA-4 as described below (Thomson et al. 1998; Kaufman et al. 2001; Draper et al. 2002).
Cytochemistry
For detecting alkaline phosphatase activity, human ES cells cultured on gelatin-coated glass coverslips were fixed in 4% paraformaldehyde/0.1 m phosphate buffer, pH 7.4, for 1 h at room temperature. They were then rinsed three times with 20 mm phosphate-buffered saline, pH 7.4, and incubated in a nitroblue tetrazolium/bromochloroindolyl phosphate solution (NBT/BCIP; Bio-Rad, Hercules, CA, USA) for 15 min in a dark box. Some samples were fixed in 10% formalin in methanol for 1 h at room temperature, and subjected to periodic acid Schiff (PAS) staining followed by counterstaining with acidified Harris Hematoxylin according to the manufacturer's instructions (Polysciences, Warrington, PA, USA). Control for PAS staining was carried out using a digestion with 0.2% amylase in phosphate-citrate buffer, pH 5.0, for 20 min at 37 °C prior to the staining. Specimens were observed with a Nikon Microphot FXA light microscope.
Immunocytochemistry
Immunocytochemistry was performed as detailed previously (Johkura et al. 2003). In brief, the cells on coverslips were fixed in 4% paraformaldehyde/0.1 m phosphate buffer, pH 7.4, for 1 h at room temperature. Following blocking treatment with 1.5% normal goat serum/20 mm phosphate-buffered saline, pH 7.4, for 30 min, they were doubly stained with SSEA-4 antibody (clone MC-813-70, mouse IgG3) and one of the following antibodies overnight at 4 °C: SSEA-1 (clone MC-480, mouse IgM), SSEA-3 (clone MC-631, rat IgM) and laminin (clone LAM-B, rat IgG2a). All primary antibodies were purchased from Developmental Studies Hybridoma Bank (Iowa City, IA, USA). Then the specimens were incubated with a mixture of appropriate goat secondary antibodies for 1 h at room temperature: anti-mouse IgG–Alexa Fluor 568 for detecting SSEA-4, anti-mouse IgM–FITC (Chemicon, Temecula, CA, USA) for SSEA-1, anti-rat IgM–Alexa Fluor 488 for SSEA-3 and anti-rat IgG–Alexa Fluor 488 for laminin. All Alexa Fluor-labelled antibodies were purchased from Molecular Probes (Eugene, OR, USA). After nuclear counterstaining with 4′,6-diamidino-2-phenylindole, dihydrochloride (DAPI; Molecular Probes), specimens were observed with a Leica LSM TCS SP2 AOBS confocal laser scanning microscope (CLSM) equipped with Ar, He/Ne and blue diode lasers. Control staining was performed omitting the step of staining with primary antibodies.
Apoptosis assay
Apoptosis was detected by terminal deoxynucleotidyl transferase mediated d-UTP nick end-labelling (TUNEL) method, which revealed nuclear DNA fragmentation. The cells on coverslips were fixed in 1% paraformaldehyde/0.1 m phosphate buffer, pH 7.4, for 10 min at room temperature. After permeabilization with ethanol/acetic acid 2 : 1 for 5 min at −20 °C, TUNEL was performed using the ApopTag fluorescein in situ apoptosis detection kit (Chemicon) according to the manufacturer's instructions. After nuclear counterstaining with DAPI, observation was performed with CLSM.
Transmission electron microscopy
Cells were cultured on gelatin-coated plastic discs, and fixed in 2.5% glutaraldehyde/45 mm cacodylate HCl, pH 7.2, overnight at 4 °C. After rinsing three times in 180 mm sucrose/80 mm cacodylate HCl, pH 7.2, at 4 °C for 3 h, the specimens were post-fixed in 1% osmium tetroxide/0.1 m sodium cacodylate buffer, pH 7.2, for 90 min at 4 °C, dehydrated in a graded series of ethanol and embedded in epoxy resin. Resin sections of 1 µm thickness were stained with a toluidine blue solution for light microscopic detection of apoptotic cells (Erenpreisa et al. 1997). Ultrathin sections of the specimens were stained with uranyl acetate and lead citrate, and observed with a JEOL JEM-1200 transmission electron microscope at an accelerating voltage of 80 kV.
Results
Confirmation of undifferentiated state
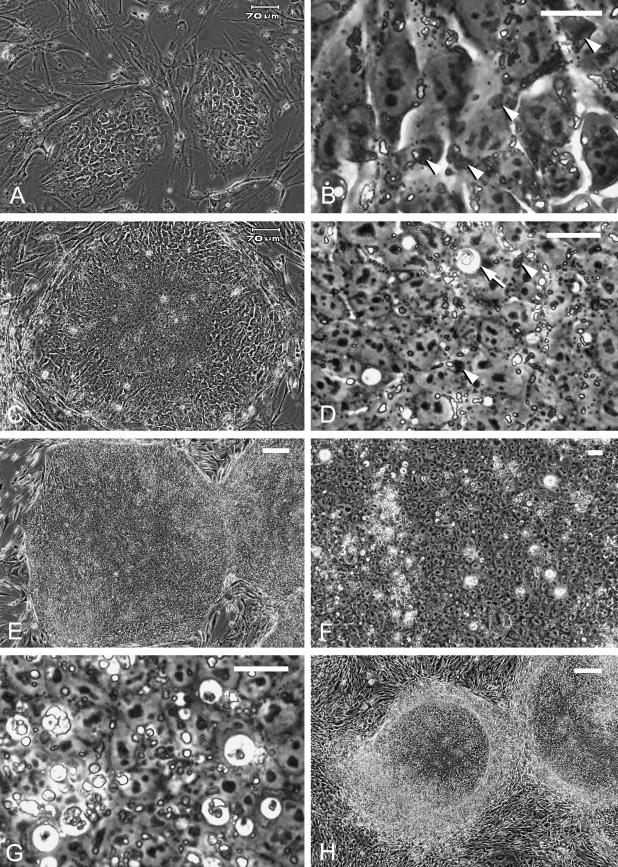
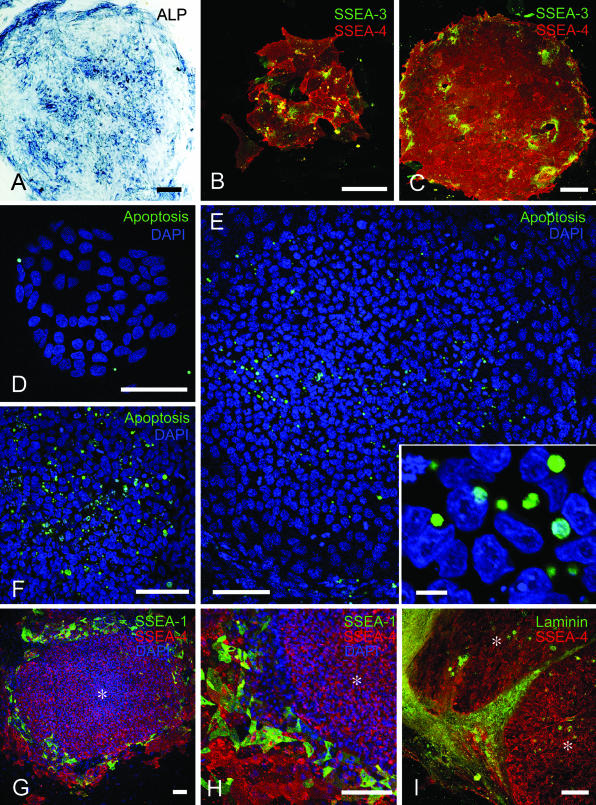
Undifferentiated human ES cells formed single-cell layer colonies in culture (Fig. 1A–G). Their morphology changed along with colony growth, while high nucleus/cytoplasm ratios and prominent nucleoli were conserved throughout this growth (Fig. 1B,D,G). The undifferentiated state was ascertained by positive staining for alkaline phosphatase enzyme cytochemistry (Fig. 3A), as well as by positive immunoreactivity to SSEA-3 and SSEA-4 (Fig. 3B,C) and negative immunoreactivity to SSEA-1 (data not shown). Most cells in the colony were positive for SSEA-4, whereas only some were positive for SSEA-3 (Thomson et al. 1998). Intercellular heterogeneity in immunoreactivity to these surface antigens was recently reported by Cui et al. (2004).
Fig. 1.
Images of living human ES cell colonies under phase contrast microscopy. (A) Initial-stage colonies 24 h after splitting. These colonies have a mosaic appearance with discernible cell–cell borders. Bar = 70 µm. (B) High magnification of one of the colonies in A. Note the dark deposits (arrowheads) and bright granules in the cytoplasm. Bar = 20 µm. (C) A colony 4 days after splitting. Central compaction and peripheral mosaic appearance can be seen. Bar = 70 µm. (D) High magnification of the colony in C. Dark deposits (arrowheads) and fine, bright granules are observed in the cytoplasm of the compact cells. A coarse particle with a halo, presumably a phagosome, can be seen (arrow). Bar = 20 µm. (E) Large, undifferentiated colonies 7 days after splitting. The colony in the centre is about 1.5 mm in diameter. Bar = 200 µm. (F) Coarse particles are dispersed heterogeneously in a large colony 7 days after splitting. Bar = 20 µm. (G) Coarse particles with or without a halo 5 days after splitting; some presumably represent apoptotic cells/bodies. Bar = 20 µm. (H) Spontaneously differentiated colonies 6 days after splitting show a peripheral differentiated area. Bar = 200 µm.
Fig. 3.
Cytochemical analyses of human ES cell colonies. (A–C) Verification of the undifferentiated state of ES cells in the 37th passage. (A) The colony is positive for alkaline phosphatase enzyme cytochemistry (ALP). (B,C) An initial-stage colony (B) and a compact colony (C) stained for SSEA-3 and SSEA-4. Most cells are positive for SSEA-4, and fewer for SSEA-3, while SSEA-4 immunoreactivity varies among cells. No intercellular gaps are observed. (D–F) Detection of apoptosis by TUNEL. (D) A few apoptotic cells are observed in an initial-stage colony. (E) Apoptotic cells/bodies are dispersed heterogeneously in a compact colony. Inset: some apoptotic cells/bodies seem to be present in the intact ES cells. (F) Increasing extent of apoptosis is evident in a large colony. (G–I) Spontaneous peripheral differentiation. (G,H) Double staining for SSEA-1 and SSEA-4. Both undifferentiated (*) and differentiated areas are positive for SSEA-4, while SSEA-1-positive cells are restricted to the differentiated areas. (I) Double staining for laminin and SSEA-4. Laminin immunoreactivity is more pronounced in the differentiated areas surrounding the undifferentiated areas (*). Bars = 100 µm in A–I, 10 µm in E inset.
Characterization of growing colonies
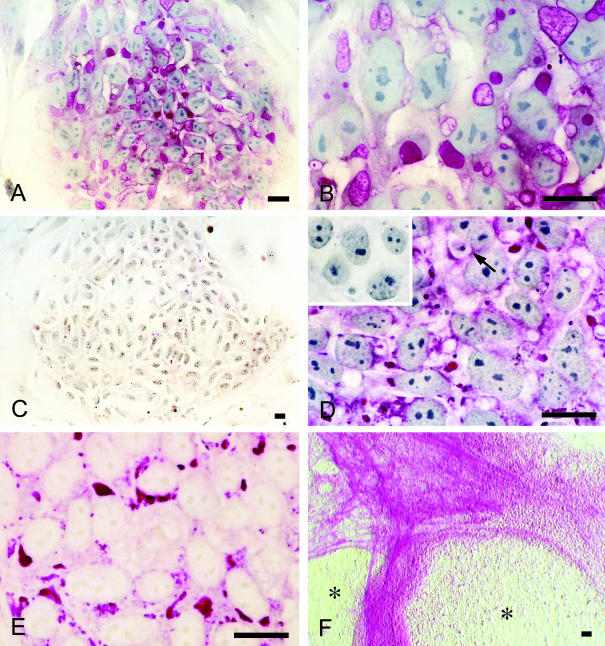
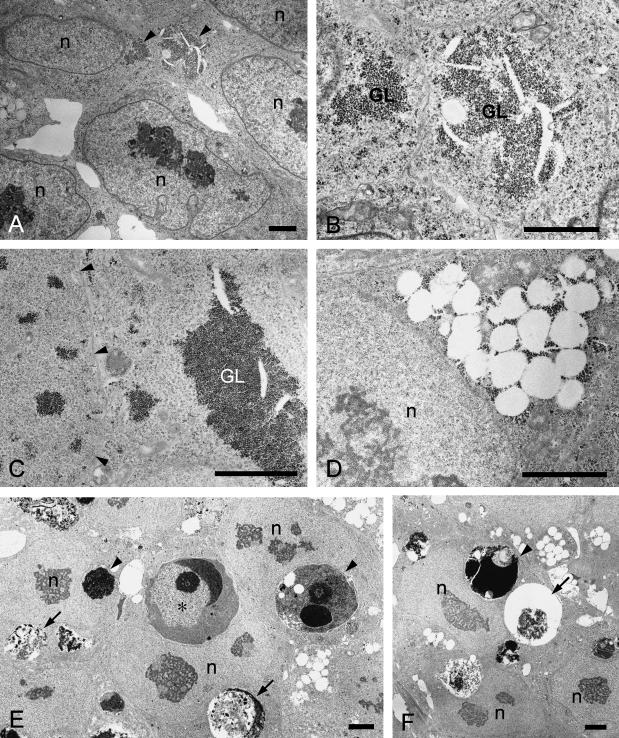
Colonies of various sizes were observed in the culture at any given time. Colony size depended on the extent of cell aggregation after collagenase treatment, so that only growth representative of small colonies in the early stage of development is described here. About 1–2 days after splitting, initial colonies consisted of expanded cells with discernible borders and a mosaic appearance (Fig. 1A). Although phase contrast microscopy indicated the presence of intercellular gaps (Fig. 1B), SSEA-4 staining showed no gaps between cells (Fig. 3B), suggesting the presence of intercellular junctions. Fine, bright and sometimes foamy granules as well as dark deposits were observed in the cytoplasm of living ES cells (Fig. 1B). The intensity of PAS staining of these structures ranged from strongly positive to negative (Fig. 2A,B). Amylase digestion clearly eliminated this reactivity (Fig. 2C), demonstrating that the PAS-positive granules/deposits contained glycogen. Transmission electron microscopy showed accumulations of glycogen granules (Fig. 4A,B), and clusters of open spaces associated with various numbers of glycogen granules (see Fig. 4D) in the cytoplasm. The former seem to correspond to the strongly PAS-positive dark deposits, whereas the latter probably represent the fine, bright granules with PAS reaction of various intensities (Figs 1B and 2B).
Fig. 2.
PAS staining of human ES cell colonies. (A) The same initial-stage colony as in Fig. 1(A). Granules with various intensities for PAS staining are clearly visible throughout the colony. (B) The same area as in Fig. 1(B). Granules and deposits seen in Fig. 1(B) show different intensities for PAS staining. (C) PAS staining of an initial-stage colony after amylase digestion. Note the significant reduction of reactivity. (D) The same area as in Fig. 1(D). Most of the dark deposits seen in Fig. 1(D) show strong intensity for PAS staining. Arrow: coarse particle with a halo. Inset: amylase digestion eliminated the reactivity. (E) Undifferentiated area of a colony with peripheral differentiation. Nuclear counterstaining was omitted. PAS-positive glycogen areas can be clearly seen in the cytoplasm. (F) Amylase digestion of the colonies with peripheral differentiation. PAS-positive fibrous structures not digested by amylase are evident in the circumference of the amylase-sensitive undifferentiated areas (*). Hoffman modulation contrast image without nuclear counterstaining. Bars = 20 µm.
Fig. 4.
Transmission electron microscopy of human ES cells. (A,B) ES cells in initial-stage colonies. (A) Glycogen areas are observed in the cytoplasm (arrowheads). (B) High magnification of the glycogen areas (GL). (C–F) ES cells in compact colonies. (C) Glycogen areas of various sizes are discernible in the cytoplasm (GL). Arrowheads indicate cell–cell borders. (D) A cluster of open spaces is associated with glycogen granules in the cytoplasm. (E) An apoptotic cell (*) and apoptotic bodies (arrowheads) have been phagocytosed by undifferentiated ES cells. Chromatin condensation on the inner nuclear membrane and prominent condensation of cytoplasm are evident in the apoptotic cell. Phagosomes containing cell debris (arrows) are also observed in the cytoplasm of ES cells. (F) The phagosome (arrow) probably corresponds to a coarse particle with a halo seen in the images of living cells. Arrowhead: apoptotic body. ‘n’ (A–F): nucleus of ES cell. Bars = 2 µm.
About 3–4 days after splitting, cells in the central region became more compact with rather vague borders (Fig. 1C). The fine, bright granules and dark deposits, i.e. clustered open spaces and glycogen areas, were still detectable in the cytoplasm (Figs 1D, 2D and 4C,D) and remained so thereafter even though the amount of glycogen in the cells varied (Fig. 2E). In addition, coarse particles with or without a halo became noticeable in the more compact regions (Figs 1D and 2D). Colonies of undifferentiated cells continued to expand for up to 7 days after splitting, the last point at which they were examined (Fig. 1E). The increase seen in the coarse particles and halos in the large compact colonies was heterogeneous, i.e. some areas were rich in particles, whereas others were less so (Fig. 1F,G). These particles appeared to represent apoptotic cells and bodies, and, in fact, many floating dead cells or cell debris was observed on the colonies at this stage (data not shown), while TUNEL provided evidence of apoptotic cells/bodies dispersed heterogeneously in the colonies (Fig. 3D–F). An increase in the extent of apoptosis became obvious with the growth and compaction of colonies, and transmission electron microscopy confirmed the discernible presence of apoptotic cells and bodies in the compact colonies (Fig. 4E). Most were observed in the cytoplasm of intact undifferentiated ES cells, indicating that they were phagocytosed by neighbouring ES cells. Phagosomes containing coarse residues of cells were also evident in many ES cells (Fig. 4E), some of which probably corresponded to the particles with a halo seen in the images of living cells (Fig. 4F).
Spontaneous differentiation into various lineages was sometimes found to occur in the colonies. One common occurrence was that differentiated cell populations appeared on the periphery of colonies and started to delineate the circumference of the undifferentiated areas (Fig. 1H). The composition of the undifferentiated areas in these colonies was generally as described above (Fig. 2E), whereas the peripheral differentiated areas contained SSEA-1-positive cells (Fig. 3G,H), indicating the origin of these areas to be ES cells rather than the surrounding feeder fibroblasts (Thomson et al. 1998). PAS-positive fibrous structures not digested by amylase, possibly extracellular matrices, had formed in the peripheral areas (Fig. 2F), while immunoreactivity for laminin confirmed the accumulation of extracellular matrices there (Fig. 3I).
Discussion
We have been able here to identify the characteristics of some visible structures in living human ES cell colonies. Fine bright granules and dark deposits in the cytoplasm usually represent clusters of open spaces and glycogen areas, respectively. Although it is currently unknown what the spaces contain, human ES cells were found to contain various amounts of glycogen throughout colony growth. This suggests that glycogen accumulation may reflect the energy metabolism of ES cells. During the development of human embryos from early pre-implantation to the blastocyst stage, a switch in energy metabolism occurs from one based principally on aerobic respiration to one based on both oxidative phosphorylation and aerobic glycolysis (Houghton et al. 1996; Martin, 2000). Throughout this period, enzyme activity of glycogen phosphorylase necessary for glycogenolysis remains undetectable (Martin et al. 1993). These findings may hold the key to an explanation of the glycogen accumulation in ES cells.
Coarse particles commonly observed in compact colonies (Amit et al. 2000; Laslett et al. 2003; Hwang et al. 2004) were shown to be in part apoptotic cells and bodies. A number of undifferentiated human ES cells were shown to undergo apoptosis during their compaction even under the standard culture conditions employed in our study (Sathananthan et al. 2002). One report suggested that apoptosis is involved in density-dependent regulation in a monolayer culture of a rat fibroblastic cell line (Yasaka et al. 1996), while other studies have clarified the functioning of apoptosis mechanisms in mouse ES cells (Mehlen et al. 1997; Xu et al. 2002; Quinlan et al. 2003). Based on the findings presented here, apoptotic cells are usually phagocytosed by neighbouring undifferentiated ES cells and then removed from the colonies. A similar fate for apoptotic cells has been observed in the inner cell mass of human blastocysts (Hardy, 1999). Human ES cell colonies may thus serve as an in vitro experimental model for apoptosis during the early development of human embryos. Accumulating evidence suggests that programmed cell death is not confined to apoptosis. Autophagic cell death, for example, has been observed in physiological states of development, and both autophagic cell death and apoptosis may occur in the same tissue (Bursch et al. 2000; Yue et al. 2003). Therefore, the possibility cannot be excluded that other mechanisms of programmed cell death are at work in human ES cell colonies.
This paper presents a representative time course of colony growth of the H1 human ES cell line. Our preliminary study found a significant increase in the number of colonies with peripheral differentiation, especially during the later stages of culture growth. Being surrounded by differentiated cells and extracellular matrices seemed to result in considerable inhibition of the expansion of the undifferentiated areas. Although the exact cause remains unclear, culture conditions in terms of media, supplements, feeder layers and plate coating (Xu et al. 2001) generally affect the growth rate and morphology of human ES cells. In addition, differences appear to exist among human ES cell lines themselves. Further clarification of the morphological features described here is necessary for a better understanding of the specific growth state of human ES cell colonies.
Acknowledgments
K.J. was supported by the Kazato Research Foundation. K.S. was supported by a Grant-in Aid for Scientific Research from the Japanese Ministry of Education, Science and Culture (No. 13558107), and by a Grant-in-Aid for 21st Century COE Programme by the Ministry of Education, Culture, Sports, Science, and Technology.
References
- Amit M, Carpenter MK, Inokuma MS, et al. Clonally derived human embryonic stem cell lines maintain pluripotency and proliferative potential for prolonged periods of culture. Dev. Biol. 2000;227:271–278. doi: 10.1006/dbio.2000.9912. [DOI] [PubMed] [Google Scholar]
- Bursch W, Hochegger K, Török L, Marian B, Ellinger A, Hermann RS. Autophagic and apoptotic types of programmed cell death exhibit different fates of cytoskeletal filaments. J. Cell Sci. 2000;113:1189–1198. doi: 10.1242/jcs.113.7.1189. [DOI] [PubMed] [Google Scholar]
- Cui L, Johkura K, Yue F, et al. Spatial distribution and initial changes of SSEA-1 and other cell adhesion-related molecules on mouse embryonic stem cells before and during differentiation. J. Histochem. Cytochem. 2004;52 doi: 10.1369/jhc.3A6241.2004. in press. [DOI] [PMC free article] [PubMed] [Google Scholar]
- Draper JS, Pigott C, Thomson JA, Andrews PW. Surface antigens of human embryonic stem cells: changes upon differentiation in culture. J. Anat. 2002;200:249–258. doi: 10.1046/j.1469-7580.2002.00030.x. [DOI] [PMC free article] [PubMed] [Google Scholar]
- Erenpreisa J, Freivalds T, Roach H, Alston R. Apoptotic cell nuclei favour aggregation and fluorescence quenching of DNA dyes. Histochem. Cell Biol. 1997;108:67–75. doi: 10.1007/s004180050147. [DOI] [PubMed] [Google Scholar]
- Hardy K. Apoptosis in the human embryo. Rev. Reprod. 1999;4:125–134. doi: 10.1530/ror.0.0040125. [DOI] [PubMed] [Google Scholar]
- Houghton FD, Thompson JG, Kennedy CJ, Leese HJ. Oxygen consumption and energy metabolism of the early mouse embryo. Mol. Reprod. Dev. 1996;44:476–485. doi: 10.1002/(SICI)1098-2795(199608)44:4<476::AID-MRD7>3.0.CO;2-I. [DOI] [PubMed] [Google Scholar]
- Hwang WS, Ryu YJ, Park JH, et al. Evidence of a pluripotent human embryonic stem cell line derived from a cloned blastocyst. Science. 2004;303:1669–1674. doi: 10.1126/science.1094515. [DOI] [PubMed] [Google Scholar]
- Johkura K, Cui L, Suzuki A, et al. Survival and function of mouse embryonic stem cell-derived cardiomyocytes in ectopic transplants. Cardiovasc. Res. 2003;58:435–443. doi: 10.1016/s0008-6363(02)00730-7. [DOI] [PubMed] [Google Scholar]
- Kaufman DS, Hanson ET, Lewis RL, Auerbach R, Thomson JA. Hematopoietic colony-forming cells derived from human embryonic stem cells. Proc. Natl Acad. Sci. USA. 2001;98:10716–10721. doi: 10.1073/pnas.191362598. [DOI] [PMC free article] [PubMed] [Google Scholar]
- Laslett AL, Filipczyk AA, Pera MF. Characterization and culture of human embryonic stem cells. Trends Cardiovasc. Med. 2003;13:295–301. doi: 10.1016/s1050-1738(03)00125-7. [DOI] [PubMed] [Google Scholar]
- Martin KL, Hardy K, Winston RM, Leese HJ. Activity of enzymes of energy metabolism in single human preimplantation embryos. J. Reprod. Fertil. 1993;99:259–266. doi: 10.1530/jrf.0.0990259. [DOI] [PubMed] [Google Scholar]
- Martin KL. Nutritional and metabolic requirements of early cleavage stage embryos and blastocysts. Hum. Fertil. (Camb.) 2000;3:247–254. doi: 10.1080/1464727002000199071. [DOI] [PubMed] [Google Scholar]
- Mehlen P, Mehlen A, Godet J, Arrigo AP. hsp27 as a switch between differentiation and apoptosis in murine embryonic stem cells. J. Biol. Chem. 1997;272:31657–31665. doi: 10.1074/jbc.272.50.31657. [DOI] [PubMed] [Google Scholar]
- Quinlan LR, Faherty S, Kane MT. Phospholipase C and protein kinase C involvement in mouse embryonic stem-cell proliferation and apoptosis. Reproduction. 2003;126:121–131. doi: 10.1530/rep.0.1260121. [DOI] [PubMed] [Google Scholar]
- Sathananthan H, Pera M, Trounson A. The fine structure of human embryonic stem cells. Reprod. Biomed. Online. 2002;4:56–61. doi: 10.1016/s1472-6483(10)61916-5. [DOI] [PubMed] [Google Scholar]
- Thomson JA, Itskovitz-Eldor J, Shapiro SS, et al. Embryonic stem cell lines derived from human blastocysts. Science. 1998;282:1145–1147. doi: 10.1126/science.282.5391.1145. [DOI] [PubMed] [Google Scholar]
- Xu C, Inokuma MS, Denham J, et al. Feeder-free growth of undifferentiated human embryonic stem cells. Nat. Biotechnol. 2001;19:971–974. doi: 10.1038/nbt1001-971. [DOI] [PubMed] [Google Scholar]
- Xu D, Wilson TJ, Chan D, et al. Ets1 is required for p53 transcriptional activity in UV-induced apoptosis in embryonic stem cells. EMBO J. 2002;21:4081–4093. doi: 10.1093/emboj/cdf413. [DOI] [PMC free article] [PubMed] [Google Scholar]
- Yasaka T, Ichisaka S, Katsumoto T, et al. Apoptosis involved in density-dependent regulation of rat fibroblastic 3Y1 cell culture. Cell Struct. Funct. 1996;21:483–489. doi: 10.1247/csf.21.483. [DOI] [PubMed] [Google Scholar]
- Yue Z, Jin S, Yang C, Levine AJ, Heintz N. Beclin 1, an autophagy gene essential for early embryonic development, is a haploinsufficient tumor suppressor. Proc. Natl Acad. Sci. USA. 2003;100:15077–15082. doi: 10.1073/pnas.2436255100. [DOI] [PMC free article] [PubMed] [Google Scholar]


