Abstract
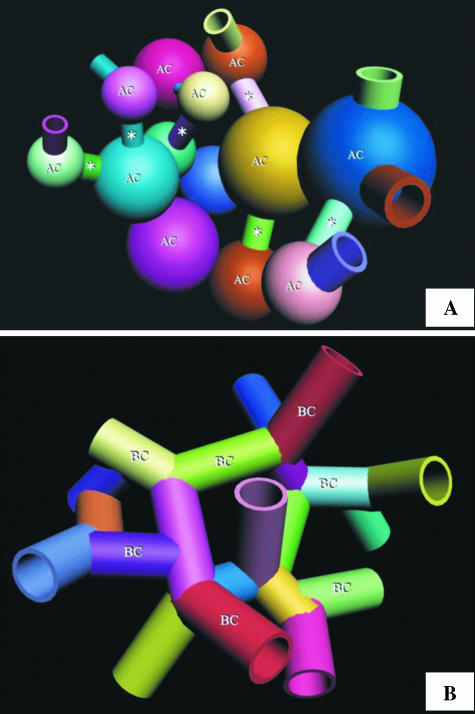
To elucidate the shape, size, and spatial arrangement and association of the terminal respiratory units of the avian lung, a three-dimensional (3D) computer-aided voxel reconstruction was generated from serial plastic sections of the lung of the adult muscovy duck, Cairina moschata. The air capillaries (ACs) are rather rotund structures that interconnect via short, narrow passageways, and the blood capillaries (BCs) comprise proliferative segments of rather uniform dimensions. The ACs and BCs anastomose profusely and closely intertwine with each other, forming a complex network. The two sets of respiratory units are, however, absolutely not mirror images of each other, as has been claimed by some investigators. Historically, the terms ‘air capillaries’ and ‘blood capillaries’ were derived from observations that the exchange tissue of the avian lung mainly consisted of a network of minuscule air- and vascular units. The entrenched notion that the ACs are straight (non-branching), blind-ending tubules that project outwards from the parabronchial lumen and that the BCs are direct tubules that run inwards parallel to and in contact with the ACs is overly simplistic, misleading and incorrect. The exact architectural properties of the respiratory units of the avian lung need to be documented and applied in formulating reliable physiological models. A few ostensibly isolated ACs were identified. The mechanism through which such units form and their functional significance, if any, are currently unclear.
Keywords: 3D reconstruction, air capillaries, birds, blood capillaries, Cairina moschata, computer, Corel Coorporation, KS300, lung, morphology, muscovy duck, voxel
‘The precise knowledge of the three-dimensional (3-D) assembly of biological structures is still in its origin’. (Kriete 1998).
Introduction
Whether by default or by design, the fundamental aim of biological research is to correlate structure and function (e.g. Jeong et al. 2000). The findings grant an understanding of how and why animals/organisms, tissues, cells, cell organelles and even molecular factors are made the way they are and function the way that they do. Additionally, an appreciation of what happens when the properties deviate from the normal is gained. Although continuously studied for well over four centuries (e.g. see Coitier, 1573), the three-dimensional (3D) morphology and the organization and arrangement of the terminal gas exchange components of the avian lung, the air capillaries (ACs) and the blood capillaries (BCs), still remain ambiguous (e.g. López et al. 1992). According to (Huxley 1882) and (Schulze 1908), the presence of an anastomosing network of minute air conduits in the avian lung, now commonly called ‘air capillaries’, was discovered by (Rainey 1849). Perceiving them to be tiny air spaces located between a network of BCs, (Rainey 1849) maintained that the ACs anastomosed profusely. (Schulze 1908) believed that (Eberth 1863) was the first person to state that the ACs (then termed ‘terminal air canals’) ended in blind dilations. (Fischer 1905) demonstrated on histological sections that the ACs actually interconnected. Notwithstanding what should have been irrefutable evidence, in subsequent years there still were skeptics such as (Krause 1922) and (Cover 1953). Whereas it is now widely acknowledged that the ACs anastomose profusely and are definitely not blind-ending tubules (e.g. Maina, 1982), their exact shape has not been fully resolved. Although in physiological modelling, of necessity, certain simplifying assumptions are not only inevitable but essential, with a clear knowledge of the shape, size and assembly of the functional respiratory units of the avian lung previously lacking, the models that have hitherto been formulated to gauge respiratory efficiency of the avian lung (e.g. Crank & Gallagher, 1978; Scheid, 1978; Hastings & Powell, 1986; Fedde et al. 1989; Shams & Scheid, 1989) are of uncertain predictive value.
At their various levels of organization, biological structures form and occupy 3D space: the ubiquitous 3D configuration has not evolved fortuitously. Shape, size and spatial arrangement of associated building blocks are fundamental attributes to function. French (1988) observed that ‘the quality of a system depends on the quality of the components which form it, as well as the excellence of its organization’. Despite the importance of understanding these properties, studies of 3D properties of many biological structures are lacking (e.g. Kriete, 1998). Alone, light and electron microscopy offer only inexact 2D details and, on their own, serial sections give very little insight into the relationships in the third dimension. The advent of computer technology allowed stereoscopic images of organisms, organs, cells and even cell organelles to be relatively easily reproduced (e.g. Perkins & Green, 1982; Latamore, 1983; Wong et al. 1983; Braverman & Braverman, 1986; Mercer & Crapo, 1988; Randell et al. 1989). Many of the other techniques that can be used to visualize the 3D properties of biological elements come with certain limitations. Scanning electron microscopy (SEM) allows only the surface profile (topology) of a structure to be viewed. Although a combination of casting and SEM offers a powerful method of studying form (e.g. Lametschwandtner et al. 1984), the foremost shortcoming of this method is that structures such as blood vessels that have to be perfused first, lose the normal shape and size that is imparted by the intraluminal blood pressure and the impact of erythrocytes. Moreover, artefacts may directly arise from extravasation of the casting material owing to use of excessive pressure or indirectly from application of insufficient pressure. The confocal laser scanning microscope (CLSM) (e.g. Pawley, 1995) provides means by which non-invasive serial optical tomography (sectioning) of intact and even living specimens can be performed (e.g. Terasaki & Dailey, 1995): CLSM allows direct acquisition, study and manipulation of serial sections of thick translucent objects, including biological materials (e.g. Shotton, 1989, 1995; Tadrous, 2002).
The main objective of this study was to prepare a 3D computer reconstruction of the components of the exchange tissue of the lung of the muscovy duck, Cairina moschata. It was anticipated that the preparation would offer instructive insights on the shape, size and arrangement of the respiratory units of the avian lung, features that are vitally important for understanding how it works. It is axiomatic that application of more precise structural details should provide exact physiological models of the avian lung. The fundamental question of whether ACs and BCs are mirror images could only be satisfactorily settled by 3D computer reconstruction, means by which the structures can be electronically separated, merged and manipulated.
Materials and methods
Fixation of the lung, tissue sampling and processing
Three adult muscovy ducks were killed by injection with Euthanase® (200 mg cm−3 pentobarbitone sodium; Centaur Laboratories) into the brachial vein (0.01 mL g−1). The lungs were immediately fixed by intratracheal instillation of 2.5% glutaraldehyde solution buffered in phosphate (osmolarity 350 mOsm L−1, pH 7.4) at a pressure head of 3 kPa (25 mmHg). The trachea was ligated and the fixative left in situ for 3 h before the lungs were carefully dissected from the deep costal attachments. Subsequently, the lungs were sliced transversely along the costal sulci at approximately 10-mm intervals. The slices were laid out flat and cut into cubes of about 2 mm3. The lumina of the parabronchi were visible as small holes running through the sampled tissue blocks. Those samples that contained parabronchi that were transversely cut were selected. Five pieces were picked from the lungs of each of the three birds. The pieces were left in 2.5% glutaraldehyde at 4 °C overnight and then post-fixed in 1% osmium tetroxide buffered in 1 mol L−1 sodium cacodylate (osmolarity 350 mOsm L−1, pH 7.4) at room temperature for 90 min. This was followed by dehydration in a series of concentrations of ethanol starting from 70% to absolute followed by two changes of propylene oxide before embedding in epoxy resin (epon/araldite).
Light microscopy: preparation of serial sections
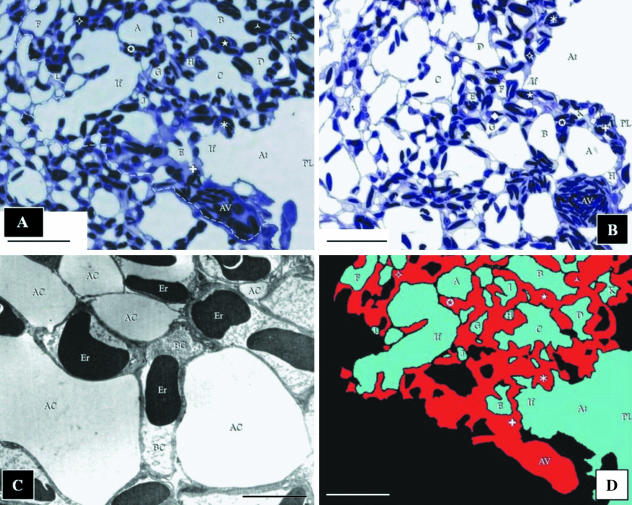
A block was randomly picked from those prepared from one of the lungs of the three specimens and 194 serial sections were cut at a thickness of 0.3 µm on a Reichert-Jung ultramicrotome using glass knives. The sections were placed on a drop of water on a glass slide using a bristle and dried on a hot plate at 70 °C for approximately 5 min, until the water evaporated. A drop of freshly filtered toluidene blue stain was placed onto the dried section and this was heated again until completely dry. The slides were carefully rinsed with running water, dried and viewed at 400×. Where staining was faint, the process was repeated until adequate contrast was achieved. After staining, cover slips were placed on the sections using DPX mountant. The sections were carefully examined to identify those with areas where most of the structures of interest (i.e. the parabronchial lumen, atria, infundibulae, air capillaries and blood vessels including blood capillaries) were adequately represented. An area measuring 174 × 219 µm, where an atrium could be seen (arising from the parabronchial lumen) giving rise to an infundibulum that generated air capillaries and where an atrial vein and blood capillaries were evident was selected for the reconstruction (Fig. 1A,B). Seventy-one sections spanning the entire thickness of an infundibulum were photographed using an Axioskop image analyser (Zeiss Instruments) at a magnification of 400× in the JPEG image format at a resolution of 1300 × 1030 pixels. In all, 11 sections were lost or damaged during sectioning and mounting. However, no more than three consecutive sections were lost. Rough alignment of the series of photographs was achieved by lining up several easily recognizable structures spanning the complete sequence.
Fig. 1.
(A) The first of the 71 images of the sections of the exchange tissue of lung of the muscovy duck, Cairina moschata, used for the reconstruction. The area that was reconstructed is located to the right of the dashed line. The parabronchial lumen (PL) gives rise to an atrium (At), which narrows to form an infundibulum (If). The surrounding parenchyma (exchange tissue) comprises ACs of variable sizes (letters) and BCs (symbols). The BCs drain into the atrial vein (AV). Scale bar, 25 μm. (B) The last section used in the reconstruction. The atrial vein (AV) appears larger in diameter than in the first section (A). This indicates that blood flows in the direction from the first to the last section, draining the BCs that lie along its length. The parabronchial lumen (PL) can be seen giving rise to an atrium (At), and an infundibulum (If). ACs are labelled using letters and BCs using symbols. Scale bar, 25 µm. (C) Transmission electron micrograph prepared to establish that for the purposes of the present study (3D reconstruction), the fixation of the lung was adequate. AC, air capillaries; BC, blood capillaries containing erythrocytes (Er). Scale bar, 5 μm. (D) The reconstructed area shown in A (at the same magnification, orientation, and with the structural components labelled identically) indicates how the air- and the vascular elements were identified and colour coded. The areas in black comprised: (a) ACs (in the construction) of which the continuity to the parabronchial lumen could not be established, (b) of parts (outside of the reconstruction) that fell outside of the limit of the reconstructed part, and (c) the tissue barrier and the BCs not containing erythrocytes and blood plasma. These regions were not included in the reconstruction. Colour coding: blue, air spaces; red, blood. Scale bar, 25 μm.
Transmission electron microscopy
To understand better the structure of the ACs and BCs and to establish that the fixation was adequate, the area to be reconstructed was identified from images prepared from the semithin sections and the block face appropriately trimmed. Ultrathin sections were cut at 100 nm (gold/silver) thickness, mounted on 200-wire mesh carbon-coated copper grids, and stained with uranyl acetate and lead citrate. Photographs were taken with a Jeol JEM-100S transmission electron microscope at an accelerating voltage of 80 kV (Fig. 1C). The primary magnifications ranged from 2000 to 5000×.
Computer reconstruction
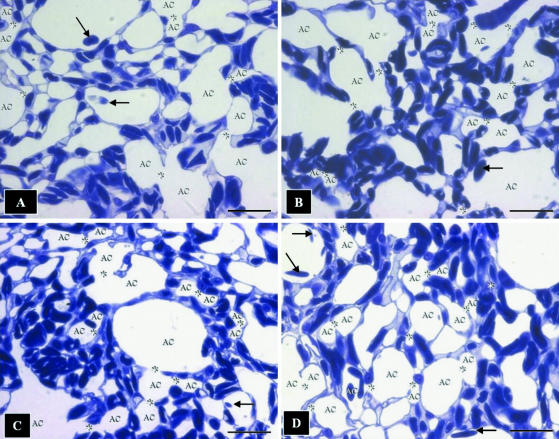
A commonly available computer graphics program – Corel Photopaint V.08® (Corel Corporation) – was used for 3D reconstruction. The photographs were coloured (Fig. 1D) using the Paintbrush Tool in Photopaint. The air-conducting elements (atrium, infundibulum and ACs) were identified and before colouring checked for connection to the parabronchial lumen. The process involved changing backwards and forwards through the entire sequence of images and colouring every air-conducting element that was connected to the parabronchial lumen. The systematic process was vital to ascertaining correct classification of the air- and blood-conducting structures. On the one hand, in a few cases, ACs contained extravasated erythrocytes and blood plasma (Fig. 2A–D) whereas on the other, in rarer cases, some BCs did not contain erythrocytes or blood plasma. In the first case, it was only by ensuring that the structures were continuous with the other air-conducting elements that they could be assigned correct identity – and not be confused for BCs. The BCs were firstly recognized from the presence of erythrocytes and/or plasma within them and secondly by the process of elimination, i.e. after the ACs were absolutely identified. Nevertheless, in rare cases, a few structures could not be unequivocally assigned to either ACs or BCs. These were left blank, i.e. they were not coloured (Fig. 1D). At the magnification used (×400), the tissue barrier separating one BC from another could not be clearly resolved: where this was the case, adjacent BCs were coloured as being continuous with one another. The process of identifying and colouring the structures conferred a particular advantage of not requiring hard copies of the sections to be reconstructed. Every step from image acquisition to the final production of the reconstruction was digital. This meant that once digital images of the sections were acquired, the entire process of editing the pictures, defining the area of interest, aligning the sections and producing the final reconstruction could be achieved using a personal computer (PC).
Fig. 2.
Toluidine-blue-stained sections showing the complex meshwork formed by the air capillaries (AC) and the blood capillaries containing red blood cells. Arrows, extravasated erthrocytes lying in the ACs; stars, sites where the ACs connect openly or through narrow channels. It is evidently difficult to infer the 3D shape of the ACs from sectional profiles. Scale bars, 10 μm.
The coloured images were separated into image sequences by copying each image individually into a blank frame using the Avi Movie Format in Corel Photopaint. In the case of a missing section, the previous section was duplicated to close the gap. Three image sequences were generated: the first contained both the air- and blood-conducting elements, the second was produced by ‘extracting’ the blood-conducting elements, and the third was produced by removing the air-conducting elements. The coloured sequences of images were aligned by using two methods. The first, termed ‘best visual fit method’ by (Randell et al. 1989), involved rendering the section to be aligned translucent and rotating and translating it until its structures were perfectly superimposed onto those in the preceding section. The second process entailed rapidly switching the image to be aligned with the preceding one. This technique was used by (Stevens et al. 1980). It has the effect of producing a false sense of movement – a ‘movie effect’– which decreased as the fit improved. Both of these techniques were accomplished using the Animation Feature in Corel Photopaint.
The three aligned sequences were copied as greyscale images into KS300® (Zeiss Corporation) and 3D reconstructions produced using both the voxel and the alpha renderers at several different angles and at different magnifications for the three image sequences. The completed greyscale reconstructions were then manually re-coloured in Corel Photopaint to distinguish the air- and blood-conducting components. This was accomplished automatically by selecting the air-conducting elements in the image from the average difference in greyscale values between the ACs and BCs. This process was then manually corrected pixel by pixel with the Mask Tool in Corel Photopaint. Once the air-conducting elements had been isolated from the rest of the image, each greyscale value was converted into a cyan value. The process was repeated for the blood-conducting elements, which were replaced with red values. In the case of Fig. 7(B,C), this final colouring process was not undertaken and the images were left in greyscale.
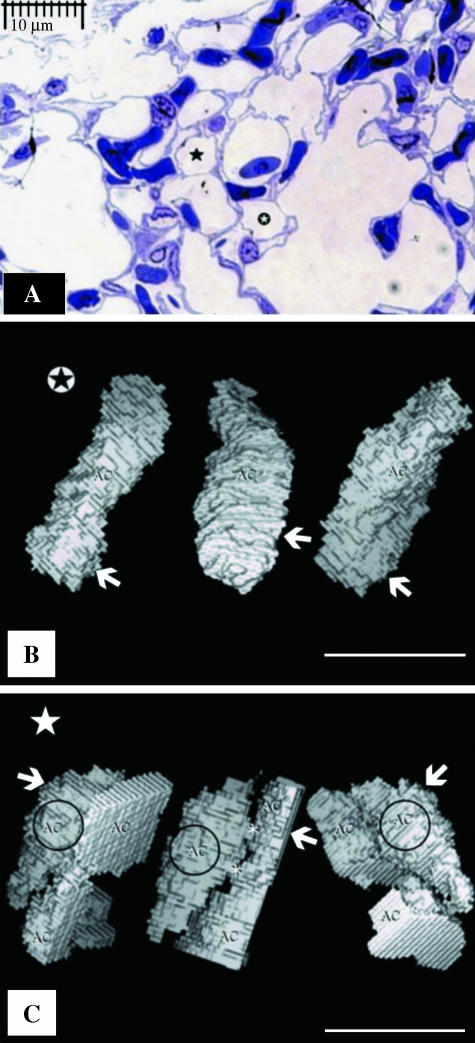
Fig. 7.
(A) View of air capillaries, one of which ( ) is isolated from the rest of the air way components of the exchange tissue while the other air capillary shown (⋆) is continuous with the rest of the air-conducting structures of the exchange tissue. The two ACs cannot be distinguished from their cross-sectional profiles. (B) Views of a voxel 3D reconstruction of supposedly isolated ACs from left to right at angles of 0°, 120° and 240° (shown in panel A,
  ). The arrows indicate the level at which the section in A originates. (C) Voxel reconstruction of the non-isolated (connected) air capillary (circled) from left to right at angles of 0°, 120° and 240° (shown in A, ⋆). The arrows indicate the level at which the section in A originates. Asterisks, narrow air-filled tubes that connect the ACs (see Fig. 9A).
Quantitative measurements
The ratio of the volume density of the ACs to the volume density of BCs was determined by calculating the mean surface area ratio of Acs to BCs. This was made by defining an area on each section that contained only the ACs and BCs. The number of pixels, defined by colouring as BCs and those defined as ACs, were counted. The adequacy of the sections analysed was determined by plotting a summation average graph. The number of pixels were counted using Corel Photopaint and their adequacy was checked against a standard normogram (Weibel, 1979, p. 114) for a standard error of the mean (SEM) of less than 1%. Over two million pixels were counted in 60 sections to obtain a reliable estimate of the relative volumes of the ACs and the BCs in the particular area of the reconstruction. Because of the relatively small volume occupied by the tissue barrier, the standard error associated with colouring these structures at the magnification used (×400) was deemed to be too large to obtain reliable estimates of the volume density of these structures.
In the course of colouring and checking the interconnections of the air-conducting elements, it became evident that some of the ACs appeared to be detached from the parabronchial lumen, atria and infundibulae: four such structures were identified in the area of reconstruction. One such apparently isolated AC was followed over a series of 44 sections and a 3D reconstruction made. After rotation, the maximum length, maximum width and minimum width were estimated. Each measurement was repeated ten times and the mean and SEM for each length were calculated. The volume of the AC was determined by multiplying the volume of a single voxel by the total number of voxels contained in the structure.
Confocal laser scanning microscopy (CLSM)
Three-dimensional reconstruction from optically generated histological sections by CLSM was performed. Briefly, samples of lung tissue that had been fixed in glutaraldehyde and embedded in paraffin wax were used. Four serial sections were prepared using a Reichert Jung microtome at a thickness of 10 µm and mounted using a polyvinylpyrrolidone (PVP) aqueous mounting medium as described by Kiernan (1997): 0.5 mm ascorbic acid was added as an anti-fading agent. The tissue was optically sectioned at 0.5 µm using a Zeiss CLSM (CLSM 410) at 400× magnification. Autoflorescence of the lung tissue combined with florescence of the glutaraldehyde fixative was deemed sufficient to produce adequate images. Three image stacks were produced, each consisting of 17 images; these were saved as 1024 × 1024-pixel greyscale images in Tagged Image File Format (TIFF). A voxel rendering of one of the image stacks was produced using Zeiss CLSM software.
Results
Air-conducting elements
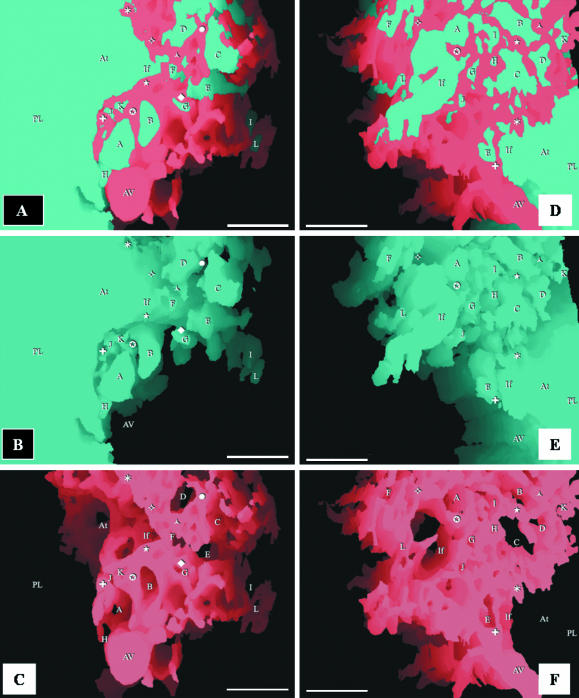
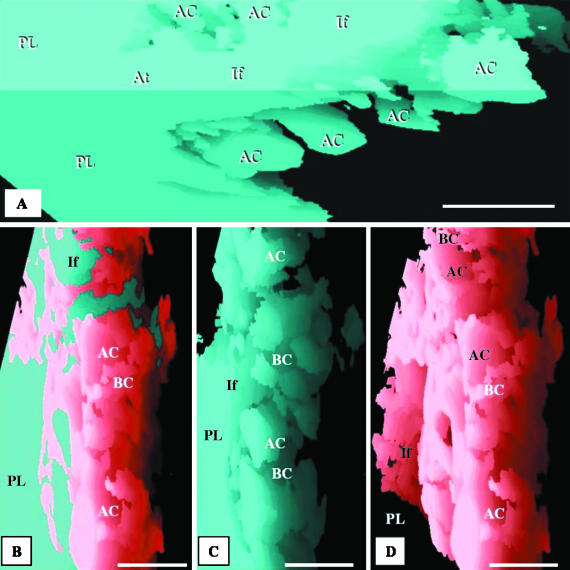
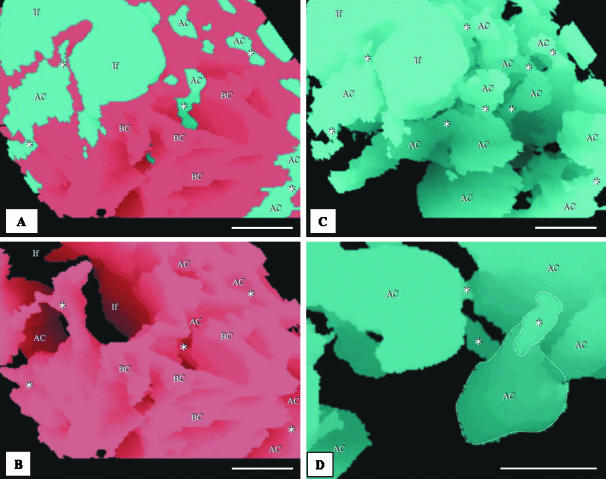
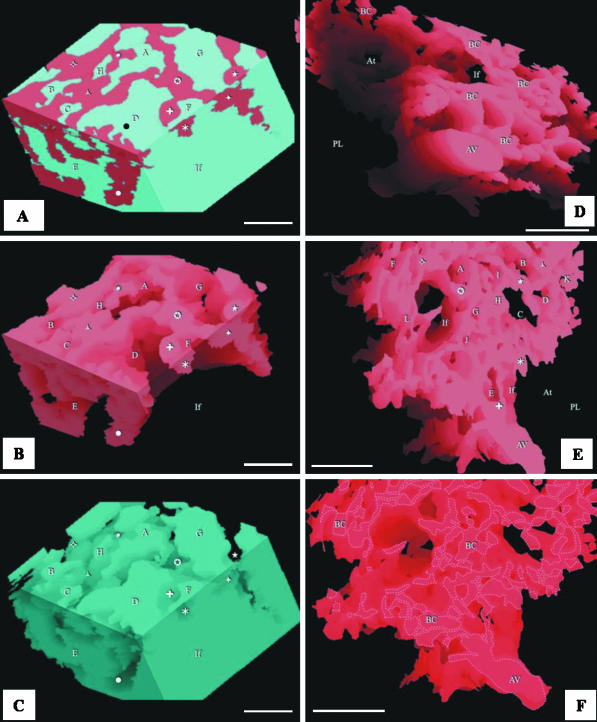
At the level of the parabronchus (tertiary bronchus), the parabronchial lumen opens into the atria, the atria give rise to infundibulae and the infundibulae in turn generate ACs (Figs 3A–F and 4A). The ACs that are located closer to the infundibulae are larger and anastomose less frequently than those that lie further away (Figs 3B,E and 4A). The ACs themselves are heterogeneous, rather rotund structures that vary greatly in size and shape in different locations of the exchange tissue (Figs 4B–D and 5A–D). They interconnect by short, narrow channels (Fig. 5C,D). Although the ACs and BCs anastomose profusely and intertwine intimately, the two respiratory units are not mirror images (Fig. 6A–C).
Fig. 3.
Respective views of combined, airway and vascular reconstructions. The labelling is identical in each of the three sequential figures (A–C and D–F) to show the topographical locations of the same structures. The parabronchial lumen (PL) can be seen giving rise to an atrium (At), which narrows to form an infundibulum (If). The exchange tissue (parenchyma) is composed of ACs (letters) and BCs (symbols). The BCs can be seen draining into an atrial vein (AV). All scale bars, 25 μm.
Fig. 4.
(A) Reconstruction of the air-conducting system showing a parabronchial lumen (PL) giving rise to an atrium (At), which forms an infundibulum (If) that in turn gives rise to the air capillaries (AC). Scale bar, 25 μm. (B–D) Respective side views of the combined, airway and vascular reconstructions of the components of the exchange tissue of the lung of the muscovy duck, Cairina moschata. PL, parabronchial lumen; If, infundibulum; AC, air capillaries; BC, blood capillaries. Scale bars, 20 μm.
Fig. 5.
(A,B) Integrated (combined) reconstruction of the blood vessels (red) and airways (blue) (A) and that of the vasculature (B): the area of the reconstruction is close to the parabronchial lumen. The labelling is similar in order to show the topographic locations of the same structures. AC, air capillaries; BC, blood capillaries; If, infundibulae; stars, points at which ACs interconnect. Evidently, the ACs and BCs are not mirror images. Scale bar, 10 µm. (C,D) Structure of the air capillaries (AC). The ACs are heterogeneous, rather rotund structures that anastomose openly or via narrow tubules (stars). The spaces between the ACs are almost completely filled by BCs. If, infundibulum. In D, an air capillary (AC) and an interconnection (star) are delineated with dashed lines. scale bars: C, 20 µm; D, 10 µm.
Fig. 6.
(A–C) Respective views of combined, airway and vascular reconstructions close to the infundibulum. The labelling of the BCs (symbols) and the ACs (letters) is similar to show the topographical locations of the same structures. The infundibulum (If) gives rise to ACs. Scale bars, 10 μm. (D) Vascular reconstruction close to the parabronchial lumen showing an atrial vein (AV) and blood capillaries (BC). PL, parabronchial lumen; If, infundibulum; At, atrium. Scale bar, 25 μm. (E) Spaces for ACs (letters) and some BCs (symbols). PL, space for parabronchial lumen; At, space for an atrium; If, space for an infundibulum. Scale bar, 25 μm. (F) Blood capillaries (BC) and atrial vein (AV) are outlined to highlight the intensity of vascular anastomoses. Scale bars, 25 μm.
Blood-conducting elements
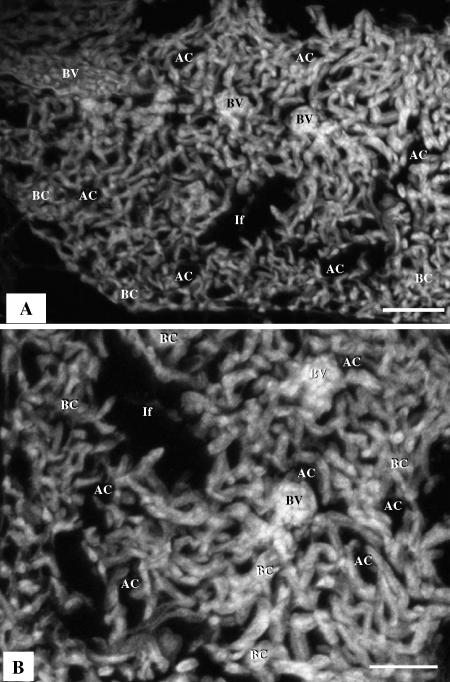
The meshwork of BCs in the periparabronchial exchange tissue empty into the atrial veins that are located close to the parabronchial lumen (Figs 1A,B,D and 3A,C–D). The BCs are made up of a meshwork of interconnected segments that are approximately as long as they are wide and anastomose more regularly than the ACs (Figs 3A–F, 6A–F and 8A,B).
Fig. 8.
(A) Three-dimensional reconstruction based on 17 serial sections generated by confocal laser scanning microscopy (CLSM), showing blood vessels (BV), air capillaries (AC), tubular, interconnected blood capillaries (BC) and infundibulae (If). Scale bars 50 µm. (B) A single optical section produced by CLSM; the BCs are sausage-like in shape while the ACs (air spaces) are saccular: the gas exchange units are not mirror images.
Spatial association between the ACs and the BCs
The ACs and BCs intertwine intimately in three dimensions (Figs 3A,D, 4B, 5A and 6A). In the area of the exchange tissue that was reconstructed, the volume proportion of the BCs (44.6%) was about 11% less than the volume of ACs (55.4%). However, the value for the BCs may have been slightly overestimated because the tissue not involved in gas exchange, i.e. the tissue separating adjacent BCs, was not distinguishable from the lumina of the BCs themselves and was hence included in the estimate.
Isolated ACs
As far as we can tell, from the limitations of our methods, there appear to be some ACs for which connection to the infundibulum, the atrium and the parabronchus could not be unequivocally established. Four such air spaces were reconstructed in the study area. It is impossible to discriminate between isolated and non-isolated ACs by examination of their cross-sectional profiles (Fig. 7A). The detached ACs that were identified in this study (e.g. Fig. 7B) had the same 3D shape and size as the connected ACs from the same region (Fig. 7C). The dimensions of the isolated AC that was reconstructed (Fig. 7B) were: length, 6.5 ± 0.050 µm; diameter, 15 ± 0.044 µm (mean ± SEM); and volume, 140 µm3.
Discussion
Our attempt to elucidate the 3D configuration of the terminal respiratory units of the avian lung by CLSM (Fig. 8A) to a meaningful extent helped clarify that the Acs and BCs are not mirror images: the BCs were seen to be rather anastomosing sausage-like structures that are conspicuously different from the ACs, which are saccular air spaces (Fig. 8B).
In the present study, the voxel or cuberille model was chosen to estimate volumes. A voxel model comprises 3D pixels which are stacked together to form a virtual model. This method was combined with tracing of profiles, a technique commonly associated with production of vector reconstructions. After sectioning, it is necessary that the sections are correctly aligned. Realignment marks or fiducial marks were not introduced into the tissue before sectioning. This was because of the practical difficulty of correctly introducing such marks into the very small tissue samples that were processed and sectioned. Instead, intrinsic features of the structural components were used as coordinates in the realignment process. Techniques of physically overlaying frames and of rapidly changing between frames to produce an illusion of movement (‘movie effect’) have been used by Levinthal & Ware (1972), Rakic et al. (1974), Stevens et al. (1980) and Braverman & Braverman (1986). Both methods were utilized in this study in order to exploit the benefits that are inherent in each.
Precise identification of the profiles of the air- and blood-conducting elements was of utmost importance for successful 3D reconstruction. Mistaking an air-conducting component for a blood-conducting component or vice versa had the potential of distorting the reconstruction and hence making it less meaningful. Because the atria, the infundibulae and the ACs develop by projection (evagination) from the parabronchial lumen (Maina, 2003), the air-conducting elements should by design connect (open) to the lumen. By carefully moving backwards and forwards through the series of images, the continuity of the air-conducting components could be established and the structures accurately identified. Normally containing blood plasma and erythrocytes, the BCs were more easily identifiable. Within the series of sections and the part reconstructed, not all the ACs were continuous with the parabronchial lumen. If one of these structures contained blood plasma and/or erythrocytes, it could have been easily incorrectly identified as a BC. Because of the rarity of the ACs that were not evidently continuous with the parabronchial lumen (via the atria and the infundibulae) within the reconstructed area and occurrence of those containing extravasated erythrocytes and plasma, it is highly unlikely that even a single AC was incorrectly documented. Because the shape of the ACs is quite different from that of the BCs, if any ACs were incorrectly identified, it would have been reflected as conspicuous distortion in the final 3D reconstruction.
At the primary magnification used to photograph the sections, the tissue barrier did not form a distinct line demarcating the borders of the ACs and BCs. For the purpose of the reconstruction, a line had to be drawn indicating the position of this border. The exact position where the discriminating line was drawn was to a certain extent arbitrary. This, however, did not have a significant effect on the consequent reconstruction because the difference between the furthest and nearest possible positions of the line in any AC or BC was only in the range of a few pixels. Furthermore, the indistinct tissue barrier resulted in adjacent BCs being coloured as being continuous with one another. This may have resulted in spurious shapes being obtained for these structures. However, we believe that this has not been the case; the open meshwork structure of the BCs results in few BCs lying adjacent to one another and the structures obtained broadly resemble those achieved by freeze fracture of tissue, corrosion casting and the CLSM images produced in this study. An attempt to use a colour-similarity algorithm was unsuccessful because the staining density of the tissue barrier was not uniform throughout all the sections.
During the processes of fixation, preparation and sectioning of the tissues, artefactual dimensional changes inevitably occur (e.g. Machin et al. 1996). These changes include shrinkage of the tissue, shortening of the section by compression, and folding or shearing of the tissue during mounting. Folding and shearing of the tissue is a major problem only when a large area relative to the size of the section is reconstructed. If the area to be reconstructed constitutes a small proportion of the total size of the section, microalignment of the area of interest reduces the distortions (e.g. Stevens et al. 1980). Shrinkage of the tissue during processing and shortening of the ribbon during sectioning do not affect volume density estimates because all the structures in the tissue are affected to the same extent. Likewise, because shrinkage should be isometric, the shapes of the structures that are reconstructed are not significantly affected. Compression of the ribbon, however, should result in shortening of the reconstruction along one dimension and should be evident as a ‘squashed’ effect. In this study, the sections were straightened by placing them on a drop of water followed by heating of the water on a hot plate. Inflexibly wrinkled sections were discarded. It would appear that the process was satisfactory, as no distortion was perceivable in the 3D reconstruction.
Comparisons with previous findings
Morphological and morphometric studies have now been carried out on a large number of avian species (e.g. Dubach, 1981; Vidyadaran, 1987; Maina et al. 1989; Maina & Nathaniel, 2001). However, clear understanding of the geometry of the terminal respiratory units of the avian lung is still lacking. Without precise data on the shape, size, and manner in which the ACs and BCs are organized in three dimensions, the physiological models that have been formulated on assumed morphological specifications will continue to be of questionable value and limited practical utility.
Interpreted correctly, the shapes of the ACs and BCs produced by corrosion casting by, for example, Fujii et al. (1981) and (Maina 1982, 1988) and those obtained by 3D computer reconstruction in this study are reasonably similar (Figs 5C,D and 9A,B). The diameter of the BC segments is equal or slightly exceeds the length (Figs 6E,F and 9B). This design supports the concept of ‘sheet flow’ of blood (e.g. Fung & Sobin, 1972) that is envisaged to occur in many, if not all, gas exchangers (Maina, 2000). In the exchange tissue of the avian lung, the size and the arrangement of the BCs (Figs 6D,F and 9B) fundamentally differ from the classical form of a ‘long and loose connection’, e.g. that presented in the skeletal muscle (e.g. Mathieu-Costello et al. 1992), to an extent at which the term ‘blood capillary’ may anatomically be inappropriate.
Fig. 9.
(A) Schematic diagram of the air capillaries (AC) shown as rather rotund, heterogeneous structures that connect through narrow conduits (stars). (B) Schematic diagram of the blood capillaries (BC) shown forming a network of interconnected segments, the lengths and the diameters of which are approximately equal.
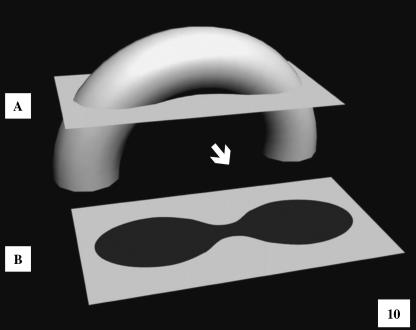
Modelling of gas exchangers (e.g. Weibel, 1970/71; Maina et al. 1989; Maina, 1989, 1998) gives useful insights into the adaptive and evolutionary mechanisms by which the respiratory processes are functionally optimized. In the avian lung, physiological models have been formulated on implicit morphological data. For example, Scheid (1978), Crank & Gallagher (1978), Powell (1982) and Shams & Scheid (1989) assumed that both the ACs and BCs were straight, blind-ended, non-branching tubules of which the cross-sectional area was invariant along their entire length. From examination of the vascular casts of the BCs, Brackenbury & Akester (1978) extrapolated that the ACs and BCs were mirror images. Our observations here show that the actual forms and configurations of the terminal respiratory units of the avian lung fundamentally differ from that assumption. (Maina 1982, 1988) showed that the ACs and BCs anastomose profusely, intertwine and form a complex meshwork. The respiratory units differ in shape and size and at any one point contact over very short distances. In this study, the ACs were seen to be rather spherical structures that connected through narrow conduits (Fig. 9A). The value of 3D reconstruction in discerning the true form of biological structures from 2D (sectional) profiles was evidenced by the fact that the delineations of the ACs (seen in Fig. 2A–D) could have potentially emanated from tubular structures (Fig. 10) and erroneously interpreted as such. It is only by 3D reconstruction that the actual form and the narrow interconnections of the ACs could be discerned. The observed shapes of the ACs and BCs may help answer some physiological questions that hitherto were difficult to explain. Without attributing it to particular structural features, Scheid (1978) observed that ‘during exercise, the diffusional resistance inside the air capillaries may become limiting for the over-all gas exchange’. It is conceivable that the ‘constrictions’, i.e. the narrow interconnections between the ACs, which are as small as 1–3 µm in diameter, may become significant sites of diffusional resistance, especially during intense metabolic activity, particularly at maximum oxygen consumption (VO2max), a state when oxygen demands are highest. Taking into consideration that the avian lung is practically rigid – it changes in volume between respiratory cycles by a mere 1.4% (Jones et al. 1985) – it is unlikely that the ACs substantially change in size between the two phases. In that regard, the narrow intercapillary connections reported in this study are likely to be permanent structural features of the exchange tissue of the avian lung. Although it may be totally fortuitous that the shape of the ACs resembles that of alveoli of the avian lung in that both are essentially spherical, the design could be a consequential feature for optimizing on available space and generating large respiratory surface area and possibly relatively more stable respiratory units. Such an evolutionary convergence is plausible in the lungs of two vertebrate endothermic-homiotherms, birds and mammals, animals with high metabolic capacities and extreme oxygen demands.
Fig. 10.
Schematic diagram illustrating one of the difficulties inherent in attempting to deduce the 3D shape of the ACs from cross-sectional profiles. When tubular structures are transected as shown in A, they generate profiles like those seen in B (see Fig. 2A–D). Only by 3D reconstruction can the exact 3D perspective of the ACs be visualized.
Isolated air capillaries
Putative isolated ACs were identified in the area of 3D reconstruction. Unexpectedly, the structures were discovered by accident through a painstaking process that was applied to identify the ACs, by systematically checking the continuity of the airway system. The foremost facts that were considered before the ACs were inferring to be isolated are as follows: (a) four apparently discrete ACs were identified; (b) in four cases, no connections to other ACs were observed, even after the units were rotated; (c) with the section thickness being 0.3 µm and the diameter of the connections exceeding 1 µm, it was considered improbable that a connection could have been be missed – theoretically, a minimum of three sections would have had to be lost, i.e. a thickness of 0.9 µm, for an interconnection to be missed.
Isolated ACs have not been reported before in the avian lung. This is mainly because detached and connected ACs cannot be discriminated from observations of cross-sectional profiles that are generated by sectioning 3D structures and examination by light and electron microscopes (Fig. 7A) or visualization of casts by scanning electron microscopy. If our observation is corroborated by other investigators, it will raise fundamental questions both on the development and on the function of the avian lung. As the ACs form by projection of the atria, the infundibulae and the ACs into the exchange tissue (Maina, 2003), it is unclear how such units become isolated and the means by which their stability is maintained. The avian lung is reportedly exceptionally strong: Macklem et al. (1979) observed that mechanical compression of the lung did not cause appreciable collapse of the ACs. It is conceivable that the 3D arrangement of the ACs in the exchange tissue, where globular respiratory units are anchored to each other across strut-like interconnections (Fig. 9A) and where BCs compactly fill the interstices (Fig. 9B), may constitute stable engineering that could explain the stability of the ACs in particular and the lung in general. It would be interesting to establish what role(s), if any, the remote ACs may play in imparting strength to the avian lung. Because no meaningful gas exchange can possibly occur in them as they are not ‘ventilated’, the presence of isolated ACs would indicate a certain degree of redundancy in the design of the lung. Should detached ACs be confirmed to occur in the avian lung in significant numbers, it would call for revision particularly of the previous morphometric estimations of parameters such as the respiratory surface area and the volume densities of the components of the exchange tissue. This aspect offers an interesting area for future research.
Conclusions
Different investigators have attributed various kinds of shapes and associations to the terminal respiratory units of the avian lung, the ACs and the BCs. Lack of clear 3D visualization of these structures has led to formulation of physiological models based on inexact morphologies. Rather that being straight, non-branching, blind-ended tubules, the ACs and BCs anastomose profusely and intertwine to form a complex meshwork. The ACs are rounded structures that interconnect via short, narrow tubules, and the BCs consist of short coupled segments the diameters and lengths of which are about the same. Although a study based on a single species should be treated with a certain degree of caution, the techniques and the observations made here are novel and provocative. We believe that they will prompt further inquiry, advance the understanding of the functional design of the avian lung and provide new morphological data that should be useful in formulating exact physiological models. The prospect of occurrence of isolated ACs in large numbers calls for further inquiry.
Acknowledgments
We wish to thank Mr R. Tseki, Mrs S. Rodgers, Mrs A. Mortimer, Dr H. P. Brunhubner, Mrs C. Lalkhan and Ms P. Sharpe for their excellent technical assistance. This work was funded by a University of the Witwatersrand, Faculty of Health Sciences Research Committee Grant.
References
- Brackenbury JH, Akester AR. A model of the capillary zone of the avian tertiary bronchus. In: Piiper J, editor. Respiratory Function in Birds, Adult and Embryonic. Berlin: Springer; 1978. pp. 125–128. [Google Scholar]
- Braverman MS, Braverman IR. Three-dimensional reconstructions of objects from serial sections using a microcomputer graphics system. J. Invest. Dermatol. 1986;86:290–294. doi: 10.1111/1523-1747.ep12285445. [DOI] [PubMed] [Google Scholar]
- Coitier V. Externum et internarum praecipalium humani corporis partium tabulae arque anatomicae exercitationes. Nuremberg: [(1573 cit by Campana 1875)]. Anatomica avium. [Google Scholar]
- Cover MS. Gross and microscopic anatomy of the respiratory system of the turkey. II. The larynx, trachea, syrinx, bronchi, and lungs. Am. J. Vet. Res. 1953;14:230–238. [PubMed] [Google Scholar]
- Crank WD, Gallagher RR. Theory of gas exchange in the avian parabronchus. Respir. Physiol. 1978;22:9–25. doi: 10.1016/0034-5687(78)90037-3. [DOI] [PubMed] [Google Scholar]
- Dubach M. Quantitative analysis of the respiratory system of the house sparrow, budgerigar and violet-eared hummingbird. Respir. Physiol. 1981;46:43–60. doi: 10.1016/0034-5687(81)90067-0. [DOI] [PubMed] [Google Scholar]
- Eberth CJ. Ueber den feineren Bau der Lunge. Z. wiss. Zool. 1863;12:427–454. [Google Scholar]
- Fedde MR, Orr JA, shams H, Scheid P. Cardiopulmonary function in exercising bar-headed geese during normoxia and hypoxia. Respir. Physiol. 1989;77:239–262. doi: 10.1016/0034-5687(89)90010-8. [DOI] [PubMed] [Google Scholar]
- Fischer HI. Vergleichende anatomische Untersuchungen über den Bronchialbaum der Vögel. Zool. Stuttgart. 1905;19:1–46. [Google Scholar]
- French R. Invention and Evolution Design in Nature and Engineering. Cambridge: Cambridge University Press; 1988. [Google Scholar]
- Fujii S, Tamura R, Okamoto T. Microarchitecture of the air capillaries and blood capillaries in the respiratory area of the hen's lung examined by electron microscopy. Jap. J. Vet. Sci. 1981;43:83–88. doi: 10.1292/jvms1939.43.83. [DOI] [PubMed] [Google Scholar]
- Fung YC, Sobin SS. Elasticity of the pulmonary alveolar sheet. Circ. Res. 1972;30:451–469. doi: 10.1161/01.res.30.4.451. [DOI] [PubMed] [Google Scholar]
- Hastings RH, Powell FL. Physiological dead space and effective parabronchial ventilation in ducks. J. Appl. Physiol. 1986;60:85–91. doi: 10.1152/jappl.1986.60.1.85. [DOI] [PubMed] [Google Scholar]
- Huxley TH. On the respiratory organs of Apteryx. Proc. Zool. Soc., Lond. 1882;1882:560–569. [Google Scholar]
- Jeong H, Tombor B, Albert R, Oltval ZN, Barabási AL. The large-scale organization of metabolic networks. Nature. 2000;407:651–654. doi: 10.1038/35036627. [DOI] [PubMed] [Google Scholar]
- Jones JH, Effmann EL, Schmidt-Nielsen K. Lung volume changes during respiration in ducks. Respir. Physiol. 1985;59:15–25. doi: 10.1016/0034-5687(85)90014-3. [DOI] [PubMed] [Google Scholar]
- Kiernan JA. Making and using aqueous mounting media. Microsc. Today. 1997;97:16–17. [Google Scholar]
- Krause R. Mikroskopische Anatomie der Wirbeltiere in Einzeldarstellungen. II. Vögel und Reptilien. Berlin: De Gruyter; 1922. [Google Scholar]
- Kriete A. Form and Function of Mammalian Lung: Analysis by Scientific Computing. Berlin: Springer-Verlag; 1998. [DOI] [PubMed] [Google Scholar]
- Lametschwandtner A, Lametschwandtner U, Weiger T. Scanning electron microscopy of vascular corrosion casts – Technique and applications. Scan. Electron Microsc. 1984;2:663–695. [PubMed] [Google Scholar]
- Latamore GB. Creating 3-D models for medical research. Computer Graphics World. 1983;5:31–38. [Google Scholar]
- Levinthal C, Ware R. Three-dimensional reconstruction from serial sections. Nature. 1972;236:207–209. [Google Scholar]
- López JE, Gómez E, Sesma P. Anatomical study of the bronchial system and major blood vessels of the chicken lung (Gallus gallus) by means of a three-dimensional scale model. Anat. Rec. 1992;234:240–248. doi: 10.1002/ar.1092340210. [DOI] [PubMed] [Google Scholar]
- Machin GA, Spencer GH, Ongaro I, Murdoch C. Computer graphic three-dimensional reconstruction of normal human embryo morphogenesis. Anat. Embryol. 1996;194:439–444. doi: 10.1007/BF00185991. [DOI] [PubMed] [Google Scholar]
- Macklem PT, Bouverot P, Scheid P. Measurement of the distensibility of the parabronchi in duck lungs. Respir. Physiol. 1979;38:23–35. doi: 10.1016/0034-5687(79)90004-5. [DOI] [PubMed] [Google Scholar]
- Maina JN. A scanning electron microscopic study of the air- and blood capillaries of the lung of the domestic fowl (Gallus domesticus) Experientia. 1982;35:614–616. doi: 10.1007/BF02327080. [DOI] [PubMed] [Google Scholar]
- Maina JN. Scanning electron microscopic study of the spatial organization of the air- and and blood conducting components of the avian lung. Anat. Rec. 1988;222:145–153. doi: 10.1002/ar.1092220206. [DOI] [PubMed] [Google Scholar]
- Maina JN. Morphometrics of the avian lung. In: King AC, McLelland J, editors. Form and Function in Birds. Vol. 4. London: Academic Press; 1989. pp. 307–368. [Google Scholar]
- Maina JN, King AS, Settle G. An allometric study of pulmonary morphometric parameters in birds, with mammalian comparisons. Phil. Trans. R. Soc. Lond. 1989;326:1–57. doi: 10.1098/rstb.1989.0104. [DOI] [PubMed] [Google Scholar]
- Maina JN. The Gas Exchangers: Structure, Function, and Evolution of the Respiratory Processes. Berlin: Springer-Verlang; 1998. [Google Scholar]
- Maina JN. Is the sheet flow design a ‘frozen core’ (a Bauplan) of the gas exchangers? Comparative functional morphology of the respiratory microvascular systems: illustration of the geometry and rationalization of the fractal properties. Comp. Biochem. Physiol. A. 2000;126:491–515. doi: 10.1016/s1095-6433(00)00218-x. [DOI] [PubMed] [Google Scholar]
- Maina JN, Nathaniel C. A quantitative study of the lung of an ostrich, Struthio camelus. J. Exp. Biol. 2001;204:2313–2330. doi: 10.1242/jeb.204.13.2313. [DOI] [PubMed] [Google Scholar]
- Maina JN. A systematic study of the development of the airway (bronchial) system of the avian lung from days 3–26 of embryogenesis: a transmission electron microscopic study on the domestic fowl, Gallus gallus variant domesticus. Tissue Cell. 2003;35:375–391. doi: 10.1016/s0040-8166(03)00058-2. [DOI] [PubMed] [Google Scholar]
- Mathieu-Costello O, Szewczak JM, Logemann RB, Agey PJ. Geometry of blood-tissue exchange in bird flight muscle compared with bat hindlimb and rat soleus muscle. Am. J. Physiol. 1992;262:R955–R965. doi: 10.1152/ajpregu.1992.262.6.R955. [DOI] [PubMed] [Google Scholar]
- Mercer RR, Crapo JD. Structure of the gas exchange region of the lungs determined by three-dimensional reconstructions. In: Gardner DE, Crapo JD, Massaro EJ, editors. Toxicology of the Lung. New York: Raven Press; 1988. pp. 43–70. [Google Scholar]
- Pawley J, editor. Handbook of Biological Confocal Microscopy. New York: Plenum Press; 1995. [Google Scholar]
- Perkins WJ, Green RJ. Three-dimensional reconstruction of biological sections. J. Biomed. Eng. 1982;4:37–43. doi: 10.1016/0141-5425(82)90024-3. [DOI] [PubMed] [Google Scholar]
- Powell FL. Diffusion in avian lungs. Fed. Proc. 1982;41:53–55. [PubMed] [Google Scholar]
- Rainey G. Structure of the exchange tissue of the bird lung. Mrd.- Chir. Trans., Glasgow. 1849;32:47–87. doi: 10.1177/095952874903200105. [DOI] [PMC free article] [PubMed] [Google Scholar]
- Rakic P, Stensas LJ, Sayre EP, Sidman L. Computer-aided three-dimensional reconstruction and quantitative analysis of cells from serial electron microscopic montages of foetal monkey brain. Nature. 1974;250:31–35. doi: 10.1038/250031a0. [DOI] [PubMed] [Google Scholar]
- Randell SH, Mercer RR, Young SL. Postnatal growth of pulmonary acini and alveoli in normal and oxygen-exposed rats studied by serial section reconstruction. Am. J. Anat. 1989;186:55–68. doi: 10.1002/aja.1001860105. [DOI] [PubMed] [Google Scholar]
- Scheid P. Analysis of gas exchange between air capillaries and blood capillaries in avian lungs. Respir. Physiol. 1978;33:27–49. doi: 10.1016/0034-5687(78)90098-1. [DOI] [PubMed] [Google Scholar]
- Schulze FE. Die Lungen des Afrikanischen Strausses. S.-B. preuss.Akad. Wiss., Berlin. 1908;1908:416–431. [Google Scholar]
- Shams H, Scheid P. Efficiency of parabronchial gas exchange in deep hypoxia: measurements in the resting duck. Respir. Physiol. 1989;77:135–146. doi: 10.1016/0034-5687(89)90001-7. [DOI] [PubMed] [Google Scholar]
- Shotton DM. Confocal scanning optical microscopy and its applications for biological specimens. J. Cell Sci. 1989;94:175–206. [Google Scholar]
- Shotton DM. Electronic light microscopy: present capabilities and future prospects. Histochem. Cell Biol. 1995;104:97–137. doi: 10.1007/BF01451571. [DOI] [PubMed] [Google Scholar]
- Stevens JK, Davis TL, Friedman N, Sterling P. A systematic approach to reconstructing microcircuitry by electron microscopy of serial sections. Brain Res. Rev. 1980;2:265–293. doi: 10.1016/0165-0173(80)90010-7. [DOI] [PubMed] [Google Scholar]
- Tadrous PJ. Methods for imaging the structure and function of living tissues and cells. 2002 doi: 10.1002/1096-9896(200008)191:4<345::AID-PATH696>3.0.CO;2-R. Copyright© 1999–2003 (Dr. P.J. Tadrous), http://www.blialith.com. [DOI] [PubMed]
- Terasaki M, Dailey ME. Confocal microscopy of living cells. In: Pawley J, editor. Handbook of BiologicalConfocal Microscopy. New York: Plenum; 1995. pp. 327–344. [Google Scholar]
- Vidyadaran MK. Quantitative observations on the pulmonary anatomy of the domestic fowl and other ground-dwelling birds. Malaysia: PhD thesis, University of Pertanian; 1987. [Google Scholar]
- Weibel ER. Morphometric estimation of pulmonary diffusion capacity. I. Model and method. Respir. Physiol. 1970–71;11:54–75. doi: 10.1016/0034-5687(70)90102-7. [DOI] [PubMed] [Google Scholar]
- Weibel ER. Stereological Methods, Vol. 1 Practical Methods for Biological. Morphometry. London: Academic Press; 1979. [Google Scholar]
- Wong Y-MM, Thompson RP, Cobb L, Fitzharris TP. Computer reconstruction of serial sections. Computer Biomed. Res. 1983;16:580–586. doi: 10.1016/0010-4809(83)90043-5. [DOI] [PubMed] [Google Scholar]


