Abstract
The organization of the hepatic microvascular network has been widely studied in recent years, especially with regard to cirrhosis. This research has enabled us to recognize the distinctive vascular patterns in the cirrhotic liver, compared with the normal liver, which may explain the cause of liver dysfunction and failure. The aim of this study was to compare normal and cirrhotic rat livers by means of a quantitative mathematical approach based on fractal and Fourier analyses performed on photomicrographs and therefore on discriminant analysis. Vascular corrosion casts of livers belonging to the following three experimental groups were studied by scanning electron microscopy: normal rats, CCl4-induced cirrhotic rats and cirrhotic rats after ligation of the bile duct. Photomicrographs were taken at a standard magnification; these images were used for the mathematical analysis. Our experimental design found that use of these different analyses reaches an efficiency of over 94%. Our analyses demonstrated a higher complexity of the normal hepatic sinusoidal network in comparison with the cirrhotic network. In particular, the morphological changes were more marked in the animals with bile duct-ligation cirrhosis compared with animals with CCl4-induced cirrhosis. The present findings based on fractal and Fourier analysis could increase our understanding of the pathophysiological alterations of the liver, and may have a diagnostic value in future clinical research.
Keywords: corrosion casts, discriminant analysis, Fourier analysis, fractal dimensions, liver cirrhosis
Introduction
Experimentally induced cirrhosis in animal models has been a useful tool for morphofunctional studies concerning the cirrhotic liver. In particular, CCl4-induced and bile duct ligation (BDL) cirrhosis have assumed major importance during recent years.
CCl4-induced cirrhosis in the rat is a standard and reproducible experimental model (Proctor & Chatamra, 1984; Ariosto et al. 1989) and is is morphologically very similar to human cirrhosis. Within the morphological changes occurring during the induction of cirrhosis, those regarding microvascular reorganization have been widely demonstrated with the use of vascular corrosion casts (VCCs) observed by scanning electron microscopy (SEM). The original microvascular lobular organization, typical of the normal liver, is completely replaced in cirrhosis by a nodular organization of sinusoids surrounded by larger vessels running along the fibrous septa, thus forming the perinodular plexus (Gaudio et al. 1993; Onori et al. 2000).
Another experimental liver model, devised for bile duct proliferation and biliary cirrhosis induction, is common BDL (Steiner et al. 1962; Carpino et al. 1981; Slott et al. 1990). BDL rats show a large development of the bile duct system with a marked proliferation of the peribiliary plexus and a progressive decrease of the hepatocyte mass (Gaudio et al. 1996).
The progressive structural transformation of the parenchyma, the relative loss of hepatocytes, their consequent proliferation and the remodelling of the vascular bed finally lead to the failure of hepatic function. Many functional experiments have demonstrated a decreased uptake of substrates from plasma in cirrhosis (Reichen et al. 1987; Angelico et al. 1991; Martinez-Hernandez & Martinez, 1991).
There is a close relationship between the morphological changes, especially those observed in the vascular network of the hepatic lobules, and alterations in the metabolic zonation of the liver (Gaudio et al. 1997; Onori et al. 2000). Thus, quantification of these vascular changes, which are representative of specific liver diseases, is highly desirable. SEM VCCs provide an original view of the microvasculature, because this view is not hindered by the presence of tissue; in addition, this technique offers the highest depth of field (Hodde et al. 1977).
Fractal analysis is used in biomedical studies for the exact characterization of the complexity of analysed structures (Losa & Weibel, 1994; Vico et al. 1994; Kedzia et al. 2002). Among the latter, vascular networks represent a very favourable subject of investigation. In this study fractal analysis was applied for quantitative analysis of SEM VCCs of cirrhotic and control rat livers. This kind of analysis could contribute to a better understanding of the pathophysiological and clinical implications of the disease. We analysed the frequency and spatial domains of the digitized photomicrographs using Fourier analysis. Fourier transformation coefficients were computed using fast Fourier transform (FFT) algorithms.
Materials and methods
Male Wistar rats weighing ∼200g were divided into two groups: controls (n = 4) and treated animals (n = 16). The National Research Council's criteria for the care and use of laboratory animals were followed and the experiments were performed with the approval of the local ethics committee.
For CCl4-inducing cirrhosis, animals were treated with weekly doses of CCl4 for 10 weeks as reported elsewhere (Ariosto et al. 1989) and were killed after 2 and 6 weeks of treatment. Barbital sodium was administrated to enhance the toxic effects of CCl4.
For BDL-inducing cirrhosis, the bile duct was double ligated and then sliced (Carpino et al. 1981). Animals were killed 2 and 4 weeks after BDL.
SEM VCCs
Under ether/air blend anaesthesia, the abdomen of the rat was opened and a cannula (Inpharven, diameter 1.4mm) was inserted into the aorta and fixed with two silk sutures. Before flushing the vascular bed with heparinized 0.9% saline solution (Hodde et al. 1977), the thorax was opened and the right atrium incised to allow efflux of the perfusate. When the outflow fluid appeared clear of blood, Mercox CL2R resin diluted with methyl metacrylate monomer (up to 2 mL catalyser per 20 mL of base compound) was injected at room temperature. Constant pressure control was maintained (CONEL electronic manometer, Rome) through the lateral port of the injection valve of the cannula until visible polymerization began. The animals were left for 24 h at room temperature and after polymerization of the resin the livers were removed and macerated in 20% NaOH solution at room temperature. Following rinsing in distilled water, the liver casts were placed in 5% trichloroacetic acid solution to free the cast from tissue remnants (Miodonski & Bar, 1987). The casts were isolated, frozen in distilled water and freeze-dried. They were glued onto stubs by means of Silver Dag and coated with gold in an S 150 sputter (Edwards, London, UK). Finally, the prepared casts were examined with a Hitachi S4000 field-emission scanning electron microscope (Hitachi Ltd, Tokyo, Japan) operating at an accelerating voltage of 5–8 kV.
The following photomicrographs were taken at the standard magnification of 80×:
control (ni) – near and far from the hilus (n = 39);
bdl2 – taken 2 weeks after bile duct ligation (n = 18);
bdl4 – taken 4 weeks after bile duct ligation (n = 19);
ccl2 – CCl4-treated livers after 2 weeks (n = 19);
ccl6 – CCl4-treated livers after 6 weeks (n = 17).
Mathematical analysis
For evaluation of the photomicrographs we applied either Fourier or fractal analyses. As the contrast offered by the SEM images could influence the calculation of the energy of the Fourier power spectrum, all images were taken under standard conditions (magnification, depth of field, contrast).
Fourier analysis
The basic assumption of Fourier analysis is to treat each analysed image (photomicrography) as a superposition of a large amount of elementary diffraction graticules, differing in their constance, i.e. number of lines per mm (also called frequency), and the angular direction of the lines with respect to the arbitrary NS (Normal System) axis. This kind of analysis is based on the optical diffractogram of each analysed image. We used the mathematical technique. Using the FFT, Fourier transformation coefficients showing radial and spatial distribution of elementary harmonic elements of the images were computed, allowing for calculation of the spatial and angular distribution of light energy contained in the analysed images. Indicating with I(r, c), the image function with r = row c = column where the image is N × N pixels, the Fourier transform algorithm is:
 |
Amplitude was defined as
The relative coefficients were computed using FFT algorithms. Based on Fourier coefficients, radial and spatial distributions were defined as follows:
Radial analysis
We defined n = 20 bands (Pn) of spatial frequency, where the width of one band was Δf = 0.98 L mm−1.
The spectral region of radial analysis was defined as rings. We measured the amplitude (A(Pn)) in a region of interest of spatial frequency by summing the amplitude over the chosen range:
 |
Based on radial Fourier distribution the energy of the radial Fourier spectrum (E) and the entropy of the radial Fourier spectrum (ε) were defined as follows:
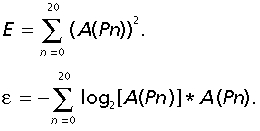 |
Entropy is a particular form of energy related to the state of disorder of the material: higher entropy value indicate higher state of disorder in the system. E is the general amount of system energy, from a thermodynamic point of view, given by the addition of thermal and entropic energy. A normal system evolves to a minimum of total energy, corresponding to a maximum of stability, and at the same time to a maximal entropy, corresponding to a state of disorder.
For our analysis, the algorithm was implemented in the program MATHCAD 6.0.
Fractal analysis
We used two methods of fractal dimension estimation: Box Counting and the Fourier power spectrum method according to the algorithms described in the literature (Veenland et al. 1966; Feder, 1988; Caldwell et al. 1990; Samarabandu et al. 1993; Caligiuri et al. 1994; Chan, 1995; Gerates & van der Stelt, 2000; Kedzia et al. 2002).
The purpose of the Box Counting algorithm is to estimate the length of a complicated curve, which has several implications. Using this algorithm, fractal dimension was obtained from the binarized images, which are a map of the vessel structure. A grid consisting of square boxes with size ε was superimposed on the extracted boundary of the vessel network to be quantified.
In the Fourier power spectrum method of fractal dimension estimation the two-dimensional (2D) Fourier transform of the digital image is calculated first and the 2D power spectrum is obtained. The latter is then reduced to a 1D power spectrum by averaging over circles. The average 1D power spectrum P(f) of the surface is a function of the frequency f.
Statistical analysis
The numerical data of these analyses were used for the discriminant analysis. manova analysis was applied in order to show statistically significant differences between all groups examined (P < 0.05).
Discriminant analysis
The numerical data obtained by the use of fractal and Fourier analyses of the images were used for the discriminant analysis. These data allowed the construction of multi-axial space and each image was positioned according to the measured values. In each analysed group of images a centroid was calculated and this allowed the distances between the centroids (the Mahalanobis distances) to be calculated.
The territorial map is a projection of multi-axial space and the Mahalanobis distances are not Euclidean lines. Evaluation of these distances allows us to calculate differences between the compared groups of images and to estimate the statistical validity of differences. The discriminant analysis automatically computes the classification functions. The classification functions can be used to determine to which group each case most likely belongs.
All statistical analysis was performed using STATISTICA 5.0 software (StatSoft, Inc., Tulsa, OK, USA). We compared the analysed groups using the t-test.
Results
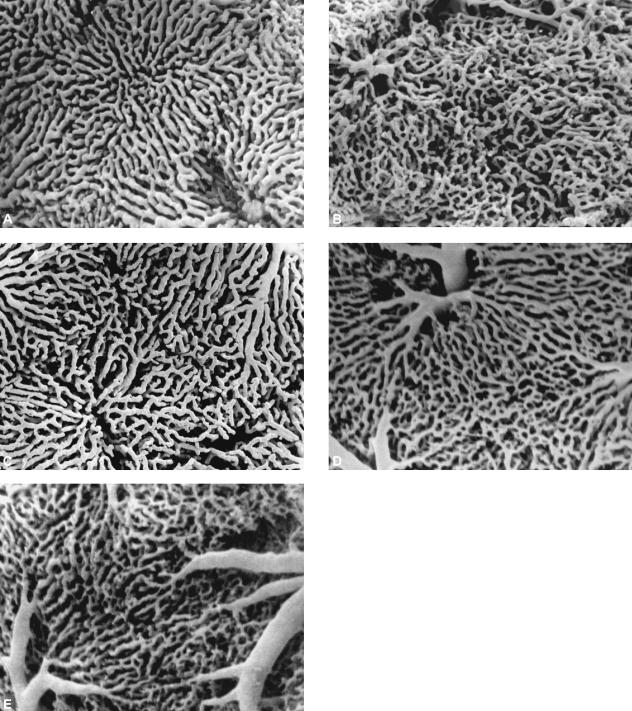
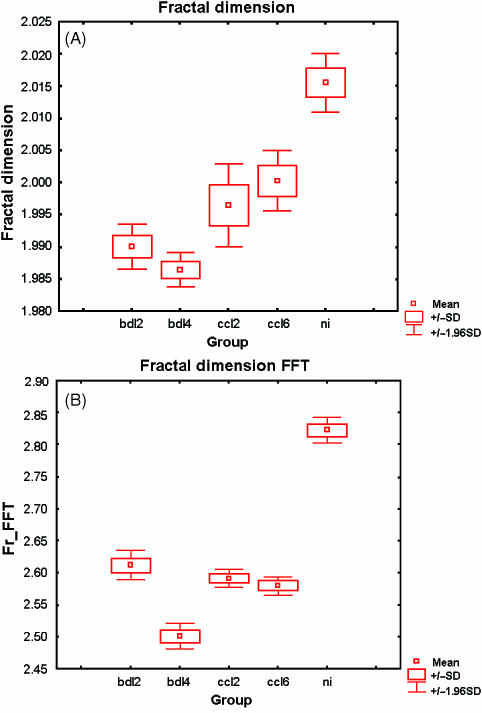
Figure 1 shows examples of SEM photomicrographs taken from controls and from both CCl4 and BDL cirrhotic groups. All normalized images of vessel networks were analysed measuring their fractal dimensions (Fig.2a,B). The fractal dimension is higher for normal livers than for cirrhotic livelrs. Among cirrhotic groups, BDL livers at 4 weeks have lower fractal dimensions.
Fig. 1.
Examples of analysed samples. (A) Controls and (B) BDL at 2 weeks (BDL2); (C) BDL at 4 weeks (BDL4); (D) CCl4 at 2 weeks (CCl2); (E) CCl4 at 6 weeks (CCl6). BDL2 and CCl2 show the highest disorder of the sinusoidal network. In CCl6 the nodular aspect of the microcirculation is shown, with a different and more confused organization with respect to normal livers. BDL4 sinusoids seem to assume an ordered organization, but different from that of normal liver.
Fig. 2.
Fractal dimensions of the analysed vessel networks. The higher numerical values correspond to more complex structures. (A)Box Counting method,(B)Fourier power spectrum method.
Using the parameters obtained from the Fourier radial distribution (FRD) of frequencies and by analysis of fractal dimensions, five groups were defined (Table1). Results of manova analysis demonstrating statistically significant differences between all the examined groups are shown in Table2
Table 1.
Mean and standard deviations of Fractal dimensions and parameters of Fourier radial distribution of analysed structures
| Fractal dimension |
Fr_FFT |
Energy |
Entropy |
Area |
|||||||
|---|---|---|---|---|---|---|---|---|---|---|---|
| n | Mean | SD | Mean | SD | Mean | SD | Mean | SD | Mean | SD | |
| bdl2 | 18 | 1.9900 | 0.0075 | 2.6123 | 0.0488 | 16983 | 52989 | −27467 | 4661 | 2834.5 | 396.20 |
| bdl4 | 19 | 1.9864 | 0.0058 | 2.5012 | 0.0449 | 54244 | 21358 | −50878 | 10794 | 5006.6 | 998.78 |
| ccl2 | 19 | 1.99652 | 0.0141 | 2.5912 | 0.0314 | 16857 | 84662 | −25841 | 7281 | 2619.0 | 644.34 |
| ccl6 | 17 | 2.00031 | 0.0098 | 2.5800 | 0.0302 | 22849 | 80744 | −31917 | 6428 | 3164.0 | 557.21 |
| Control (ni) | 39 | 2.01604 | 0.0144 | 2.8230 | 0.0648 | 27164 | 14475 | −35749 | 9573 | 3717.3 | 845.35 |
Table 2.
Multivariate tests of significance. The results of the analysis showed statistically significant differences between all examined groups (P < 0.05)
| Test | Value | F | Effect d.f. | Error d.f. | P | |
|---|---|---|---|---|---|---|
| Intercept | Wilks | 0.000018 | 934917.1 | 6 | 102.0000 | 0.00 |
| CLAS | Wilks | 0.015834 | 33.9 | 24 | 357.0455 | 0.00 |
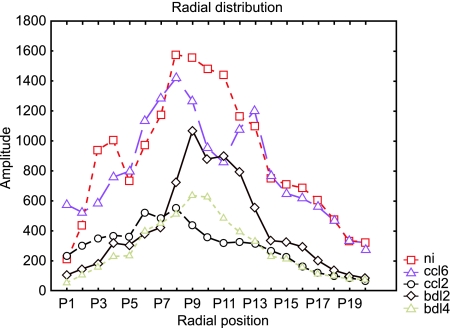
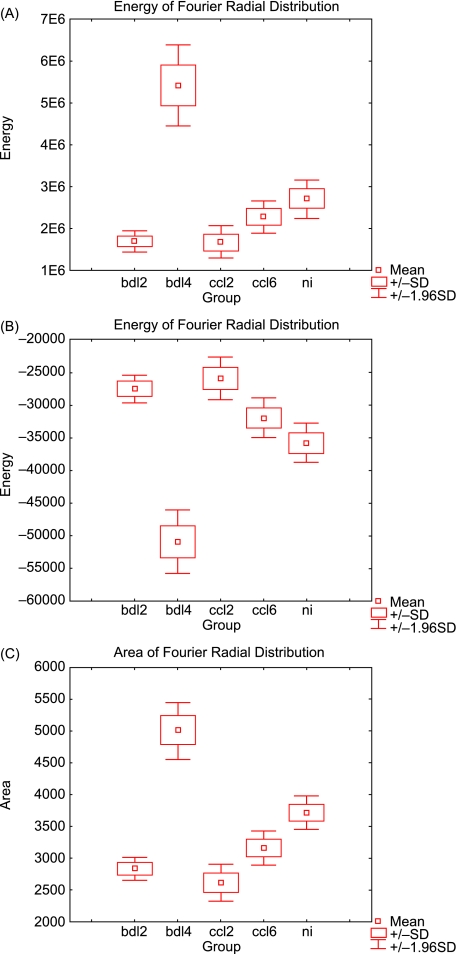
Fourier analysis of the chosen areas allowed us to determine the principal frequencies of the structures analysed, which were used inter alia as parameters in the discriminant analysis. Based on the FRD (Fig.3) the energy (Fig.4A), entropy (Fig.4B) and area (Fig.4C) of the radial Fourier spectrum were defined.
Fig. 3.
Radial distribution of analysed structures calculated by Fourier transformation corresponding to their dimensions. The x-axis represents defined bands of spatial frequencies. The y-axis represents the amplitude of particular frequency bands. We defined 20 bands of spatial frequency.
Fig. 4.
Parameters of radial distribution of spatial frequencies: (A) energy, (B) entropy, (C) area.
The entropy values are higher for cirrhosis than for normal livers, except for BDL at 4 weeks. Between the cirrhotic groups, higher values are characteristic of the initial time points. The energy trend of the FRD is in agreement with the entropy of the FRD. In fact, samples characterized by low energy have high entropy values.
Mahalanobis distances, corresponding to measures of the distance between centroids of the analysed samples in multiparameter space, are shown in Table3. Control and experimental animals could be classified with an efficiency of 94.6% (Table 4).
Table 3.
Squared Mahalanobis distances. The Mahalanobis distances are measures of the distances between the centroids representing the analysed samples in multiparameter space
| bdl2 | bdl4 | ccl2 | ccl6 | control | |
|---|---|---|---|---|---|
| bdl2 | 0.00000 | 17.10653 | 15.25621 | 22.09210 | 36.89158 |
| P < 0.05 | P < 0.05 | P < 0.05 | P < 0.05 | ||
| bdl4 | 17.10653 | 0.00000 | 18.30064 | 19.74612 | 50.66249 |
| P < 0.05 | P < 0.05 | P < 0.05 | P < 0.05 | ||
| ccl2 | 15.25621 | 18.30064 | 0.00000 | 2.18813 | 27.99957 |
| P < 0.05 | P < 0.05 | P < 0.05 | P < 0.05 | ||
| ccl6 | 22.09210 | 19.74612 | 2.18813 | 0.00000 | 27.95568 |
| P < 0.05 | P < 0.05 | P < 0.05 | P < 0.05 | ||
| control | 36.89158 | 50.66249 | 27.99957 | 27.95568 | 0.00000 |
| P < 0.05 | P < 0.05 | P < 0.05 | P < 0.05 |
Table 4.
Classification matrix
| Per cent correct | |
|---|---|
| bdl2 | 100.000 |
| bdl4 | 89.473 |
| ccl2 | 84.210 |
| ccl6 | 94.117 |
| Control | 100.000 |
| Total | 94.642 |
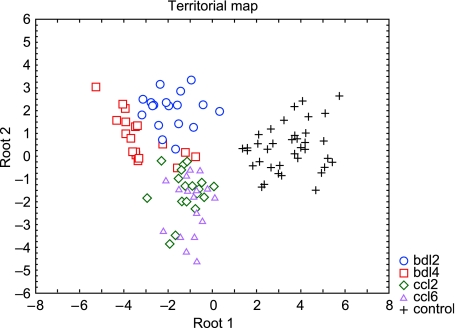
The territorial map shown in Fig.5 indicates differences among control and cirrhotic vessels, as measured by the distances between the centroids. The most distinct differences are the changes in the vascular network in animals with BDL after 14 days. A similar result is evident in Fig.2 where the control group has a much higher value than the experimental groups. Again the lowest values characterize the BDL effects in comparison with the CCl4-induced cirrhotic livers.
Fig. 5.
Territorial map based on discriminant analysis showing distances between the centroids representing the compared groups. Centroids are the points in multiparameter space, in our case defined by five parameters (values of energy, entropy and area radial distribution; Fast fourier transformation; and fractal dimensions). The numerical Mahalanobis distances shown in the attached table emphasize the distinct differences between the analysed groups.
Discussion
Standard quantitative methods based on classical Euclidean geometry have now been supplemented by quantitative fractal analysis (Vico et al. 1994; Losa & Weibel, 1994; Kedzia et al. 2002). Fractal geometry is now largely accepted as being more valid for quantifying complex structures (Mainster, 1990; Daxer, 1993; Hesse et al. 1993; Landini et al. 1993; Panico & Sterling, 1995; Avakian et al. 2002). The advantage of fractal analysis depends on the fact that one can evaluate the vessel network quantitatively by using a single parameter, the fractal dimension, which is a measure of the complexity of the structures analysed (Mandelbrot, 1967). The fractal dimension has been calculated for the analysis of retinal vessels (Mainster, 1990) and bone tissue (Fazzalari & Parkinson, 1996); using the Box Counting method the fractal dimension was also applied for studying the patterns of parenchyma in mammograms (Caldwell et al. 1990) and for discriminating osteoporosis in radiographs (Caligiuri et al. 1994).
There are several published techniques for calculating the fractal dimension (Gerates & Van der Stelt, 2000). In the present work we compare, initially, the traditional Box Counting method with the Fourier power spectrum method. Figure2(A,B) shows the fractal dimension of the analysed vessel network calculated with Box Counting and Fourier power spectrum methods, respectively. The two methods are not mathematically identical and produce different numerical values. In Fig.2(B) it is evident that the Fourier method produces higher numerical values for each group, corresponding to a more accurate evaluation. Energy determination was therefore performed using the second method.
Fractal analysis allows us to describe and measure quantitatively the ‘self-similarity’ of analysed objects. Self-similarity is the fractal dimension showing how similar are parts of an analysed structure compared with the structure as a whole. We should stress that the value of the fractal dimension is independent of the density of blood vessels in the analysed field. Arborization, i.e. the tree-like appearance of the vessels, forms a good object for this type of analysis. The higher numerical value of the fractal dimension corresponds to higher complexity of the analysed structure.
To our knowledge, this is the first application of fractal analysis to VCCs observed by SEM in order to determine a method that permits us to discriminate between the architectures of a specific microvascular network by reference to a unique number, the fractal dimension. The fractal analysis performed on liver sinusoids has shown a higher complexity of the microvascular network in normal livers than in cirrhosis livers. This higher complexity corresponds to a higher tortuousness, arborization and interconnections between adjacent sinusoids in the normal liver, in contrast to more linear and less ramified sinusoids in the cirrhotic liver.
These findings are explained by the rearrangement of the hepatic parenchyma consequent to induction of cirrhosis, characterized by the development of fibrous septa around the hepatic lobules, the regenerative activity of hepatocytes following the pathological insult and remodelling of the sinusoidal bed (Gaudio et al. 1993, 1996).
We have previously performed a histomorphometrical study of the microcirculation of CCl4-induced cirrhotic vs. normal rat livers (Onori et al. 2000). We demonstrated that cirrhotic livers were characterized by (1) the tendency of the sinusoids to show uniform shape and dimension, without the marked zonal differences observed in normal liver; (2) reduced sinusoids per unit of parenchyma; and (3) reduced interface between sinusoids and hepatocytes. Although the perfusion ratio (sinusoids in relation to the mass of hepatocytes) was seriously impaired, the above findings constituted a morphological basis to explain the loss of the metabolic zonation normally present in hepatic acini (Gaudio et al. 1997). The present analysis further confirms our previous observations. Indeed, the smaller fractal dimension of the sinusoids in cirrhosis is related to a less complex sinusoidal bed, i.e. with linear and less ramified sinusoids. This observation corresponds to a loss of hierarchical structure in the cirrhotic vascular bed (variation in the thickness of vessels and in self-similarity), which might reduce the efficiency of material transport inside the vascular bed. The above findings and the previously described reduced interface between sinusoids and hepatocytes in cirrhosis (Onori et al. 2000) could be ascribed as the main reasons leading to a progressive failure of the sinusoidal network to provide the functional demand of the hepatocytes, as demonstrated by the decreased uptake of substrates from plasma (Reichen et al. 1987; Angelico et al. 1991; Martinez-Hernandez & Martinez, 1991).
It is well known that entropy is related to the disorder state of the material (Boltzman's law): a high entropy value corresponds to high disorder within the system. Entropy could allow us to discriminate the studied groups.
Fractal analysis and the FRD have demonstrated in livers that have suffered initial injuries, both CCl4 and BDL at 2 weeks (CCL2 and BDL2 groups), marked disorganization (low energy, high entropy) with respect to normal livers. CCl4-treated livers at 2 weeks are characterized by the highest entropy value (the most disordered system). This should correspond to the phase of continuous remodelling of the sinusoidal network, with regenerative capability in response to the initial injury. In fact, histological examination of these samples demonstrated an initial fibrosis but not definitive cirrhosis (Ariosto et al. 1989).
After 6 weeks of CCl4 (CCL6 group) administration the cirrhosis became stable, assuming the irreversible histological aspect of hepatic noduli surrounded by fibrous septa containing larger blood vessels (Ariosto et al. 1989; Gaudio et al. 1993). At this time point the tissues were losing reparative capability and the mathematical analysis revealed lower entropy values.
The method of analysing liver sinusoids described revealed large differences in the complexity of the microvascular network when comparing normal liver with cirrhosis. Moreover, differences were found between the two models of experimentally induced cirrhosis, and also at different time points of cirrhosis development. Fractal geometry offers a more accurate description of sinusoidal anatomy and pathology than classical geometry, and could have potential value for future diagnosis of liver diseases, as well as for interpreting and better understanding the pathophysiology of liver failure in cirrhosis.
Acknowledgments
We thank Professor Marcella Trombetta of the University Campus Bio-Medico of Rome for supervising the technical aspects of the Materials and methods and Discussion sections.
References
- Angelico M, Alvaro D, Cantafora A, et al. Impaired hepatic handling and processing of Lysophosphatidylcholine in rats with liver cirrhosis. Gastroenterology. 1991;101:228–237. doi: 10.1016/0016-5085(91)90482-z. [DOI] [PubMed] [Google Scholar]
- Ariosto F, Riggio O, Cantafora A, et al. Carbon tetrachloride-induced experimental cirrhosis in the rat: a reappraisal of the model. Eur Surg Res. 1989;21:280–286. doi: 10.1159/000129038. [DOI] [PubMed] [Google Scholar]
- Avakian A, Kalina RE, Sage EH, et al. Fractal analysis of region-based vascular change in the normal and non-proliferative diabetic retina. Curr Eye Res. 2002;24:274–280. doi: 10.1076/ceyr.24.4.274.8411. [DOI] [PubMed] [Google Scholar]
- Caldwell CB, Stapleton SJ, Holdsworth DW, et al. Characterisation of mammographic parenchymal pattern by fractal dimension. Phys Med Biol. 1990;35:235–247. doi: 10.1088/0031-9155/35/2/004. [DOI] [PubMed] [Google Scholar]
- Caligiuri P, Giger ML, Favus M. Multifractal radiographic analysis of osteoporosis. Med Phys. 1994;21:503–508. doi: 10.1118/1.597390. [DOI] [PubMed] [Google Scholar]
- Carpino F, Gaudio E, Marinozzi G, Melis M, Motta PM. A scanning and transmission electron microscopic study of experimental extrahepatic cholestasis in the rat. J Submicrosc Cytol. 1981;13:581–598. [PubMed] [Google Scholar]
- Chan KL. Quantitative characterisation of electron micrograph image using fractal feature. IEEE Trans Biomed Engng. 1995;42:1033–1037. doi: 10.1109/10.464378. [DOI] [PubMed] [Google Scholar]
- Daxer A. Characterisation of the neovascularisation process in diabetic retinopathy by means of fractal geometry: diagnostic implications. Graefes Arch Clin Exp Ophthalmol. 1993;231:681–686. doi: 10.1007/BF00919281. [DOI] [PubMed] [Google Scholar]
- Fazzalari NI, Parkinson IH. Fractal dimension and architecture of trabecular bone. J Pathol. 1996;178:100–105. doi: 10.1002/(SICI)1096-9896(199601)178:1<100::AID-PATH429>3.0.CO;2-K. [DOI] [PubMed] [Google Scholar]
- Feder J. Fractals. New York: Plenum Press; 1988. [Google Scholar]
- Gaudio E, Pannarale L, Onori P, Riggio O. A scanning electron microscopic study of liver microcirculation disarrangement in experimental rat cirrhosis. Hepatology. 1993;17:477–485. [PubMed] [Google Scholar]
- Gaudio E, Onori P, Pannarale L, Alvaro D. Hepatic microcirculation and peribiliary plexus in experimental biliary cirrhosis: a morphological study. Gastroenterology. 1996;111:1118–1124. doi: 10.1016/s0016-5085(96)70081-1. [DOI] [PubMed] [Google Scholar]
- Gaudio E, Onori P, Franchitto A, Sferra R, Riggio O. Liver metabolic zonation and hepatic microcirculation in carbon tetrachloride-induced experimental cirrhosis. Dig Dis Sci. 1997;42:167–177. doi: 10.1023/a:1018813911469. [DOI] [PubMed] [Google Scholar]
- Gerates WGM, Van der Stelt PF. Fractal properties of bone. Dentomaxillofac Radiol. 2000;29:144–153. doi: 10.1038/sj/dmfr/4600524. [DOI] [PubMed] [Google Scholar]
- Hesse L, Chofflet J, Le Mer Y. Simulation of the growth pattern of the central retinal artery using a fractal modeling technique. Ger J Ophthalmol. 1993;2:116–118. [PubMed] [Google Scholar]
- Hodde KC, Miodonski AJ, Bakker C, Veltman WAM. SEM of microcorrosion casts with special attention on arterio-venous differences and application to the rat cochlea. Scanning Electron Microsc. 1977;II:477–484. [Google Scholar]
- Kedzia A, Rybaczuk M, Andrzejak R. Fractal dimensions of human brain cortex vessels during the fetal period. Med Sci Monit. 2002;8:46–51. [PubMed] [Google Scholar]
- Landini G, Misson GP, Murray PI. Fractal analysis of the normal human retinal fluorescein angiogram. Curr Eye Res. 1993;12:23–27. doi: 10.3109/02713689308999492. [DOI] [PubMed] [Google Scholar]
- Losa GF, Weibel ER. Fractals in Biology and Medicine. Basel: Birkhauser Verlag; 1994. [Google Scholar]
- Mainster MA. The fractal properties of retinal vessels: embryological and clinical implications. Eye. 1990;4:235–241. doi: 10.1038/eye.1990.33. [DOI] [PubMed] [Google Scholar]
- Mandelbrot BB. How long is the coast of Britain? – Statistical self-similarity and fractional dimension. Science. 1967;156:636–638. doi: 10.1126/science.156.3775.636. [DOI] [PubMed] [Google Scholar]
- Martinez-Hernandez A, Martinez J. The role of capillarization in hepatic failure: studies in carbon tetrachloride-induced cirrhosis. Hepatology. 1991;14:864–874. doi: 10.1002/hep.1840140519. [DOI] [PubMed] [Google Scholar]
- Miodonski AJ, Bar T. The superficial vascular hyaloid system in the eye of the frogs, Rana temporaria and Rana esculenta. Scanning electron-microscopic study of vascular corrosion casts. Cell Tissue Res. 1987;250:465–473. doi: 10.1007/BF00219093. [DOI] [PubMed] [Google Scholar]
- Onori P, Morini S, Franchitto A, Sferra R, Alvaro D, Gaudio E. Hepatic microvascular features in experimental cirrhosis: a structural and morphometrical study in CCl4-treated rats. J Hepatol. 2000;33:555–563. doi: 10.1034/j.1600-0641.2000.033004555.x. [DOI] [PubMed] [Google Scholar]
- Panico J, Sterling P. Retinal neurons and vessels are not fractal but space-filling. J Comp Neurol. 1995;361:479–490. doi: 10.1002/cne.903610311. [DOI] [PubMed] [Google Scholar]
- Proctor E, Chatamra K. Standardized micronodular cirrhosis in the rat. Eur Surg Res. 1984;16:182–186. doi: 10.1159/000128407. [DOI] [PubMed] [Google Scholar]
- Reichen J, Hoilien C, Le M, Jones RH. Decreased uptake of taurocholate and ouabain by hepatocytes isolated from cirrhotic rat liver. Hepatology. 1987;7:67–70. doi: 10.1002/hep.1840070115. [DOI] [PubMed] [Google Scholar]
- Samarabandu J, Acharya R, Hausmann E, Allen K. Analysis of bone X-rays using morphological fractals. IEEE Trans Med Imaging. 1993;12:466–470. doi: 10.1109/42.241873. [DOI] [PubMed] [Google Scholar]
- Slott PA, Liu MH, Tavoloni N. Origin, pattern, and mechanism of bile duct proliferation following biliary obstruction in the rat. Gastroenterology. 1990;99:466–477. doi: 10.1016/0016-5085(90)91030-a. [DOI] [PubMed] [Google Scholar]
- Steiner JW, Carruthers JS, Kalifat SR. The ductular cell reaction of rat liver in extrahepatic cholestasis. II. Proliferated biliary epithelial cell. Exp Mol Pathol. 1962;1:162–185. doi: 10.1016/0014-4800(62)90019-9. [DOI] [PubMed] [Google Scholar]
- Veenland JF, Grashuis JL, Van der Meer F, Beckers A, Gelsema ES. Estimation of fractal dimension in radiograms. Med Phys. 1966;23:585–594. doi: 10.1118/1.597816. [DOI] [PubMed] [Google Scholar]
- Vico PG, Boyer H, Cartillier LH. New concepts in the study of tissue vascularisation: a mathematical model of skin vascularisation. Plast Reconstr Surg. 1994;94:174–179. doi: 10.1097/00006534-199407000-00020. [DOI] [PubMed] [Google Scholar]


