Abstract
Normal and abnormal jaw growth and tooth eruption are topics of great importance for several dental and medical disciplines. Thus far, clinical studies on these topics have used two-dimensional (2D) radiographic techniques. The purpose of the present study was to analyse normal mandibular growth and tooth eruption in three dimensions based on computer tomography (CT) scans, extending the principles of mandibular growth analysis proposed by Björk in 1969 from two to three dimensions. As longitudinal CT data from normal children are not available (for ethical reasons), CT data from children with Apert syndrome were employed, because it has been shown that the mandible in Apert syndrome is unaffected by the malformation, and these children often have several craniofacial CT scans performed during childhood for planning of cranial and midface surgery and for follow-up after surgery. A total of 49 datasets from ten children with Apert syndrome were available for study. The number of datasets from each individual ranged from three to seven. The first CT scan in each of the ten series was carried out before 1 year of age, and the ages for the 49 scans ranged from 1 week to 14.5 years. The mandible and the teeth were segmented and iso-surfaces generated. Landmarks were placed on the surface of the mandible, along the mandibular canals, the inner contour of the cortical plate at the lower border of the symphysis menti, and on the teeth. Superimposition of the mandibles in the longitudinal series was performed using the symphysis menti and the mandibular canals as suggested by Björk. The study supported the findings of stability of the symphysis menti and the mandibular canals as seen in profile view previously reported by Björk & Skieller in 1983. However, the mandibular canals were, actually, relocated laterally during growth. Furthermore, the position of tooth buds remained relatively stable inside the jaw until root formation started. Eruption paths of canines and premolars were vertical, whereas molars erupted in a lingual direction. The 3D method would seem to offer new insight into jaw growth and tooth eruption, but further studies are needed.
Keywords: CT, development, facial growth, jaw, three dimensions
Introduction
Normal and abnormal facial growth and tooth eruption are topics of great importance for several dental disciplines, such as pedodontics, orthodontics, and oral and maxillofacial surgery. All clinical studies have, thus far, been carried out using two-dimensional (2D) roentgencephalometric techniques (e.g. Björk, 1968; Björk & Kuroda, 1968; Björk & Skieller, 1972, 1983).
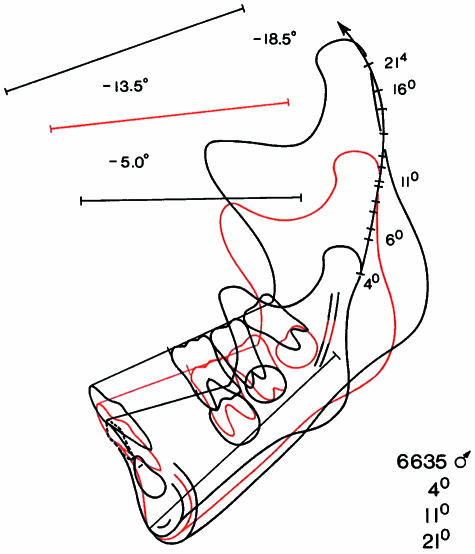
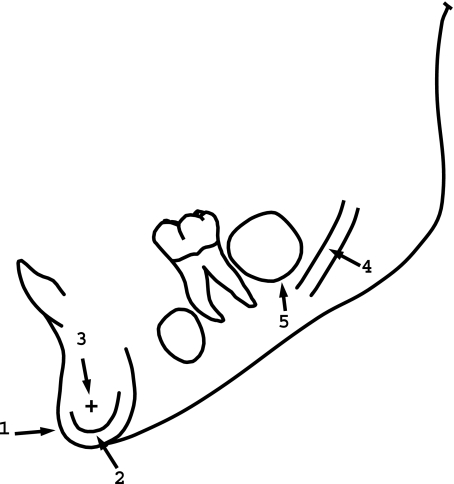
The techniques of roentgencephalometry were originally developed 70 years ago by orthodontic researchers (Hofrath, 1931; Broadbent, 1931), searching for a method that would make possible the longitudinal study of growth of the jaws in children through standardized, reproducible skull X-rays with known magnification and minimal distortion. Broadbent's technique has gained worldwide acceptance within the field of orthodontics as an indispensable clinical and research tool. Perspectives in the application of roentgencephalometry to clinical orthodontics and to the study of craniofacial anomalies have been extensively reviewed by Ricketts (1981) and Kreiborg (1985), respectively. Although the basic technique of Broadbent's cephalometric method has remained almost unaltered over the years, several significant technical improvements have been made (Björk, 1951, 1968; Pruzansky & Lis, 1958; Kreiborg et al. 1977; Solow & Kreiborg, 1988), which again have led to development of refined analytical methods (Björk, 1955, 1968; Walker, 1967; Kreiborg, 1981; Hermann et al. 2001). One of the most significant analytical improvements in roentgencephalometry included the use of metallic implants in the jaws (Björk, 1955, 1968). This method made it possible to distinguish between displacement and surface remodelling of the individual jaw and to study tooth eruption in longitudinal studies of facial growth (Björk, 1968; Björk & Skieller, 1972, 1983) (see Fig. 1). This method of analysis of jaw growth has been a major step forward in our understanding of normal growth of the face. Based on their extensive implant studies, Björk (1969) and Björk & Skieller (1983) suggested that superimposition of cephalometric films or drawings in longitudinal series of individual children can be carried out on stable natural, anatomical reference structures without the use of metallic implants. For the mandible these structures are: (1) the anterior contour of the chin; (2) the inner contour of the cortical plate at the lower border of the symphysis menti; (3) any distinct trabecular structure in the symphysis menti; (4) the contour of the mandibular canal; and (5) the lower contour of mineralized tooth germs before root development begins (Fig. 2). This superimposition technique today represents a paradigm.
Fig. 1.
Two-dimensional mandibular growth analysis from 4 to 21 years of age in a normal individual, based on cephalometric radiographs in the lateral projection and superimposed on metallic implants inserted into the jaw. Note the surface remodelling and the eruption of the teeth. (Modified from Björk & Skieller, 1983.)
Fig. 2.
Anatomical reference structures: (1) the anterior contour of the chin; (2) the inner contour of the cortical plate at the lower border of the symphysis menti; (3) any distinct trabecular structure in the symphysis menti; (4) the contour of the mandibular canal; (5) the lower contour of mineralized tooth germs before root development begins. (Modified from Björk & Skieller, 1983.)
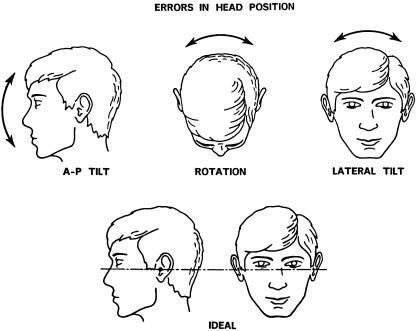
One of the most severe problems in roentgencephalometry is, however, to control head position during exposure. Ideally, the head should be positioned according to the Frankfurt horizontal and the plane of symmetry at every examination including both the lateral and the frontal projections (Fig. 3). However, in conventional cephalometry control of head positioning is often flawed by error (see Fig. 3), leading to analytical problems when studying jaw growth and tooth eruption. A few cephalometric units for research purposes have, however, attempted to solve these problems by, in addition to ear-rods, employing light-crosses projected on the face and an image intensifier (Björk, 1968; Kreiborg et al. 1977; Solow & Kreiborg, 1988). Another serious shortcoming of roentgencephalometric analyses is that throughout they are limited to two dimensions. With the introduction of high-resolution computer tomography (CT) scans to the craniofacial region, it became possible to make 3D reconstructions of the craniofacial skeleton (Marsh & Vannier, 1983). These techniques have led to numerous qualitative as well as quantitative analyses of craniofacial morphology, primarily in subjects with various types of congenital craniofacial anomalies (Abbott et al. 1990, 2000; Marsh et al. 1991; Kreiborg et al. 1993; Vannier et al. 1994; Lo et al. 1996; Vannier & Marsh, 1996; Cavalcanti & Vannier, 1998; Zumpano et al. 1999; Kane et al. 2000). However, only very few attempts have been made to analyse craniofacial growth in three dimensions (Bro-Nielsen et al. 1997; Andresen et al. 2000; Kreiborg et al. 2001; Hilger et al. 2003), although one of the advantages of the technique over conventional cephalometric techniques is that errors in head positioning during exposure can be corrected for by uprighting the 3D model in the computer after the scan has been performed. The purpose of the present study was to analyse normal mandibular growth and tooth eruption in three dimensions, extending the principles of mandibular superimposition on ‘stable, natural, anatomical reference structures’ (Björk, 1969; Björk & Skieller, 1983) from two to three dimensions, thereby testing the paradigm related to the stability of these structures.
Fig. 3.
Ideal head position in the cephalometer (below), and potential errors in head position (above) which will result in various types of distortion in the radiographs.
Materials and methods
Sample
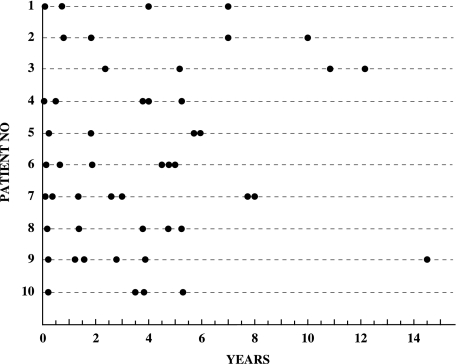
Ten children with Apert syndrome were included in the study, five males and five females. Apert syndrome is characterized by craniosynostosis, midface hypoplasia, and symmetric syndactyly of the hands and feet, minimally involving digits 2, 3 and 4. The inheritance is autosomal dominant with a male-to-female ratio of 1 : 1 and with most cases representing new mutations (Cohen, 2000). Kreiborg et al. (1999) reported a cephalometric study of craniofacial morphology in patients with Apert syndrome. Marked differences were found in nearly all craniofacial regions except the mandible, which was of normal size and shape. Tooth development is normal, whereas tooth eruption is somewhat delayed, especially in the maxilla, because of crowding (Kreiborg & Cohen, 1992; Kaloust et al. 1997). The ten cases with Apert syndrome included in the present study had been followed and treated by The Cleft Palate and Craniofacial Deformities Institute at St Louis Children's Hospital or by The Copenhagen Craniofacial Unit (CCFU) at Copenhagen University Hospital. All children were Caucasian, and all had received some kind of calvarial and/or maxillary surgery. However, no mandibular surgery had been carried out in any of the cases. All patients had had craniofacial CT scans performed in connection with diagnosis, treatment planning and postoperative follow-up. Only patients for whom CT scans had been carried out at least three times over time were included in the study. The ages at which CT scans was performed in the individual patients are given in Fig. 4. The ages ranged from 1 week to 14.5 years, and the number of scans per patient ranged from three to seven. A total of 49 CT datasets were obtained from the ten patients for clinical purposes, and after clinical use these datasets were made available for the 3D-Laboratory for the present study.
Fig. 4.
Ten patients with Apert syndrome. Indication of age at time of CT scans.
Acquisition of CT data
All scans were performed in Siemens CT scanners. The data were obtained over the period 1984–2000. Twenty-nine datasets were obtained in a Siemens DR2 scanner with a slice thickness of 2.0 mm and 256 × 256 matrix, and 20 scans were performed using a Siemens Somatom Plus 4 scanner with a slice thickness of 2.0 mm and 512 × 512 matrix. All scans were otherwise carried out using the same protocol. All data were transferred from the scanners to a powerful graphics computer (Silicon Graphics Onyx2).
Data processing
Data processing consisted of three consecutive steps, pre-processing, landmark definition and digitization, and registration.
Pre-processing
Once the data had been transferred to the Silicon Graphics Onyx2 computer, data conversion was carried out, converting ACR NEMA-files and DICOM-files to Analyze™ format. Following the conversion, the CT scans were checked for motion artefacts and the correct left–right orientation was ascertained.
Landmark definition and digitization
Registration of structures and growth analysis were based on employment of landmarks.
Two types of landmarks were used, anatomical landmarks and pseudo-landmarks (Dryden & Mardia, 1998). The mandible and the teeth (permanent canines, premolars, molars) were segmented using a combination of manual segmentation and threshold selection. Iso-surfaces were generated and rendered using the software package Mvox™ (Anamedic, 1999). Application of this method has previously been described by Bro-Nielsen et al. (1996) and Kreiborg et al. (1996a,b). All landmarks were placed using one of three methods. (1) Interactive landmarks in three orthogonal image slice views, with interactive intensity (window/level) adjustment. This method was applied when registration was made on the mandibular canal and the symphysis menti. (2) Interactive landmarks on under-segmented structures represented as polygonal 3D structures, iso-intensity surfaces with automatic correction. This method was applied when registration was made on the teeth. Landmarks were placed on 3D iso-intensity surfaces, as this provided a more precise localization of landmarks than would have been possible using three 2D orthogonal image slice views. In order to separate the teeth from the jaw bone, a high threshold selection is necessary. This leads, however, to ‘under-segmentation’ of the teeth, thereby underestimating their true size. This error was adjusted for by an automatic correction of the landmark position. The corrected landmark position was chosen to be the first maximum of the intensity gradient in the cranial direction of the tooth, corresponding to the edge of the tooth. The position and the direction of the long axis of the individual tooth was defined by landmarks or points calculated from landmarks. (3) Interactive landmarks on structures represented as polygonal 3D structures, iso-intensity surfaces. This method was applied to registration of the mandible. The threshold selected in rendering the mandible as a polygonal 3D structure was chosen to be that particular threshold in each CT scan where all soft tissue was seen to disappear.
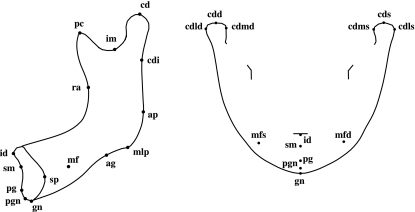
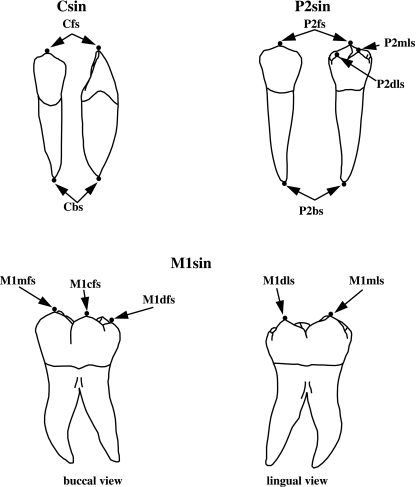
A total of 28 skeletal and 84 dental landmarks were employed. Six of the skeletal landmarks were placed in the mid-sagittal plane, whereas 11 were identical for the right and left side (n = 22). All dental landmarks were bilateral. Some landmarks were not identifiable on all patients and some landmarks were only identifiable at certain ages. Definitions of the skeletal and dental landmarks are given in Tables 1 and 2, and are illustrated in Figs. 5 and 6, respectively. Digitization was carried out using the software package Mvox™. All landmarks were digitized directly on the 3D rendered iso-intensity surfaces, except for the mental foramina and the centres of the dental vacuoles, which were digitized from the 2D slices. The mandibular canals were localized in as many slices as possible. The matrix was perpendicular, and sequential landmarks were digitized at the centre of the canal in each CT slice, using the software package Analyze™ (AnalyzeDirect, 1999). The inner contour of the cortical plate at the lower border of the symphysis menti was localized on one sagittal CT slice in the midline and sequential landmarks were digitized, using the software package Mvox™.
Table 1.
Skeletal landmarks on the mandible (see Fig. 5)
| id | Infradentale. The most antero-superior point of the inferior alveolar process. |
| sm | Supramentale. The most posterior point on the anterior contour of the inferior alveolar process. |
| pg | Pogonion. The most anterior point on the symphysis menti. |
| pgn | Prognathion. The point on the symphysis menti furthest from condylion. |
| gn | Gnathion. The most inferior point on the symphysis menti. |
| sp | Symphysis posterior. The most posterior point on the posterior contour of the symphysis menti. |
| Agd | Antegonion dexter. The highest point in the antegonial notch on the right side. |
| mlpd | Mandibular line, posterior point dexter. The posterior tangent point of the ML on the right side. |
| Apd | Angulus posterior dexter. The inferior tangent point of the RL on the right side. |
| Cdid | Condylion inferior dexter. The most anterior point on the posterior contour of the mandibular ramus on the right side. |
| Cdd | Condylion dexter. The most supero-posterior point on the mandibular condyle on the right side. |
| Cdld | Condylion lateralis dexter. The most lateral point on the mandibular condyle on the right side. |
| cdmd | Condylion mesialis dexter. The most mesial point on the mandibular condyle on the right side. |
| Imd | Incisura mandibulae dexter. The deepest point on the mandibular incisure on the right side. |
| Pcd | Processus coronoideus dexter. The most superior point on the coronoid process on the right side. |
| Rad | Ramus anterior dexter. Deepest point on the anterior contour of the mandibular ramus on the right side. |
| Mfd | Mental foramen dexter. The entrance to the mental canal on the right side. |
| Ags | Antegonion sinister. The highest point in the antegonial notch on the left side. |
| Mlps | Mandibular line, posterior point sinister. The posterior tangent point of the ML on the left side. |
| Aps | Angulus posterior sinister. The inferior tangent point of the RL on the left side. |
| Cdis | Condylion inferior sinister. The most anterior point on the posterior contour of the mandibular ramus on the left side. |
| Cds | Condylion sinister. The most supero-posterior point on the mandibular condyle on the left side. |
| Cdls | Condylion lateralis sinister. The most lateral point on the mandibular condyle on the left side. |
| Cdms | Condylion mesialis sinister. The most mesial point on the mandibular condyle on the left side. |
| Ims | Incisura mandibulae sinister. The deepest point on the mandibular incisure on the left side. |
| Pcs | Processus coronoideus sinister. The most superior point on the coronoid process on the left side. |
| Ras | Ramus anterior sinister. Deepest point on the anterior contour of the mandibular ramus on the left side. |
| Mfs | Mental foramen sinister. The entrance to the mental canal on the left side. |
ML, mandibular line. The tangent to the lower border of the mandible through gn. RL, ramus line. The tangent to the posterior border of the mandible.
Table 2.
| M3mfs | The top of the mesio-facial cusp on the third mandibular molar on the left side. |
| M3cfs | The top of the centro-facial cusp on the third mandibular molar on the left side. |
| M3dfs | The top of the disto-facial cusp on the third mandibular molar on the left side. |
| M3mLs | The top of the mesio-lingual cusp on the third mandibular molar on the left side. |
| M3 dL | The top of the disto-lingual cusp on the third mandibular molar on the left side. |
| M3ts | The centre of the occlusal surface on the third mandibular molar on the left side. |
| M3bs | The centre of the bottom1 on the third mandibular molar on the left side. |
| M3vacs | The centre of the dental vacuole2 on the third mandibular molar on the left side. |
| M2(4)3mfs | The top of the mesio-facial cusp on the second molar on the left side. |
| M2(4)cfs | The top of the centro-facial cusp on the second mandibular molar on the left side. |
| M2(4)mls | The top of the mesio-lingual cusp on the second mandibular molar on the left side. |
| M2(4) dLs | The top of the disto-lingual cusp on the second mandibular molar on the left side. |
| M2(5)4mfs | The top of the mesio-facial cusp on the second molar on the left side. |
| M2(5)cfs | The top of the centro-facial cusp on the second mandibular molar on the left side. |
| M2(5)dfs | The top of the disto-facial cusp on the second mandibular molar on the left side. |
| M2(5)mls | The top of the mesio-lingual cusp on the second mandibular molar on the left side. |
| M2(5)dls | The top of the disto-lingual cusp on the second mandibular molar on the left side. |
| M2ts | The centre of the occlusal surface on the second mandibular molar on the left side. |
| M2bs | The centre of the bottom on the second mandibular molar on the left side. |
| M2vacs | The centre of the dental vacuole on the second mandibular molar on the left side. |
| M1mfs | The top of the mesio-facial cusp on the first mandibular molar on the left side. |
| M1cfs | The top of the centro-facial cusp on the first mandibular molar on the left side. |
| M1dfs | The top of the disto-facial cusp on the first mandibular molar on the left side. |
| M1mls | The top of the mesio-lingual cusp on the first mandibular molar on the left side. |
| M1dl | The top of the disto-lingual cusp on the first mandibular molar on the left side. |
| M1ts | The centre of the occlusal surface on the first mandibular molar on the left side. |
| M1bs | The centre of the bottom on the first mandibular molar on the left side. |
| M1vacs | The centre of the dental vacuole on the first mandibular molar on the left side. |
| P2fs | The top of the facial cusp on the second mandibular premolar on the left side. |
| P2ts | The centre of the upper surface5 on the mineralized tissue of the second mandibular premolar on the left side. |
| P2(3)dls | The top of the disto-lingual cusp on the second mandibular premolar on the left side. |
| P2(3)mls | The top of the mesio-lingual cusp on the second mandibular premolar on the left side. |
| P2(2)ls | The top of the lingual cusp on the second mandibular premolar on the left side. |
| P2bs | The centre of the bottom6 on the second mandibular premolar on the left side. |
| P1fs | The top of the facial cusp on the first mandibular premolar on the left side. |
| P1ts | The centre of the upper surface on the mineralized tissue of the first mandibular premolar on the left side. |
| P1(3)dls | The top of the disto-lingual cusp on the first mandibular premolar on the left side. |
| P1(3)mls | The top of the mesio-lingual cusp on the first mandibular premolar on the left side. |
| P1(2)ls | The top of the lingual cusp on the first mandibular premolar on the left side. |
| P1bs | The centre of the bottom on the first mandibular premolar on the left side. |
| Cfs | The top of the facial cusp on the mandibular canine on the left side. |
| Cbs | The centre of the bottom7 on the mandibular canine on the left side. |
| M3mfd | The top of the mesio-facial cusp on the third mandibular molar on the right side. |
| M3cf | The top of the centro-facial cusp on the third mandibular molar on the right side. |
| M3dfd | The top of the disto-facial cusp on the third mandibular molar on the right side. |
| M3mld | The top of the mesio-lingual cusp on the third mandibular molar on the right side. |
| M3 dLd | The top of the disto-lingual cusp on the third mandibular molar on the right side. |
| M3td | The centre of the occlusal surface on the third mandibular molar on the right side. |
| M3bd | The centre of the bottom on the third mandibular molar on the right side. |
| M3vacd | The centre of the dental vacuole on the third mandibular molar on the right side. |
| M2(4)mfd | The top of the mesio-facial cusp on the second molar on the right side. |
| M2(4)cfd | The top of the centro-facial cusp on the second mandibular molar on the right side. |
| M2(4)mld | The top of the mesio-lingual cusp on the second mandibular molar on the right side. |
| M2(4) dLd | The top of the disto-lingual cusp on the second mandibular molar on the right side. |
| M2(5)mfd | The top of the mesio-facial cusp on the second molar on the right side. |
| M2(5)cfd | The top of the centro-facial cusp on the second mandibular molar on the right side. |
| M2(5)dfd | The top of the disto-facial cusp on the second mandibular molar on the right side. |
| M2(5)mld | The top of the mesio-lingual cusp on the second mandibular molar on the right side. |
| M2(5)dld | The top of the disto-lingual cusp on the second mandibular molar on the right side. |
| M2td | The centre of the occlusal surface on the second mandibular molar on the right side. |
| M2bd | The centre of the bottom on the second mandibular molar on the right side. |
| M2vacd | The centre of the dental vacuole on the second mandibular molar on the right side. |
| M1mfd | The top of the mesio-facial cusp on the first mandibular molar on the right side. |
| M1cfd | The top of the centro-facial cusp on the first mandibular molar on the right side. |
| M1dfd | The top of the disto-facial cusp on the first mandibular molar on the right side. |
| M1mld | The top of the mesio-lingual cusp on the first mandibular molar on the right side. |
| M1dLd | The top of the disto-lingual cusp on the first mandibular molar on the right side. |
| M1td | The centre of the occlusal surface on the first mandibular molar on the right side. |
| M1bd | The centre of the bottom on the first mandibular molar on the right side. |
| M1vacd | The centre of the dental vacuole on the first mandibular molar on the right side. |
| P2fd | The top of the facial cusp on the second mandibular premolar on the right side. |
| P2td | The centre of the upper surface on the mineralized tissue of the second mandibular premolar on the right side. |
| P2(3)dld | The top of the disto-lingual cusp on the second mandibular premolar on the right side. |
| P2(3)mld | The top of the mesio-lingual cusp on the second mandibular premolar on the right side. |
| P2(2)ld | The top of the lingual cusp on the second mandibular premolar on the right side. |
| P2bd | The centre of the bottom on the second mandibular premolar on the right side. |
| P1fd | The top of the facial cusp on the first mandibular premolar on the right side. |
| P1td | The centre of the upper surface on the mineralized tissue of the first mandibular premolar on the right side. |
| P1(3)dld | The top of the disto-lingual cusp on the first mandibular premolar on the right side. |
| P1(3)mld | The top of the mesio-lingual cusp on the first mandibular premolar on the right side. |
| P1(2)ld | The top of the lingual cusp on the first mandibular premolar on the right side. |
| P1bd | The centre of the bottom on the first mandibular premolar on the right side. |
| Cfd | The top of the facial cusp on the mandibular canine on the right side. |
| Cbd | The centre of the bottom on the mandibular canine on the right side. |
Not all patients in the study had the same number of essential cusps on the same tooth type. A combination of the landmarks listed here includes all variations encountered.
Centre of the bottom: on molars, defined as the centre of the furcation or centre of the bottom of the crown if root development had not begun.
Centre of the dental vacuole: defined as the centre of the vacuole in that particular transversal slice in which the dental vacuoles were seen to have the largest diameter.
(4): four-cusp variant.
(5): five-cusp variant.
Centre of the upper surface: on premolars, defined as the centre of the upper surface on the mineralized tissue, if no cusps were identifiable due to low degree of crown mineralization.
Centre of the bottom: on premolars, defined as the centre of the furcation, centre of the root cones or centre of the bottom of the crown if root development had not begun.
Centre of the bottom: on canines, defined as the centre of the root cones or centre of the bottom of the crown if root development had not begun.
Fig. 5.
Skeletal landmarks illustrated in the lateral and frontal aspects.
Fig. 6.
Dental landmarks illustrated on a mandibular left canine, second left premolar and first left molar. The top and bottom landmarks on the molar are not shown. (Modified from Carlsen, 1987.)
Registration
Registration of growth in a patient and comparison of growth within the sample were carried out using least-squares estimation (Press et al. 1992) of the best fit between 3D landmarks representing homologous points in pairs of landmark datasets. In those cases where anatomical landmarks could not be found, pseudo-landmarks along an anatomical structure were identified instead (for the mandibular canal and the symphysis menti). The registration problem was solved by use of the Iterative Closest Point Algorithm (Zhang, 1994), which iteratively employs the following two steps until convergence. (1) At every spatial point on the reference mandible, estimate an approximate homologous point on the structure to be registered by use of closest points. (2) Move the structure to be registered after estimating the best fit by use of the method of least squares (Press et al. 1992).
Analysis
For growth measurements, morphology was represented by landmarks (Tables 1 and 2).
The growth of a specific anatomical structure in a patient was defined as the displacement vector from the coordinates of a landmark at examination 1 to the coordinates of the same landmark at examination 2.
Statistical methods
The error of the method for landmark localization and placement on mandible, teeth, vacuoles and mental foramina was determined using s(i), encompassing both systematic and random error. s(i) has been used by many orthodontic investigators and represents the mean square error (Dahlberg, 1940; Houston, 1983). s(i) is defined as √(Σ d2/2N), where d = x1 − x2. x1 and x2 are the coordinates of a landmark at the first and second digitization, respectively, and N is the number of paired measurements.
Spline curves were fitted to the sequential landmarks digitized along the mandibular canal and the inner cortical surface of the symphysis menti. The mandibular canals and the symphysis menti from the same scan were grouped. The difference between duplicate digitizations of the same grouping was determined using the Iterative Closest Point Algorithm. This routine was repeated until little or no change was observed. The error s(i) between corresponding points was then calculated as  ,
,  = the mean distance between spline curve groupings derived from the first and second digitization. The numerical value of s(i) will be similar to the numerical value of s(i), calculated from d. The computation of variables and statistical data was carried out by use of IDL (Interactive Data Language, 1997).
Results
Error of the method
The error of the landmark digitization was determined by duplicate digitizations. The difference between the first and the second digitization ranged from 0.008 to 3.381 mm for the skeletal landmarks (Table 3) and from 0.030 to 2.423 mm for the dental landmarks (Table 4). [M3b, M2b, M1b, P2b, P1b and Cb excluded because bottom landmarks, used only for orientation, in some cases were placed in a different level, i.e. slice, than used in the first digitization.] The s(i) values ranged from 0.357 to 0.816 mm and 0.271 to 0.770 mm, respectively.
Table 3.
Calculated method errors (mm) for skeletal landmarks (Fig. 5). Right side and left side combined
| Name | n | s(i) | s | min | max | |
|---|---|---|---|---|---|---|
| Id | 46 | 0.541 | 0.463 | 0.373 | 0.076 | 2.276 |
| Sm | 43 | 0.428 | 0.357 | 0.272 | 0.120 | 1.249 |
| Pg | 43 | 0.599 | 0.571 | 0.549 | 0.112 | 2.837 |
| Pgn | 39 | 0.730 | 0.654 | 0.576 | 0.043 | 2.308 |
| Gn | 41 | 0.852 | 0.766 | 0.678 | 0.111 | 2.475 |
| Sp | 46 | 0.899 | 0.816 | 0.732 | 0.041 | 2.870 |
| ag | 91 | 0.742 | 0.673 | 0.599 | 0.008 | 3.381 |
| mlp | 90 | 0.596 | 0.503 | 0.390 | 0.051 | 2.161 |
| ap | 92 | 0.862 | 0.752 | 0.626 | 0.039 | 2.504 |
| cdi | 94 | 0.726 | 0.620 | 0.496 | 0.049 | 2.606 |
| cd | 94 | 0.663 | 0.593 | 0.516 | 0.040 | 2.452 |
| im | 94 | 0.485 | 0.444 | 0.402 | 0.030 | 2.062 |
| pc | 94 | 0.466 | 0.383 | 0.276 | 0.019 | 1.190 |
| ra | 94 | 0.807 | 0.696 | 0.565 | 0.055 | 2.759 |
| cdl | 92 | 0.475 | 0.400 | 0.310 | 0.051 | 1.484 |
| cdm | 92 | 0.756 | 0.623 | 0.455 | 0.041 | 2.450 |
| Mf | 80 | 0.860 | 0.701 | 0.498 | 0.098 | 2.320 |
Table 4.
Calculated method errors (mm) for dental landmarks (Fig. 6). Right side and left side combined
| Name | n | s(i) | s | min | max | |
|---|---|---|---|---|---|---|
| M3mf | 2 | – | – | – | – | – |
| M3cf | 2 | – | – | – | – | – |
| M3df | 2 | – | – | – | – | – |
| M3ml | 2 | – | – | – | – | – |
| M3dl | 2 | – | – | – | – | – |
| M3t | 6 | 0.709 | 0.554 | 0.365 | 0.052 | 1.172 |
| M2(4)mf | 10 | 0.412 | 0.409 | 0.429 | 0.061 | 1.506 |
| M2(4)cf | 10 | 0.397 | 0.317 | 0.218 | 0.128 | 0.807 |
| M2(4)ml | 10 | 0.314 | 0.271 | 0.231 | 0.042 | 0.866 |
| M2(4)dl | 10 | 0.402 | 0.339 | 0.274 | 0.061 | 0.921 |
| M2(5)mf | 16 | 0.458 | 0.408 | 0.363 | 0.066 | 1.520 |
| M2(5)cf | 16 | 0.379 | 0.297 | 0.187 | 0.130 | 0.754 |
| M2(5)df | 16 | 0.482 | 0.490 | 0.514 | 0.073 | 2.021 |
| M2(5)ml | 16 | 0.512 | 0.442 | 0.371 | 0.191 | 1.674 |
| M2(5)dl | 16 | 0.523 | 0.474 | 0.432 | 0.059 | 1.448 |
| M2t | 32 | 0.554 | 0.454 | 0.329 | 0.123 | 1.334 |
| M1(5)mf | 68 | 0.448 | 0.444 | 0.444 | 0.062 | 2.131 |
| M1(5)cf | 68 | 0.365 | 0.347 | 0.330 | 0.043 | 1.824 |
| M1(5)df | 68 | 0.468 | 0.420 | 0.369 | 0.045 | 1.729 |
| M1(5)ml | 68 | 0.462 | 0.395 | 0.317 | 0.030 | 1.515 |
| M1(5)dl | 68 | 0.491 | 0.428 | 0.356 | 0.067 | 1.720 |
| M1t | 66 | 0.533 | 0.435 | 0.311 | 0.072 | 1.672 |
| P2f | 12 | 0.597 | 0.550 | 0.521 | 0.040 | 1.590 |
| P2(3)ml | 10 | 0.671 | 0.610 | 0.572 | 0.194 | 2.210 |
| P2(3)dl | 10 | 0.552 | 0.434 | 0.283 | 0.222 | 1.031 |
| P2(2)l | 2 | – | – | – | – | – |
| P2t | 8 | 0.585 | 0.474 | 0.350 | 0.201 | 1.142 |
| P1f | 14 | 0.496 | 0.421 | 0.343 | 0.058 | 1.461 |
| P1(2)l | 14 | 0.881 | 0.770 | 0.664 | 0.243 | 2.423 |
| Pt | 26 | 0.561 | 0.451 | 0.310 | 0.068 | 1.154 |
| Cf | 70 | 0.692 | 0.614 | 0.529 | 0.083 | 2.240 |
| M3b* | 6 | 0.590 | 0.459 | 0.297 | 0.130 | 0.943 |
| M2b* | 32 | 0.599 | 0.736 | 0.865 | 0.100 | 5.149 |
| M1b* | 66 | 0.577 | 0.618 | 0.661 | 0.088 | 5.076 |
| P2b* | 20 | 0.404 | 0.329 | 0.237 | 0.133 | 1.105 |
| P1b* | 40 | 0.405 | 0.333 | 0.243 | 0.103 | 1.196 |
| Cb* | 70 | 0.624 | 0.601 | 0.581 | 0.064 | 3.092 |
| M3vac | 6 | 0.753 | 0.711 | 0.729 | 0.245 | 2.089 |
| M2vac | 38 | 0.612 | 0.603 | 0.603 | 0.055 | 2.319 |
| M1vac | 42 | 0.602 | 0.632 | 0.668 | 0.079 | 2.372 |
These points were excluded from the analysis as bottom landmarks, used only for orientation, in some cases were placed in a different level, i.e. slice, than used in the first digitization.
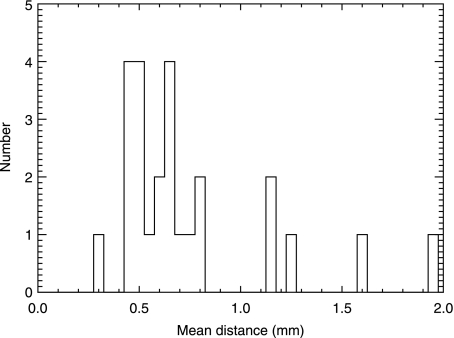
The error of the pseudo-landmark digitization determined by duplicate digitizations is given in Table 5. The mean s(i) value was 0.589 mm. The histogram distribution of the mean difference,  , between the first and the second digitization is illustrated in Fig. 7. As can be seen from the figure, 20 of the 25 mean values (80%) were below 1 mm.
Table 5.
Calculated method errors (mm), for spline curve groupings. N = 25
Mean ∑
|
Mean s(i) | s | |
|---|---|---|---|
| Spline curve groupings | 0.742 | 0.589 | 0.380 |
Fig. 7.
Histogram distribution of the mean difference,  , between the first and the second digitization (N = 25).
Mandibular growth
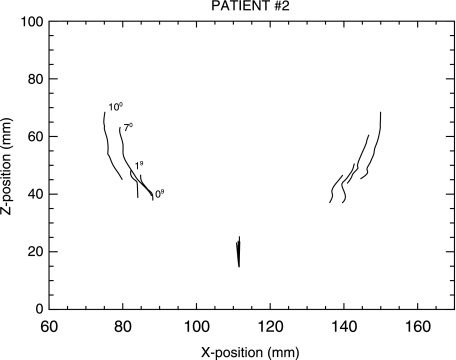
Mandibular growth was documented by superimposed computed plots (frontal and lateral views) of each of the ten patients. The superimpositions were performed using the symphysis menti and the mandibular canals at each stage. Superimposed plots of one representative case are shown in Figs. 8 and 9.
Fig. 8.
Patient no. 2. Frontal view. Superimposed computed plots showing the symphysis menti and the mandibular canals at four different ages (0, 1, 7 and 10 years), as indicated in the figure.
Fig. 9.
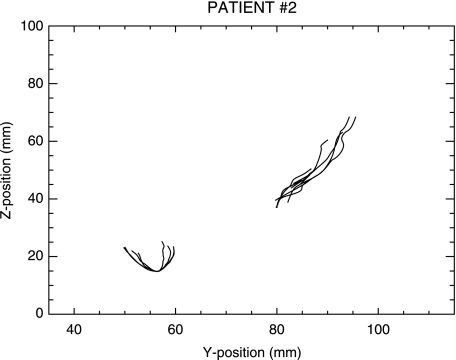
Patient no. 2. Lateral view. Superimposed computed plots showing the symphysis menti and the mandibular canals at four different ages (0, 1, 7 and 10 years).
The qualitative analysis of the plots revealed the following common features. (1) The symphysis menti showed an increase in antero-posterior width, primarily as a consequence of bone apposition posteriorly. (2) In lateral view, the curvature of the mandibular canals remained relatively stable over time, and the canals increased in length posteriorly. (3) In frontal view the mandibular canals revealed a lateral shift in all cases.
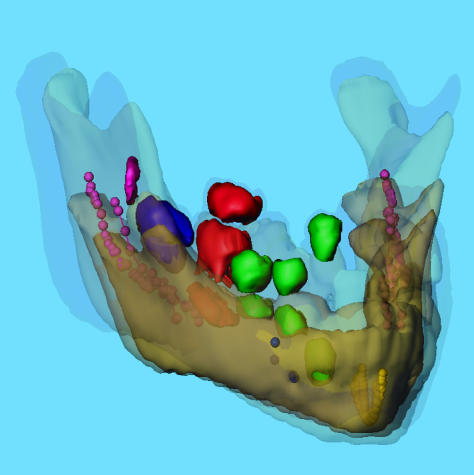
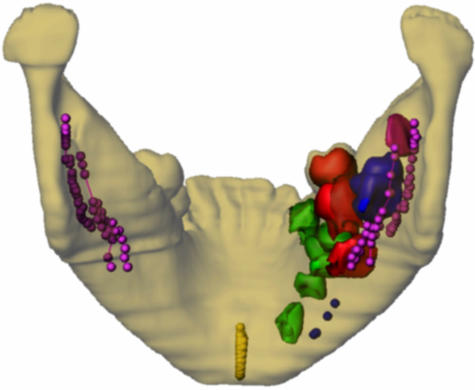
Inspecting the superimposed surface model (Fig. 10), it could be observed that the remodelling pattern had the following characteristics: (1) bone apposition at the condyle, coronoid process, alveolar process, posterior aspect of the ramus, and on the labial/buccal surface of the mandible; and (2) bone resorption at the anterior aspect of the ramus, underneath the gonion and on the lingual aspect of the body of the mandible, especially in the regions of the coronoid process, the ramus, and the condyle.
Fig. 10.
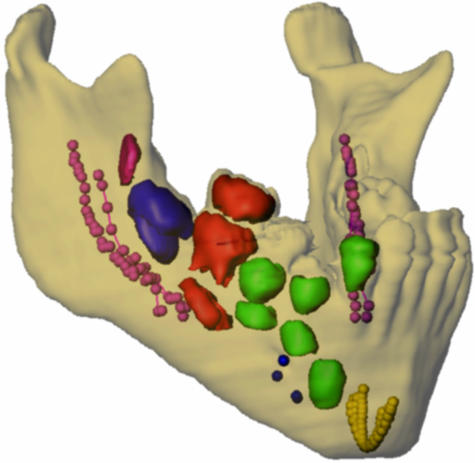
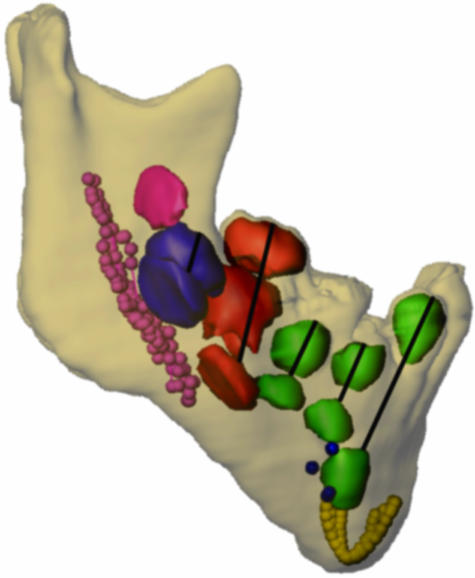
Patient no. 2. Oblique view. Three-dimensional superimposition of transparent mandibles at four different ages (0, 1, 7 and 10 years). Mental foramina, and segmented teeth (posterior to the incisors) from four different ages (0, 1, 7 and 10 years) are aligned automatically on the symphysis menti and the mandibular canals. Only the teeth and the mental foramen on the right side are illustrated. Tooth colour code: purple = permanent third molar, blue = permanent second molar, red = permanent first molar, and green = permanent premolars and the permanent canine. The mental foramen = blue. The symphysis menti = yellow. The mandibular canals = pink.
Tooth eruption
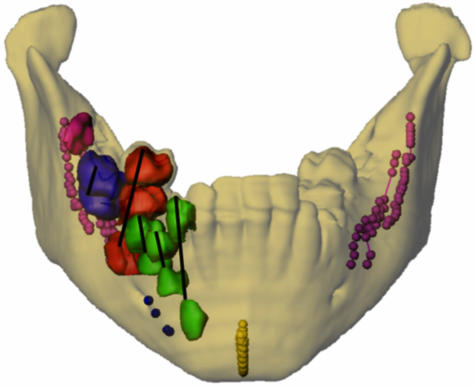
A qualitative analysis of the superimposed surface model with segmentation of the permanent teeth posterior to the incisors (Figs. 10–14) showed that the first and second molars erupted in a lingual direction whereas the canines and premolars seemed to erupt in an almost straight vertical direction seen in the frontal plane (Fig. 11). In addition, the study showed that teeth which have not started to develop the root remain relatively stable inside the jaw during that period.
Fig. 14.
Patient no. 2. Oblique view. For colour coding see Fig. 10.
Fig. 11.
Patient no. 2. Frontal view. Transparent mandible at age 10 years. Mental foramina, and segmented teeth (posterior to the incisors) from four different ages (0, 1, 7 and 10 years) are aligned automatically on the symphysis menti and the mandibular canals. Only the teeth and the mental foramen on the right side are illustrated. Lines indicate the eruption paths of the individual teeth. For colour coding see Fig. 10.
Discussion
The purpose of the present study was to analyse normal mandibular growth and tooth eruption in three dimensions, extending the principles of mandibular superimposition on ‘stable natural anatomical reference structures’ (Björk, 1969; Björk & Skieller, 1983) from two to three dimensions, thereby testing the paradigm related to the stability of these structures. A few previous studies have attempted to analyse mandibular growth in three dimensions. Radlanski et al. (1994, 2003) studied fetal mandibular development cross-sectionally from histological serial sections. Tsai et al. (2004) studied fetal mandibular development with use of serial 3D sonography. However, no comprehensive study of postnatal mandibular growth and eruption of the permanent teeth has previously been carried out.
Longitudinal craniofacial CT data were available in ten patients with Apert syndrome, and the mandibles from these ten patients were included in the study, as previous reports have documented that the development of the mandible is normal in Apert syndrome (Kreiborg et al. 1999).
Tooth eruption is also fairly normal in the syndrome, although it can be somewhat delayed, but this is primarily true in the hypoplastic maxilla and not in the mandible (Kreiborg & Cohen, 1992; Kaloust et al. 1997). The direction of eruption of the mandibular permanent teeth could, however, be influenced by the narrow, hypoplastic maxilla (Kreiborg et al. 1999), leading to a more lingual direction of tooth eruption than normal.
The error of the landmark digitization determined by duplicate digitizations was found to be within reasonable limits compared with previous findings both in three dimensions (Schleidt, 2002) and in two dimensions (Solow, 1966; Kreiborg, 1981).
The error of the pseudo-landmark digitization was also found to be of an acceptable magnitude, with 80% of the mean differences, d, between the first and the second digitization being below 1 mm, and no errors exceeding 2 mm.
Thus, it can be concluded that both the chosen skeletal and dental landmarks and the pseudo-landmarks can be employed in the analysis of mandibular development and tooth eruption.
By superimposing the longitudinal datasets for each patient on the symphysis menti and the mandibular canals using the automatic method described, mandibular growth was evaluated quantitatively from superimposed computed plots of the symphysis menti and the mandibular canals in the frontal and lateral views of all ten cases.
The results showed that the symphysis menti increased in antero-posterior width, primarily as a consequence of bone apposition posteriorly. This finding is in agreement with the 2D findings of Björk & Skieller (1983). In lateral view, the curvature of the mandibular canals remained relatively stable over time, which was also observed in the 2D studies of Björk (1969) and Björk & Skieller (1983).
However, in the frontal plane, all ten cases showed a lateral shift of the mandibular canals during growth. This phenomenon has never previously been reported in the literature. This lateral shift could be either the result of a remodelling process or an indication of actual dynamic change in the form of the mandible. The symphysis menti usually fuses during the first year of life (Björk, 1966). However, from birth to 1 year of life a growth in width of the mandible could probably occur at the site of the symphysis menti. Because the first CT scan was obtained prior to 1 year of age in nine of the ten cases, some of the early transverse shift of the mandibular canals could probably be explained by growth in the symphysis menti. However, after the fusion of the symphysis menti the most likely explanation of the lateral shift of the mandibular canals would seem to be bone remodelling with resorption on the buccal side and apposition on the lingual side of the canals. This explanation would seem reasonable given the observed remodelling of the bone surfaces of the mandible showing apposition on the buccal side and resorption on the lingual side. The observed surface remodelling of the mandible in terms of bone apposition at the condyle, coronoid process, alveolar process and posterior aspect of the ramus, and bone resorption at the anterior aspect of the ramus and underneath the gonion is in agreement with previous 2D findings (Björk & Skieller, 1983).
Very few attempts to analyse tooth eruption in three dimensions have previously been made and these studies have been limited to one case (Kreiborg et al. 1996a,b). The findings of the present study were purely qualitative, but they seem to support the hypothesis of Björk (1969) that teeth that have not started forming the root are relatively stable in their position inside the jaw.
Furthermore, the direction of tooth eruption would seem to be vertical for premolars and canines, whereas the mandibular molars seem to have a lingually inclined eruption path. This finding is probably related to the inclination of the teeth inside the jaw, but in the present sample the lingual eruption path could have been influenced by the hypoplastic and narrow maxilla characteristic of subjects with Apert syndrome, as mentioned above (Kreiborg et al. 1999).
In conclusion, the present study would seem to support the paradigm of stability of the symphysis menti and the mandibular canals as seen in profile view. However, the study showed, for the first time, that the mandibular canals are actually relocated laterally during growth, probably primarily due to bone remodelling.
Further research within this field is needed, using 3D techniques, and the methods that we have developed and validated in this study should be used in future studies.
Fig. 12.
Patient no. 2. Posterior view. For colour coding see Fig. 10.
Fig. 13.
Patient no. 2. Lateral view. Lines indicate the eruption paths of the individual teeth. For colour coding see Fig. 10.
References
- Abbott AH, Netherway DJ, David DJ, Brown T. Application and comparison of techniques for three dimensional analysis of craniofacial anomalies. J Craniofac Surg. 1990;1:119–134. doi: 10.1097/00001665-199001030-00001. [DOI] [PubMed] [Google Scholar]
- Abbott AH, Netherway DJ, Niemann DB, et al. CT-determined intracranial volume for a normal population. J Craniofac Surg. 2000;11:211–223. doi: 10.1097/00001665-200011030-00002. [DOI] [PubMed] [Google Scholar]
- AnalyzeDirect. Analyze. 1999. Version 3.1. ©1999-2001 AnalyzeDirect and ©1986-2001 Mayo Foundation for Medical Education and Research.
- Anamedic. Mvox. 1999. version 1.41. ©1999 Anamedic & Morten Bro-Nielsen.
- Andresen PR, Bookstein FL, Conradsen K, Ersbøll BK, Marsh JL, Kreiborg S. Surface-bounded growth modelling applied to human mandibles. IEEE Trans Med Imaging. 2000;19:1053–1063. doi: 10.1109/42.896780. [DOI] [PubMed] [Google Scholar]
- Björk A. Some biological aspects of prognathism and occlusion of the teeth. Angle Orthod. 1951;21:3–21. doi: 10.1043/0003-3219(1951)021<0003:SBAOPA>2.0.CO;2. [DOI] [PubMed] [Google Scholar]
- Björk A. Facial growth in man, studied with the aid of metallic implants. Acta Odontol Scand. 1955;13:9–34. doi: 10.3109/00016355509028170. [DOI] [PubMed] [Google Scholar]
- Björk A. Käkarnas tillväxt och utveckling i relation till kraniet i dess helhet. In: Holst JJ, Østby BN, Osvald O, editors. Nordisk Klinisk Odontologi I–V, I, 1. Copenhagen: Forlaget for Faglitteratur; 1966. pp. 1–44. [Google Scholar]
- Björk A. The use of metallic implants in the study of facial growth in children: method and application. Am J Phys Anthropol. 1968;29:243–254. doi: 10.1002/ajpa.1330290217. [DOI] [PubMed] [Google Scholar]
- Björk A, Kuroda T. Congenital bilateral hypoplasia of the mandibular condyles associated with congenital bilateral palpebral ptosis. Am J Orthod. 1968;54:584–600. doi: 10.1016/0002-9416(68)90179-6. [DOI] [PubMed] [Google Scholar]
- Björk A. Prediction of mandibular growth rotation. Am J Orthod. 1969;55:585–599. doi: 10.1016/0002-9416(69)90036-0. [DOI] [PubMed] [Google Scholar]
- Björk A, Skieller V. Facial growth and tooth eruption. An implant study at the age of puberty. Am J Orthod. 1972;62:339–383. doi: 10.1016/s0002-9416(72)90277-1. [DOI] [PubMed] [Google Scholar]
- Björk A, Skieller V. Normal and abnormal growth of the mandible. A synthesis of longitudinal cephalometric implant studies over a period of 25 years. Eur J Orthod. 1983;5:1–46. doi: 10.1093/ejo/5.1.1. [DOI] [PubMed] [Google Scholar]
- Broadbent BH. A new x-ray technique and its application to orthodontia. Angle Orthod. 1931;1:45–66. [Google Scholar]
- Bro-Nielsen M, Larsen P, Kreiborg S. Virtual teeth: a 3D method for editing and visualizing small structures in CT scans. In: Lemke HU, Vannier MW, Inamura K, Farman AG, editors. Computer Assisted Radiology. Amsterdam: Elsevier; 1996. pp. 921–924. [Google Scholar]
- Bro-Nielsen M, Gramkow C, Kreiborg S. Non-rigid registration using bone growth model. In: Troccaz J, Grimson E, Mösges R, editors. Lecture Notes in Computer Science 1205. Berlin: Springer; 1997. pp. 3–12. [Google Scholar]
- Carlsen O. Dental Morphology. Copenhagen: Munksgaard; 1987. [Google Scholar]
- Cavalcanti MG, Vannier MW. Quantitative analysis of spiral computed tomography for craniofacial clinical applications. Dentomaxillofac Radiol. 1998;27:344–350. doi: 10.1038/sj/dmfr/4600389. [DOI] [PubMed] [Google Scholar]
- Cohen MM., Jr . Apert syndrome. In: Cohen M Jr, MacLean R, editors. Craniosynostosis Diagnosis, Evaluation, and Management. New York: Oxford University Press; 2000. pp. 316–353. [Google Scholar]
- Dahlberg G. Statistical Methods for Medical and Biological Students. New York: Interscience Publications; 1940. [Google Scholar]
- Dryden IL, Mardia KV. Statistical Shape Analysis. Chichester: John Wiley & Sons; 1998. [Google Scholar]
- Hermann NV, Jensen BL, Dahl E, Darvann TA, Kreiborg S. A method for three projection infant cephalometry. Cleft Palate Craniofac J. 2001;38:300–316. doi: 10.1597/1545-1569_2001_038_0299_amftpi_2.0.co_2. [DOI] [PubMed] [Google Scholar]
- Hilger KB, Larsen P, Kreiborg S, Darvann TA, Marsh JL. Active shape analysis of mandibular growth. In: Ellis RE, Peters TM, editors. Medical Image Computing and Computer-Assisted Intervention (MICCAI) 2003. Berlin: Springer Uerlag; 2003. pp. 902–909. [Google Scholar]
- Hofrath H. Die Bedeutung der Röntgenfern- und Abstandsaufnahme für die Diagnostik der. Kieferanomalien. Fortschr Orthod. 1931;1:232–258. [Google Scholar]
- Houston WJB. The analysis of errors in orthodontic measurements. Am J Orthod. 1983;83:382–390. doi: 10.1016/0002-9416(83)90322-6. [DOI] [PubMed] [Google Scholar]
- IDL Research Systems. Interactive Data Language. Boulder, CO: IDL Research Systems; 1997. [Google Scholar]
- Kaloust S, Ishii K, Vargervik K. Dental development in Apert syndrome. Cleft Palate Craniofac J. 1997;34:117–121. doi: 10.1597/1545-1569_1997_034_0117_ddias_2.3.co_2. [DOI] [PubMed] [Google Scholar]
- Kane AA, Kim YO, Eaton A, Pilgram TK, Marsh JL, Zonneveld F. Quantification of osseous facial dysmorphology in untreated unilateral coronal synostosis. Plast Reconstr Surg. 2000;106:251–258. doi: 10.1097/00006534-200008000-00001. [DOI] [PubMed] [Google Scholar]
- Kreiborg S, Dahl E, Prydsoe U. A unit for infant roentgencephalometry. Dentomaxillofac Radiol. 1977;6:107–111. doi: 10.1259/dmfr.1977.0015. [DOI] [PubMed] [Google Scholar]
- Kreiborg S. Crouzon syndrome. A clinical and roentgencephalometric study. Scand J Plast Reconstr Surg. 1981;(Suppl. 18):1–198. [PubMed] [Google Scholar]
- Kreiborg S. The application of roentgencephalometry to the study of craniofacial anomalies. J Craniofac Genet Dev Biol Suppl. 1985;1(1):31–41. [PubMed] [Google Scholar]
- Kreiborg S, Cohen MM., Jr The oral manifestations of Apert syndrome. J Craniofac Genet Dev Biol. 1992;12:41–48. [PubMed] [Google Scholar]
- Kreiborg S, Marsh JL, Cohen MM, Jr, Liversage M, Pedersen H, Skovby F. Comparative three-dimensional analysis of CT-scans of the calvaria and cranial base in Apert and Crouzon syndromes. J Cranio-Max-Fac Surg. 1993;21:181–188. doi: 10.1016/s1010-5182(05)80478-0. [DOI] [PubMed] [Google Scholar]
- Kreiborg S, Bro-Nielsen M, Larsen P, Darvann T, Dirksen K-L, Skovby F. En ny metode til tredimensional analyse af tanddannelse og -eruption. Tandlægebladet. 1996a;100:57–58. [Google Scholar]
- Kreiborg S, Larsen P, Bro-Nielsen M, Darvann T. A 3-dimensional analysis of tooth formation and eruption in a case of Apert syndrome. In: Lemke HU, Vannier MW, Inamura K, Farman AG, editors. Computer Assisted Radiology. Amsterdam: Elsevier; 1996b. pp. 1066–1068. [Google Scholar]
- Kreiborg S, Aduss H, Cohen MM., Jr Cephalometric study of the Apert syndrome in adolescence and adulthood. J Craniofac Genet Dev Biol. 1999;19:1–11. [PubMed] [Google Scholar]
- Kreiborg S, Larsen P, Schleidt DT, Darvann TA, Hermann NV, Dobrzeniecki AB. New technologies for assessment of craniofacial growth. In: Kuijpers-Jagtman A-M, Leunisse M, editors. Orthodontics at the Turn of the Century. Nijmegen: Nederlandse Vereniging voor Orthodontische Studie; 2001. pp. 181–188. [Google Scholar]
- Lo LJ, Marsh JL, Kane AA, Vannier MW. Orbital dysmorphology in unilateral coronal synostosis. Cleft Palate Craniofac J. 1996;33:190–197. doi: 10.1597/1545-1569_1996_033_0190_odiucs_2.3.co_2. [DOI] [PubMed] [Google Scholar]
- Marsh JL, Vannier MW. Surface imaging from computerized tomographic scans. Surgery. 1983;94:159–165. [PubMed] [Google Scholar]
- Marsh JL, Galic M, Vannier MW. The craniofacial anatomy of Apert syndrome. Clin Plast Surg. 1991;18:237–249. [PubMed] [Google Scholar]
- Press WH, Teukolsky SA, Vetterling WT, Flannery BP. Numerical Recipes in C: the Art of Scientific Computing. 2nd. New York: Cambridge University Press; 1992. [Google Scholar]
- Pruzansky S, Lis EF. Cephalometric roentgenography of infants: sedation, instrumentation, and research. Am J Orthod. 1958;44:159–186. [Google Scholar]
- Radlanski RJ, Kjaer I, Vastardis H, Renz H. Morphometric studies on the fetal development of the human mandible. Fortschr Kieferorthop. 1994;55:77–83. doi: 10.1007/BF02174360. [DOI] [PubMed] [Google Scholar]
- Radlanski RJ, Renz H, Klarkowski MC. Prenatal development of the human mandible. 3D reconstructions, morphometry and bone remodelling pattern, sizes 12–117 mm CRL. Anat Embryol. 2003;207:221–232. doi: 10.1007/s00429-003-0343-4. [DOI] [PubMed] [Google Scholar]
- Ricketts RM. Perspectives in the clinical application of cephalometrics. Angle Orthod. 1981;51:115–150. doi: 10.1043/0003-3219(1981)051<0115:PITCAO>2.0.CO;2. [DOI] [PubMed] [Google Scholar]
- Schleidt DT. Validation of three-dimensional craniofacial imaging of computed tomography. University of Copenhagen: 2002. [Google Scholar]
- Solow B. The pattern of craniofacial association. A morphological and methodological correlation and factor analysis study on young male adults. Acta Odontol Scand. 1966;24(Suppl. 46):1–174. [Google Scholar]
- Solow B, Kreiborg S. A cephalometric unit for research and hospital environments. Eur J Orthod. 1988;10:346–352. doi: 10.1093/ejo/10.4.346. [DOI] [PubMed] [Google Scholar]
- Tsai M-Y, Lan K-C, Ou C-Y, Chen J-H, Chang S-Y, Hsu T-Y. Assessment of the facial features and chin development of fetuses with use of serial three-dimensional sonography and the mandibular size monogram in a Chinese population. Am J Obst Gyn. 2004;190:541–546. doi: 10.1016/j.ajog.2003.07.031. [DOI] [PubMed] [Google Scholar]
- Vannier MW, Pilgram TK, Marsh JL, Kraemer BB, Rayne SC, Gado MH. Craniosynostosis: diagnostic imaging with three-dimensional CT presentation. Am J Neurorad. 1994;15:1861–1869. [PMC free article] [PubMed] [Google Scholar]
- Vannier MW, Marsh JL. Three-dimensional imaging, surgical planning, and image-guided surgery. Radiol Clin North Am. 1996;34:545–563. [PubMed] [Google Scholar]
- Walker GF. Summary of research report on the analysis of craniofacial growth. N Zealand Dent J. 1967;63:31–38. [PubMed] [Google Scholar]
- Zhang Z. Iterative point matching for registration of freeform curves and surfaces. Int J Computer Vision. 1994;13:119–152. [Google Scholar]
- Zumpano MP, Carson BS, Marsh JL, Vanderkolk CA, Richtsmeier JT. Three-dimensional morphological analysis of isolated metopic synostosis. Anat Rec. 1999;256:177–188. doi: 10.1002/(SICI)1097-0185(19991001)256:2<177::AID-AR8>3.0.CO;2-Q. [DOI] [PubMed] [Google Scholar]


