

Abstract
Characteristic features of noradrenaline (NA) and adenosine 5′-triphosphate (ATP) release from postganglionic sympathetic nerves in rat small mesenteric arteries in vitro have been investigated on an impulse-by-impulse basis. NA release was measured using continuous amperometry and ATP release was monitored by intracellular recording of excitatory junction potentials (e.j.ps).
Electrical stimuli evoked transient increases in oxidation current. During trains of ten stimuli at 0.5–4 Hz there was a depression in the amplitude of oxidation currents evoked following the first stimulus in the train.
The neuronal NA uptake inhibitor, desmethylimipramine (1 μM), increased the amplitude of the summed oxidation current evoked by ten stimuli at 1 Hz and slowed the decay of oxidation currents evoked by trains of ten stimuli at 1 and 10 Hz.
The α2-adrenoceptor antagonist, idazoxan (1 μM), increased the amplitudes of the oxidation currents evoked during trains of ten stimuli at 0.5–10 Hz but had no effect on the oxidation currents evoked by the first stimulus in the train.
Idazoxan (1 μM) increased the amplitude of all e.j.ps evoked during trains of stimuli at 0.5 and 1 Hz. In addition, the facilitatory effect of idazoxan on e.j.ps was significantly greater than that on oxidation currents.
The findings indicate that NA release from sympathetic nerves supplying small mesenteric arteries is regulated by activation of presynaptic α2-adrenoceptors and that clearance of released NA in this tissue depends, in part, upon neuronal uptake. The different effects of idazoxan on the oxidation currents and e.j.ps may indicate that the release of NA and ATP is differentially modulated.
Keywords: Noradrenaline release, ATP release, amperometry, rat mesenteric artery, excitatory junction potentials
Introduction
The release of noradrenaline (NA) from perivascular sympathetic nerve endings has primarily been investigated using tissues labelled with tritiated NA (e.g. Ramme et al., 1986; Cox et al., 1996). In a smaller number of studies the release of endogenous NA has been measured by high-performance liquid chromatography (e.g. Buchholz & Duckles, 1992). Because of the relatively low sensitivity of these techniques, it has usually been necessary to measure the efflux of NA evoked by long trains of electrical stimuli. For this reason, at present, almost nothing is known about the characteristics of NA release from perivascular sympathetic nerves on an impulse-by-impulse basis.
To investigate this question, Gonon et al. (1993) introduced continuous amperometry to monitor in ‘real' time NA release from sympathetic nerves innervating rat tail artery. This technique measures the stimulus evoked increase in NA concentration at the adventitial surface of the artery as an oxidation current, the amplitude of which is linearly related to concentration (Gonon et al., 1993; Brock et al., 1997). Using this electrochemical recording approach, it has been possible to monitor NA release in rat tail artery on an impulse-by-impulse basis during low frequency trains of stimulation (see Msghina et al., 1993; Brock et al., 1997; Brock & Cunnane, 1999).
The data obtained using continuous amperometry have been compared with electrophysiological measures of adenosine 5′-triphosphate (ATP) release from the sympathetic nerves (Brock et al., 1997; Brock & Cunnane, 1999). The electrophysiological studies have used intracellularly recorded excitatory junction potentials (e.j.ps) which provide an indirect measure of junctionally released ATP (see Brock & Cunnane, 1993). The results indicate that a variety of agents (e.g. β-adrenoceptor agonists and Ca2+ channel blockers) that are known to modify neurotransmitter release from sympathetic nerve terminals, similarly affect the oxidation currents and e.j.ps. Taken together these findings provide strong supporting evidence for the hypothesis that NA and ATP are co-released from the perivascular sympathetic nerve terminals in rat tail artery.
In the present study we have used continuous amperometry and intracellular recording of e.j.ps to monitor the release of NA and ATP evoked by short trains of stimuli from sympathetic nerves supplying rat mesenteric arteries with diameters <250 μm. Vessels of this diameter contribute significantly to the regulation of blood flow to the intestine (Christensen & Mulvany, 1993; Fenger-Gron et al., 1997). In particular, this study has determined the basic characteristics of NA release on an impulse-by-impulse basis during short trains of electrical stimuli and has investigated various mechanisms that may contribute to the kinetics of NA clearance. In addition, the effects of blocking presynaptic α2-adrenoceptors on oxidation currents and e.j.ps were investigated.
Methods
Female outbred Wistar rats (150–200 g) were killed by an overdose of pentobarbitone sodium (100 mg kg−1, i.p.). Segments of mesentery containing first and second order mesenteric arteries were dissected and pinned to the Sylgard (Dow-Corning) covered base of a 2 ml recording chamber. The chamber was perfused continuously at 3–5 ml min−1 with physiological saline of the following composition (mM): NaCl 133.4, NaHCO3 16.3, NaH2PO4 1.3, CaCl2 2.0, KCl 4.7, MgCl 1.2 and glucose 9.8. The physiological saline was gassed with a mixture of 95% O2 and 5% CO2 (to pH 7.4) and maintained at 35–36°C. The proximal end of the mesenteric artery and vein were cleared of fat and drawn into a suction electrode and the perivascular nerves excited by electrical field stimulation (0.5 ms, 20 V). Electrochemical and electrophysiological recordings were made from the surface of the second order arteries (Dunn & Gardiner, 1995) at a site 3–5 mm distal of the mouth of the suction stimulating electrode. At this site the connective tissue and fat cells were carefully removed to reveal the surface of the artery. Usually two tissues from the same animal were used, with the second being held in oxygenated physiological saline until required. No difference was detected in the properties or responses of the two preparations.
Electrochemical recording
The release of endogenous NA was measured by continuous amperometry using a technique similar to that previously described by Brock et al. (1997). The recording electrodes were constructed as previously described (Brock et al., 1997) but with the exposed length of carbon fibre cut to about 200 μm. Before use the electrode tips were dipped for 15–30 min in a 2.5% (w v−1) solution of Nafion (Aldrich Chemical Company, Castle Hill, NSW, Australia) and then left to dry for at least 1 h. This treatment reduced the decline in electrode sensitivity observed during prolonged periods of recording (see Brock et al., 1997).
The carbon fibre electrodes were mounted at about 30° to the horizontal and placed gently against the surface of the artery so that an approximately 100 μm length of carbon fibre was in contact with the surface of the artery. The electrode was connected to an AMU130 Nano-amperometer (Radiometer - Analytical S.A., 69627 Villeurbanne Cedex, France) and a potential difference of +0.3 V applied between the recording electrode and a Ag-AgCl pellet placed in the recording chamber medium. The current required to maintain this voltage was monitored.
After placement of the carbon fibre microelectrode, tissues were left for a 30 min period. Thereafter, in some experiments, a frequency-response curve was generated by stimulation with three trains of ten pulses (separated by 90 s) at frequencies between 0.5 and 10 Hz. In other experiments, tissues were stimulated with three trains of ten stimuli at 0.5, 1 and 10 Hz (each train separated by 90 s) before and 20 min following addition of experimental drugs to the superfusing solution. In control experiments in which no drug was added, the amplitude of the oxidation currents did not change detectably between the recording periods (n=6, paired t-tests).
Electrophysiological recording
In separate experiments intracellular recordings were made from smooth muscle cells located near the adventitial-medial border of the mesenteric artery with borosilicate glass microelectrodes (80–160 MΩ) filled with 0.5 M KCl and connected to an Axoclamp bridge amplifier (Axon Instruments, Inc, Foster City, CA, U.S.A.). The criteria for accepting impalements were the same as those adopted by Brock and Van Helden (1995). Membrane potentials were determined upon withdrawal of the microelectrode. The effects of idazoxan on e.j.ps evoked by trains of ten stimuli at 0.5 and 1 Hz amplitude were determined in single cell experiments in which both control and test recordings were made during the same impalement. In control experiments, no significant change in e.j.p amplitude was observed during recording periods lasting 20–30 min (n=6, paired t-test).
Data analysis
All data were digitized (sampling frequencies of 0.04–0.1 kHz) and collected with a MacLab recording system and the program Scope (ADInstruments Pty Ltd, Castle Hill, NSW, Australia). Subsequent analysis was made with the computer program Igor Pro (Wavemetrics, Lake Oswego, OR, U.S.A.). The electrochemical and electrophysiological records for individual tissues under each condition were averaged before measurements were made. In some electrochemistry experiments, stimulation produced a positive- or negative-going artefact that lasted about 100 ms (revealed in Cd2+ or tetrodotoxin treated tissues). Therefore, the amplitudes of the oxidation currents evoked during trains of stimuli at 0.5 and 1 Hz were determined by averaging the period 100–200 ms following each stimulus. In cases where the individual responses summed during the train of stimuli, the monoexponential time constant of decay of the signals was estimated and used to correct the baseline value. Comparisons were also made between the integrals of the oxidation currents evoked by the trains of stimuli at 0.5–10 Hz. Before integration of the electrochemical signals, the stimulus artefacts were blanked by setting the first 100 ms following each stimulus to zero.
Data are presented as mean±s.e.mean. The mono- and bi-exponential decay of the signals were fitted using the curve fitting functions in the computer program Igor Pro. Unless otherwise indicated, statistical comparisons were made using paired t-tests. In all tests P values <0.05 were considered to be significant. In all cases the number n refers to the number of tissues studied.
Drugs
Idazoxan, desmethylimipramine (DMI) prazosin and tetrodotoxin were supplied by Sigma Chemical Company (Castle Hill, NSW, Australia). Corticosterone was supplied by Aldrich Chemical Company (Castle Hill, NSW, Australia).
Results
Electrochemical detection of released NA
Figure 1a shows typical responses evoked by a single stimulus and by trains of ten stimuli at 0.5–10 Hz. A single stimulus produced a transient increase in oxidation current which peaked within 100 ms of the stimulus and then decayed monoexponentially within 2–3 s (decay time constant=0.50±0.11 s, n=9 experiments). During trains of ten pulses at frequencies of 0.5, 1, 2 and 4 Hz each stimulus during the train evoked a transient increase in oxidation current and the signals evoked by each successive stimulus summed with that remaining from the previous stimuli to produce a sustained increase in oxidation current. The first stimulus in the trains of stimuli at 0.5–4 Hz usually evoked the largest transient increase in oxidation current, the responses to subsequent stimuli being smaller in amplitude (Figure 1a and b, see also Figure 3a).
Figure 1.
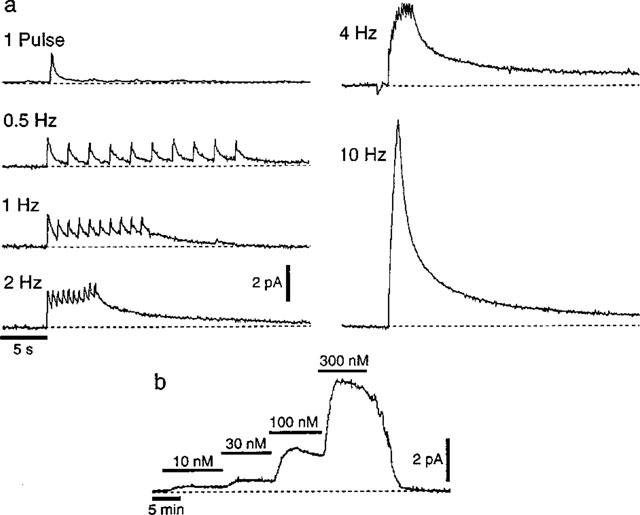
NA-induced oxidation currents recorded amperometrically with a carbon fibre electrode. (a) The responses evoked by a single electrical stimulus and by trains of ten electrical stimuli at 0.5, 1, 2, 4 and 10 Hz. (b) Trace recorded during the sequential addition of 10, 30, 100 and 100 nM NA to the physiological saline perfusing the recording chamber.
Figure 3.
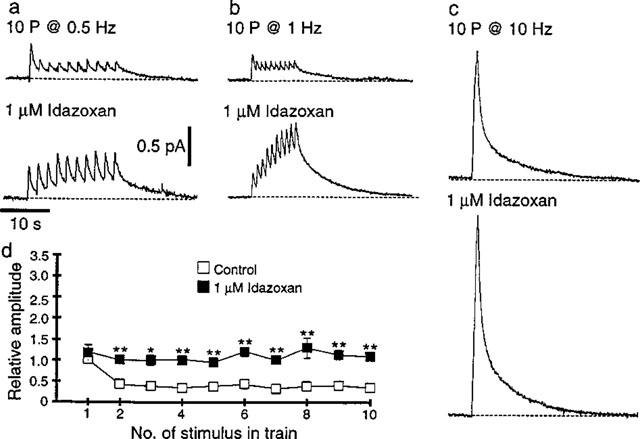
Effects of the α2-adrenoceptor antagonist, idazoxan (1 μM), on NA induced oxidation currents. (a–c) NA-induced oxidation current evoked by ten stimuli at 0.5 (a), 1 (b) and 10 Hz (c) before (upper traces) and 20 min following addition of idazoxan (lower traces). The scale bars in (a) also apply in (b) and (c). (d) Graph showing the effect of idazoxan on the amplitude of oxidation currents evoked during trains of ten stimuli at 1 Hz (n=6) *P<0.05, **P<0.01.
During trains of ten stimuli at 10 Hz, the stimulus artefact prevented the signals evoked by the individual stimuli being discerned, but summation of these signals produced large amplitude oxidation currents (Figure 1a). In six tissues the integrals of the oxidation currents evoked by the trains of ten stimuli at 0.5–10 Hz increased significantly with the frequency of stimulation (0.5 Hz, 5.1±1.5 pA s−1; 1 Hz, 5.9±1.7 pA s−1; 2 Hz, 7.4±2.6 pA s−1; 4 Hz, 10.1±4.4 pA s−1; 10 Hz 14.6±6.5 pA s−1; repeated measures ANOVA P<0.05).
At the end of the trains of stimuli, the decay of the oxidation currents was best fitted by the sum of two exponentials. Table 1 shows the fast (τ1) and slow (τ2) time constants of decay for the oxidation currents evoked by ten pulses at 1, 2, 4 and 10 Hz. The value of τ1 and τ2 did not change over the range of stimulation frequencies used (repeated measures ANOVA).
Table 1.
Effects of stimulation frequency on the fast (τ1) and slow (τ2) time constants of decay of oxidation currents
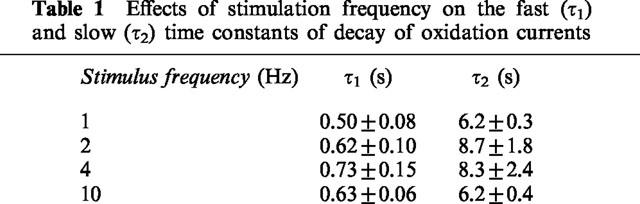
Figure 1b shows a trace recorded during the sequential addition of 10, 30, 100 and 300 nM NA to the solution perfusing the recording chamber. No electrochemical signals were evoked by electrical stimulation when the electrode potential was held at 0 V, a value below the oxidation potential for NA (n=9, Figure 2a). The oxidation currents evoked by electrical stimulation were abolished by tetrodotoxin (0.3 μM, n=6, Figure 2b) and by the non-selective Ca2+ channel blocker, Cd2+ (0.1 mM, n=18, Figure 2c).
Figure 2.
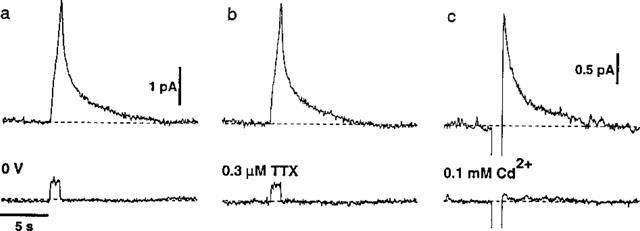
Effects of changing the electrode potential and of tetrodotoxin (0.3 μM, TTX) and Cd2+ (0.1 mM) on NA-induced oxidation currents evoked by trains of ten stimuli at 10 Hz. (a and b) Responses recorded in a single tissue under control conditions (upper traces) and when the electrode potential was held at 0 V (a, lower trace) and during application of TTX (b, lower trace). (c) Responses in another tissue before (upper trace) and during application of Cd2+ (lower trace). The ordinate scale bar in (a) also applies in (b) and the abscissa scale bar in (a) applies in (b) and (c).
Effects of idazoxan on electrochemical signals
In six experiments, application of the α2-adrenoceptor antagonist, idazoxan (1 μM), had no effect on the oxidation currents evoked by the first stimulus in the trains of ten pulses at 0.5 and 1 Hz, but those evoked by subsequent stimuli were significantly increased in amplitude (Figure 3a, b and d). The amplitude of the summed oxidation current measured at the end of the trains of stimuli at 0.5 and 1 Hz was increased by 165±45% (P<0.01) and 223±37% (P<0.01) respectively. Idazoxan also increased the amplitude of the oxidation currents evoked by ten pulses at 10 Hz by 63±10% (Figure 3c, n=6, P<0.01). The idazoxan-induced increase in amplitude at 1 and 10 Hz occurred without any significant change in values of τ1 or τ2 for the bi-exponential fits for the decay phase of the oxidation currents (1 Hz control τ1=0.47±0.08 s, τ2=10.2±2.4 s, 1 Hz idazoxan τ1=0.8± 0.16 s, τ2=9.5±1.4 s; 10 Hz Control τ1=0.77±0.08 s, τ2=7.9±1.0 s, 10 Hz idazoxan τ1=0.77±0.07 s, τ2=8.7 ±1.0 s).
In idazoxan treated tissues (n=5), application of the α1-adrenoceptor antagonist prazosin (0.1 μM) did not change the amplitude or the time course of the electrochemical signals evoked by ten pulses at 1 and 10 Hz (1 Hz per- centage change in amplitude=−7±4%, in τ1=−5±21% and in τ2=−5±5%; 10 Hz percentage change in amplitude=−2±6%, in τ1=−2±2% and in τ2=−5±2%).
Effect of DMI on electrochemical signals
Application of the neuronal NA uptake (uptake1) blocker, DMI (1 μM), did not significantly change the amplitude of oxidation currents evoked by single stimuli (Figure 4a and b, percentage change=−11±11%, n=7) or by ten stimuli at 10 Hz (Figure 4e and f, percentage change=+11±7, n=9) but significantly increased the amplitude of the summed oxidation current measured at the end of the trains of stimuli at 1 Hz by 39±12% (Figure 4c and d, P<0.05, n=6). In tissues treated with idazoxan to block α-adrenoceptor mediated autoinhibition, DMI still had no effect on the amplitude of responses to ten stimuli at 10 Hz (percentage change=−1±8%, n=5) but significantly increased the amplitude of the summed oxidation current evoked by ten stimuli at 1 Hz (percentage increase=20±8%, P<0.05, n=5). Thus the failure to detect an effect of DMI on the amplitude of responses evoked by ten stimuli at 10 Hz cannot be attributed to an increase in α-adrenoceptor-mediated autoinhibition.
Figure 4.

Effects of the NA uptake inhibitor desmethylimipramine (1 μM, DMI) on NA-induced oxidation currents evoked by a single stimulus (a and b) and by trains of ten stimuli at 1 (c and d) and 10 Hz (e and f). (a, c and e) Traces recorded before and 20 min following addition of DMI (indicated by the arrowhead). The scale bars in (e) also apply in (c). (b, d and f) Graphs showing the mean effects of DMI (indicated by the arrowhead) on the decay of the electrochemical signals (n=7 in (b), 6 in (d) and 9 in (f)). *P<0.05.
DMI had no significant effect on time course of decay of the oxidation currents evoked by single stimuli (Figure 4b) but slowed the decay of the signals evoked by trains of ten stimuli at 1 and 10 Hz (Figure 4d and f). As with the control signals, the decay phase of the oxidation currents evoked by single stimuli in the presence of DMI was best fitted by a single exponential while that of the signals evoked by trains at 1 and 10 Hz was best fitted by the sum of two exponentials. In comparison with the control values, DMI had no significant effect on τ1 for the oxidation currents evoked by trains at 1 and 10 Hz but increased τ2 for both responses (Figure 4d and f).
Effects of corticosterone on electrochemical signals
In tissues treated with DMI (1 μM) and idazoxan (1 μM), the addition of the uptake2 blocker, corticosterone (10 μM), did not significantly change the amplitude or time course of the electrochemical signals evoked by ten pulses at 1 and 10 Hz (1 Hz percentage change in amplitude=−7±5%, in τ1=8±18% and in τ2=8±5%, n=5; 10 Hz percentage change in amplitude=−5±5%, in τ1=−2±5% and in τ2=−2±5%, n=5), indicating that under the conditions of the experiment uptake2 does not contribute significantly to the clearance of NA in rat mesenteric arteries. This finding is similar to that reported for the rat tail artery (Stjärne et al., 1994).
Effects of idazoxan on e.j.ps
The effects of idazoxan (1 μM) on e.j.ps evoked by trains of ten stimuli at 0.5 and 1 Hz were also investigated. Under control conditions the e.j.ps evoked by the first five or so stimuli at 0.5 and 1 Hz initially increased in amplitude and then decreased to plateau level which was maintained for the duration of the train of stimuli (Figure 5a–c). Application of the α2-adrenoceptor antagonist, idazoxan (1 μM), produced a pronounced increase in the amplitudes of e.j.ps evoked during the trains of stimuli at 0.5 and 1 Hz (Figure 5a and b). In contrast to the electrochemical signals, idazoxan also significantly increased the amplitude of the e.j.ps evoked by the first stimulus in the trains of stimuli at 0.5 and 1 Hz (Figure 5a–c). However, as with the electrochemical signals, the magnitude of the idazoxan-induced facilitation of e.j.p amplitude increased during the trains of stimuli (Figure 6). Application of idazoxan did not change the smooth muscle resting membrane potential (control=−62±1 mV; idazoxan=−61±1 mV; n=6) or the e.j.p time constant of decay (control=435±48 ms; idazoxan=428±39 ms; n=6). Therefore none of the observed effects of idazoxan on e.j.ps can be attributed to changes in the electrical properties of the vascular smooth muscle.
Figure 5.
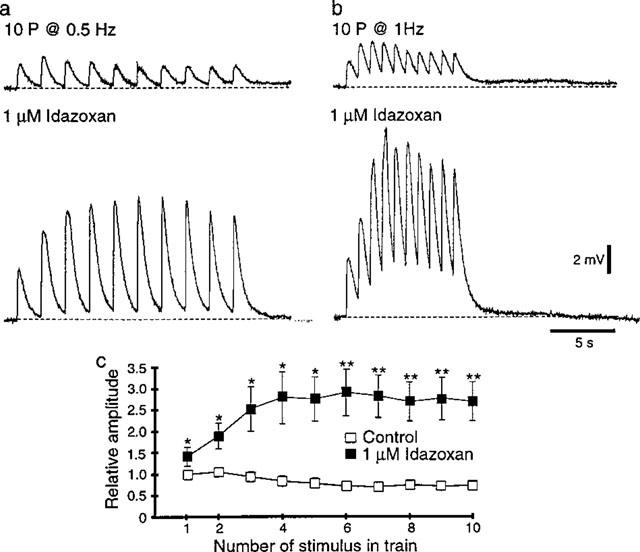
Effects of the α2-adrenoceptor antagonist, idazoxan (1 μM), on intracellularly recorded excitatory junction potentials (e.j.ps). (a and b) E.j.ps evoked by ten stimuli at 0.5 (a) and 1 Hz (b) before (upper trace) and 20 min following addition of idazoxan (lower traces). The scale bars in (b) also apply in (a). (c) Graph showing the effect of idazoxan on the amplitude of e.j.ps evoked during trains of ten stimuli at 1 Hz (n=6). *P<0.05, **P<0.01.
Figure 6.
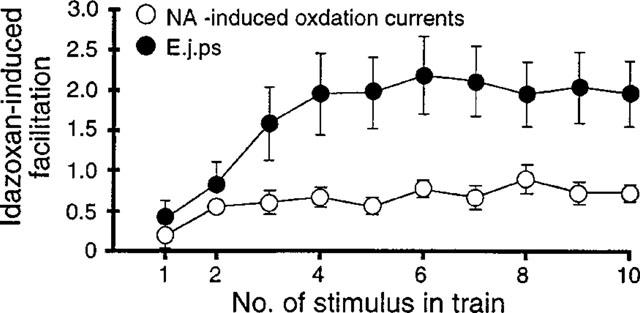
Graph showing the idazoxan-induced facilitation of NA-induced oxidation currents and excitatory junction potentials (e.j.ps) evoked during trains of ten stimuli at 1 Hz. Idazoxan-induced facilitation was calculated by dividing the amplitude of the idazoxan responses by that of the control responses and subtracting 1 (n=6 for both NA-induced oxidation currents and e.j.ps).
The findings with idazoxan indicate that in the rat mesenteric artery both NA and ATP release are modulated by α-adrenoceptor-mediated autoinhibition. However, in this tissue, the facilitatory effect of idaxoxan on e.j.ps was significantly greater than that on NA-induced oxidation currents (Figure 6, unpaired t-test P<0.05).
Discussion
Despite indirect evidence from functional studies implicating NA as the principal sympathetic neurotransmitter in small mesenteric arteries isolated from rats (Nilsson et al., 1986; Angus et al., 1988; Stephens et al., 1991), the present study represents the first direct demonstration of the release of endogenous NA from the sympathetic nerves supplying these resistance vessels. Electrical field stimulation of these arteries produced amperometric signals which were abolished in the presence of the voltage-dependent Na+ channel blocker, tetrodotoxin, or the Ca2+ channel blocker, Cd2+, consistent with their being due to action potential evoked, Ca2+-dependent neurotransmitter release. Furthermore, the amperometric signals were only observed when the voltage of the recording electrode was held above the oxidation potential for NA (i.e. +0.3 V) and not at potentials below this value (e.g. 0 V). Similar observations have previously been made for NA-induced electrochemical signals recorded at the adventitial surface of the rat tail artery (Mermet et al., 1990; Gonon et al., 1993; Brock et al., 1997). Further support that the electrically evoked amperometric signals measured in the small mesenteric arteries represent neurally released NA is provided by the effects of the uptake1 inhibitor, DMI, and the α2-adrenoceptor antagonist, idazoxan (see below).
The NA-induced signals recorded using this electrochemical technique are measured at the adventitial surface of the artery and not at the sites of NA release. It would be expected that at the sites of release the concentration of NA declines very rapidly and that diffusion, even over a few μm, results in a pronounced slowing in the time course of signals recorded at the adventitial surface (see Crank, 1967). In addition, the concentration of NA detected at the recording electrode is determined by the amount of NA released minus the amount of NA that is removed by uptake (see Stjärne, 1995). For these reasons the electrochemical technique cannot be used to estimate the concentration of NA at junctional receptors. The electrochemical signals can, however, provide a rough estimate of the NA concentration that might be ‘seen' by extrajunctional receptors located at some distance from the sites of NA release. The mean peak current evoked by trains of ten stimuli at 10 Hz was about 20 pA and electrodes of similar dimensions to those used in this study produced a current of 9.1±2.9 pA (n=4) when exposed to a solution containing 0.3 μM NA. This gives a value of about 0.5 μM for the peak concentration of NA detected. However, as it cannot be assumed that the stimulation induced change in NA concentration at the electrode surface is uniform (i.e. the concentration will be higher at the point of contact with the adventitia), this estimate should be considered to be a minimum value. The EC50 value for NA at α1-adrenoceptors in rat small mesenteric arteries is about 0.8 μM (Chen et al., 1996). Therefore, even at some distance from the sites of transmitter release, there is potential for NA released during these short trains of stimuli at 10 Hz to activate the vascular smooth muscle.
The effects of DMI on the electrochemical signals are consistent with blockade of uptake1. However, the effects of this agent differed depending on the stimulation parameters. The peak amplitude of responses to single stimuli and to trains of ten stimuli at 10 Hz was not significantly altered but the amplitude of the summed response, measured at the end of a train of ten stimuli at 1 Hz, was increased. The finding that the peak concentration of NA measured following a brief period of nerve activation (i.e. one pulse and ten pulses at 10 Hz) is not altered by blockade of neuronal uptake can be explained if clearance of NA from its site of release is primarily by diffusion and not by uptake (see Eccles & Jaeger, 1958; Clements, 1996). Perhaps in the rat mesenteric artery the sites of NA uptake are spatially separated from the sites of NA release. This arrangement has been suggested in rat brains for the uptake of dopamine released in nucleus accumbens (Garris et al., 1994) and 5-hydroxytryptamine released in dorsal raphae and substantia nigra (Bunin & Wrightman, 1998). In these brain regions, as in rat mesenteric artery, the electrochemically measured increase in amine concentration evoked by single stimuli and by short trains of high frequency stimuli was not changed by blockade of neuronal uptake. The findings of the present study do, however, differ from those of Stjärne et al. (1994) who investigated the effects of blocking uptake1 on electrochemical signals in rat tail artery. In this tissue blockade of uptake1 increased the peak amplitude oxidation currents evoked by single stimuli and by trains of 2–100 stimuli at 20 Hz. This may indicate that in rat tail artery the sites of NA uptake are located close to the sites of NA release (see Stjärne et al., 1994).
The slow (τ2) but not the fast (τ1) time constant of decay for the signals evoked by ten pulses at 1 and 10 Hz was increased by DMI. This DMI-induced slowing of the decay phase would be expected to increase summation of NA signals recorded during trains of stimuli lasting several seconds (see Garris et al., 1994) and presumably explains the increased amplitude of the summed response to stimulation at 1 Hz.
If it is assumed that NA molecules diffuse freely within the adventitia (see Bevan & Su, 1973) and that the adventitia is about 10 μm in thickness (Lee et al., 1987), then the overall rate of decay of NA concentration at the surface of the electrode following the trains of stimuli would be expected to be much faster than that measured in the present experiments (see Crank, 1967). This slowing of NA clearance can be explained if the diffusion of NA is impeded either by binding to tissue elements (e.g. receptors and transporters) or by the presence of extracellular diffusion barriers. At the skeletal neuromuscular junction clearance of acetylcholine from the junctional cleft is believed to be slowed by binding to nicotinic receptors (see Katz & Miledi, 1973). In the present experiments blockade of α1- and α2-adrenoceptors with competitive antagonists did not change τ1 or τ2 and in the presence of DMI the decay phase was slowed. These findings may indicate that there are other binding sites or tissue structures (e.g. the external elastic lamina) which slow NA diffusion (see also Stjärne et al., 1994). Interestingly, Stjärne & Stjärne (1995) have proposed a low affinity intrajunctional NA binding site that does not play a role in activation of the smooth muscle but slows NA diffusion and thereby maintains the NA concentration at the smooth muscle receptors. Their results with the rat tail artery suggest that binding of NA at this site is unaffected by idazoxan and prazosin but is strongly inhibited by phenoxybenzamine. The effects of the latter agent was not tested in the present study.
The idazoxan-induced increase in the amplitude of the oxidation currents evoked by trains of ten stimuli at 0.5, 1 and 10 Hz indicates that, under control conditions, NA released during these short trains of stimuli acts at presynaptic α2-adrenoceptors to inhibit subsequent NA release (i.e. α-autoinhibition; Starke, 1987). In support of this suggestion, idazoxan had no effect on the oxidation currents evoked by first stimulus in the trains of stimuli at 0.5 and 1 Hz, presumably because at this time the NA concentration at the α2-adrenoceptors was too low to activate them. Furthermore, the effects of idazoxan could not be accounted for by changes in NA clearance, as this agent had no effect on the decay time constants τ1 or τ2 for the signals evoked by ten stimuli at 1 and 10 Hz. The finding that responses to trains of 10 stimuli at 10 Hz were increased by idazoxan, indicates that the time required for the effects of α2-adrenoceptor activation to be manifested is <0.9 s.
The amplitude of intracellularly recorded e.j.ps was also increased by idazoxan. However, comparison of the e.j.p data with that for the electrochemical signals revealed a number of differences. Firstly, under control conditions, the decline in e.j.p amplitude during the trains of stimuli at 0.5 and 1 Hz occurred more slowly than for the electrochemical signals, which were markedly depressed following the first stimulus in the train. Secondly, idazoxan significantly increased the amplitude of e.j.ps evoked by first stimulus in the trains of stimuli at 0.5 and 1 Hz. Holman & Surprenant (1980) made a similar observation for e.j.ps recorded in rat tail artery and rabbit mesenteric artery following application of α2-adrenoceptor antagonists and questioned whether the effects of these agents on transmitter release could be accounted for by a blockade of α-autoinhibition. However, in the present experiments the magnitude of the idazoxan-induced facilitation of e.j.p amplitude increased during the trains of stimuli, consistent with α-autoinhibition. Thirdly, in the presence of idazoxan, e.j.ps evoked by the first five or so stimuli in the trains at 0.5 and 1 Hz increased amplitude (facilitated), while the amplitude of the electrochemical signals remained fairly constant throughout the trains of stimuli. Lastly, the overall magnitude of the idazoxan-induced increase in e.j.p amplitude was significantly greater than that for the electrochemical signals.
These findings are perhaps most readily explained if α2-adrenoceptor mediated autoinhibition differentially effects the release of NA and ATP. A similar suggestion has been made for the guinea-pig vas deferens in which α2-adrenoceptor antagonists have been reported to differentially effect NA and ATP overflow (Driessen et al., 1993; Todorov et al., 1996). In both these studies the overflow of NA and ATP was increased by α2-adrenoceptor antagonists but the effect on NA overflow was greater than that on ATP overflow. In contrast, in rat tail artery where the release of NA and ATP was monitored using in situ amperometry and electrophysiological recording techniques respectively, α2-adrenoceptor antagonists similarly affected the release of both substances during trains of stimuli at 2 Hz (Msghina et al., 1992) but selectively increased NA release during long trains of stimuli at 20 Hz (Msghina et al., 1999).
One potential problem in making comparisons between the NA-induced electrochemical signals and e.j.ps is that they may not be measuring neurotransmitter release from identical sites. Firstly, electrophysiological studies indicate that e.j.ps result from the action of ATP released at close neuroeffector junctions (Hirst et al., 1996), where the synaptic delay is similar to that observed at skeletal neuromuscular junctions (about 1 ms; Brock & Cunnane, 1988). However, while it is known that some sympathetic nerve varicosities make well defined neuromuscular junctions in rat mesenteric arteries where the neuromuscular cleft width is <100 nM (Luff & McLachlan, 1989), many sympathetic varicosities in this tissue do not form close neuroeffector contacts (S.E. Luff, unpublished observations). Secondly, while it is believed that NA and ATP are co-stored in both the ‘small' and the ‘large' dense cored vesicles present in sympathetic nerve varicosities, e.j.ps are believed to result only from ATP released from ‘small' dense cored vesicles (Stjärne, 1995), whereas the electrochemically measured NA may originate from both ‘small' and ‘large' dense cored vesicles. It is therefore possible that the differences observed in this study result from differential modulation of neurotransmitter release from ‘close' and ‘distant' varicosities and/or ‘small' and ‘large' dense cored vesicles.
In conclusion, the findings of this study indicate that the release of NA from the sympathetic nerves supplying rat small mesenteric arteries is tightly regulated by activation of presynaptic α2-adrenoceptors. The study also suggests that released NA is cleared both by diffusion and by uptake1. Finally, comparison between the effects of blocking α-adrenoceptor mediated autoinhibition on NA-induced oxidation currents and e.j.ps, indicates that the release of NA may be separately modulated from that of ATP. However, it remains possible that this apparent difference in the modulation of NA and ATP release is a reflection of the different methods used to monitor NA and ATP secretion.
Acknowledgments
This work was supported by the National Heart Foundation of Australia. The authors acknowledge travel support from the Wellcome Trust, Royal Society, Physiological Society and British Hypertension Society.
Abbreviations
- ATP
adenosine 5′-triphosphate
- DMI
desmethylimipramine
- e.j.ps
excitatory junction potentials
- NA
noradrenaline
References
- ANGUS J.A., BROUGHTON A., MULVANY M.J. Role of α-adrenoceptors in constrictor responses of rat, guinea-pig and rabbit small arteries to neural activation. J. Physiol. 1988;403:495–510. doi: 10.1113/jphysiol.1988.sp017260. [DOI] [PMC free article] [PubMed] [Google Scholar]
- BEVAN J.A., SU C. Sympathetic mechanisms in blood vessels: nerve and muscle relationships. Ann. Rev. Pharmacol. 1973;13:269–285. doi: 10.1146/annurev.pa.13.040173.001413. [DOI] [PubMed] [Google Scholar]
- BROCK J.A., BRIDGEWATER M., CUNNANE T.C. β-Adrenoceptor mediated facilitation of noradrenaline and adenosine 5′-triphosphate release from sympathetic nerves supplying the rat tail artery. Br. J. Pharmacol. 1997;120:769–776. doi: 10.1038/sj.bjp.0700959. [DOI] [PMC free article] [PubMed] [Google Scholar]
- BROCK J.A., CUNNANE T.C. Electrical activity at the sympathetic neuroeffector junction in the guinea-pig vas deferens. J. Physiol. 1988;399:607–632. doi: 10.1113/jphysiol.1988.sp017099. [DOI] [PMC free article] [PubMed] [Google Scholar]
- BROCK J.A., CUNNANE T.C. Neurotransmitter release mechanisms at the sympathetic neuroeffector junction. Exp. Physiol. 1993;78:591–614. doi: 10.1113/expphysiol.1993.sp003709. [DOI] [PubMed] [Google Scholar]
- BROCK J.A., CUNNANE T.C. Effects of Ca2+ concentration and Ca2+ channel blockers on noradrenaline release and purinergic neuroeffector transmission in rat tail artery. Br. J. Pharmacol. 1999;126:11–18. doi: 10.1038/sj.bjp.0702256. [DOI] [PMC free article] [PubMed] [Google Scholar]
- BROCK J.A., VAN HELDEN D.F. Enhanced excitatory junction potentials in mesenteric arteries from spontaneously hypertensive rats. Pflügers Archiv. 1995;430:901–908. doi: 10.1007/BF01837403. [DOI] [PubMed] [Google Scholar]
- BUCHHOLZ J.N., DUCKLES S.P. In vitro measurement of endogenous norpinephrine release from small blood vessels with short stimulation trains. J. Pharmacol. Toxicol. Meth. 1992;28:137–141. doi: 10.1016/1056-8719(92)90075-c. [DOI] [PubMed] [Google Scholar]
- BUNIN M.A., WRIGHTMAN R.M. Quantitative evaluation of 5-hydroxytryptamine (serotonin) neuronal release and uptake: an investigation of extrasynaptic transmission. J. Neurosci. 1998;18:4854–4860. doi: 10.1523/JNEUROSCI.18-13-04854.1998. [DOI] [PMC free article] [PubMed] [Google Scholar]
- CHEN H., FETSCHER C., SCHAFERS R.F., WAMBACH G., PHILIPP T., MICHEL M.C. Effects of noradrenaline and neuropeptide Y on rat mesenteric microvessel contraction. Naunyn Schmiedebergs Arch. Pharmacol. 1996;353:314–323. doi: 10.1007/BF00168634. [DOI] [PubMed] [Google Scholar]
- CHRISTENSEN K.L., MULVANY M.J. Mesenteric arcade arteries contribute substantially to vascular resistance in conscious rats. J. Vas. Res. 1993;30:73–79. doi: 10.1159/000158978. [DOI] [PubMed] [Google Scholar]
- CLEMENTS J.D. Transmitter timecourse in the synaptic cleft: its role in central synaptic function. Trends Neurosci. 1996;19:163–171. doi: 10.1016/s0166-2236(96)10024-2. [DOI] [PubMed] [Google Scholar]
- COX S.L., STORY D.F., ZIOGAS J. Multiple prejunctional actions of angiotensin II on noradrenergic transmission in the caudal artery of the rat. Br. J. Pharmacol. 1996;119:976–984. doi: 10.1111/j.1476-5381.1996.tb15767.x. [DOI] [PMC free article] [PubMed] [Google Scholar]
- CRANK J. The mathematics of diffusion. Oxford University Press, Oxford; 1967. [Google Scholar]
- DRIESSEN B., VON KUGELGEN I., STARKE K. Neural ATP release and its α2-adrenoceptor-mediated modulation in guinea-pig vas deferens. Naunyn Schmiedebergs Arch. Pharmacol. 1993;348:358–366. doi: 10.1007/BF00171334. [DOI] [PubMed] [Google Scholar]
- DUNN W.R., GARDINER S.M. Structural and functional properties of isolated, pressurized, mesenteric resistance arteries from vasopressin-deficient rat model of genetic hypertension. Hypertension. 1995;26:390–396. doi: 10.1161/01.hyp.26.3.390. [DOI] [PubMed] [Google Scholar]
- ECCLES J.C., JAEGER J.C. The relationship between the mode of operation and dimensions of the junctional region at synapses and motor end-organs. Proc. Roy. Soc. Lond. B. 1958;128:38–56. doi: 10.1098/rspb.1958.0003. [DOI] [PubMed] [Google Scholar]
- FENGER-GRON J., MULVANY M.J., CHRISTENSEN K.L. Intestinal blood flow is controlled by both feed arteries and microcirculatory resistance vessels in freely moving rats. J. Physiol. 1997;498:215–224. doi: 10.1113/jphysiol.1997.sp021852. [DOI] [PMC free article] [PubMed] [Google Scholar]
- GARRIS P.A., CIOLKOWSKI E.L., PASTORE P., WIGHTMAN R.M. Efflux of dopamine from the synaptic cleft in the nucleus accumbens of the rat brain. J. Neurosci. 1994;14:6084–6093. doi: 10.1523/JNEUROSCI.14-10-06084.1994. [DOI] [PMC free article] [PubMed] [Google Scholar]
- GONON F., MSGHINA M., STJÄRNE L. Kinetics of noradrenaline released by sympathetic nerves. Neuroscience. 1993;56:535–538. doi: 10.1016/0306-4522(93)90354-i. [DOI] [PubMed] [Google Scholar]
- HIRST G.D., CHOATE J.K., COUSINS H.M., EDWARDS F.R., KLEMM M.F. Transmission by post-ganglionic axons of the autonomic nervous system: the importance of the specialized neuroeffector junction. Neuroscience. 1996;73:7–23. doi: 10.1016/0306-4522(96)00031-0. [DOI] [PubMed] [Google Scholar]
- HOLMAN M.E., SURPRENANT A. An electrophysiological analysis of the effects of noradrenaline and alpha-receptor antagonists on neuromuscular transmission in mammalian muscular arteries. Br. J. Pharmacol. 1980;71:651–661. doi: 10.1111/j.1476-5381.1980.tb10986.x. [DOI] [PMC free article] [PubMed] [Google Scholar]
- KATZ B., MILEDI R. The binding of acetylcholine to receptors and its removal from the synaptic cleft. J. Physiol. 1973;231:549–573. doi: 10.1113/jphysiol.1973.sp010248. [DOI] [PMC free article] [PubMed] [Google Scholar]
- LEE R.M.K.W., TRIGGLE C.R., CHEUNG D.W., COUGHLIN M.D. Structural and functional consequence of neonatal sympathectomy on blood vessels of spontaneously hypertensive rats. Hypertension. 1987;10:328–338. doi: 10.1161/01.hyp.10.3.328. [DOI] [PubMed] [Google Scholar]
- LUFF S.E., MCLACHLAN E.M. Frequency of neuromuscular junctions on arteries of different dimensions in rabbit, guinea-pig and rat. Blood Vessels. 1989;26:95–106. doi: 10.1159/000158758. [DOI] [PubMed] [Google Scholar]
- MERMET C., GONON F.G., STJÄRNE L. On-line electrochemical monitoring of the local noradrenaline release evoked by electrical stimulation of the sympathetic nerves in isolated rat tail artery. Acta. Physiol. Scand. 1990;140:323–329. doi: 10.1111/j.1748-1716.1990.tb09006.x. [DOI] [PubMed] [Google Scholar]
- MSGHINA M., GONON F., STJARNE L. Intermittent release of noradrenaline by single pulses and release during short trains at high frequencies from sympathetic nerves in rat tail artery. Neuroscience. 1993;57:887–890. doi: 10.1016/0306-4522(93)90033-c. [DOI] [PubMed] [Google Scholar]
- MSGHINA M., GONON F., STJÄRNE L. Facilitation and depression of ATP and noradrenaline release from sympathetic nerves of rat tail artery. J. Physiol. 1999;515:523–531. doi: 10.1111/j.1469-7793.1999.523ac.x. [DOI] [PMC free article] [PubMed] [Google Scholar]
- MSGHINA M., MERMET C., GONON F., STJÄRNE L. Electrophysiological and electrochemical analysis of the secretion of ATP and noradrenaline from the sympathetic nerves in rat tail artery: effects of α2-adrenoceptor agonists and antagonists and noradrenaline reuptake blockers. Naunyn Schmiedebergs Arch. Pharmacol. 1992;346:173–186. doi: 10.1007/BF00165299. [DOI] [PubMed] [Google Scholar]
- NILSSON H., GOLDSTEIN M., NILSSON O. Adrenergic innervation and neurogenic response in large and small arteries and veins from the rat. Acta Physiol. Scand. 1986;126:121–133. doi: 10.1111/j.1748-1716.1986.tb07795.x. [DOI] [PubMed] [Google Scholar]
- RAMME D., ILLES P., SPATH L., STARKE K. Blockade of α2-adrenoceptors permits the operation of otherwise silent opioid kappa-receptors at the sympathetic axons of rabbit jejunal arteries. Naunyn Schmiedebergs Arch. Pharmacol. 1986;334:48–55. doi: 10.1007/BF00498739. [DOI] [PubMed] [Google Scholar]
- STARKE K. Presynaptic alpha-autoreceptors. Rev. Physiol. Biochem. Pharmacol. 1987;107:73–146. [PubMed] [Google Scholar]
- STEPHENS N., BUND S.J., JAGGER C., HEAGERTY A.M. Arterial neuroeffector responses in early and mature spontaneously hypertensive rats. Hypertension. 1991;18:674–682. doi: 10.1161/01.hyp.18.5.674. [DOI] [PubMed] [Google Scholar]
- STJÄRNE L.Modulation of transmitter release Neurotransmitter release and its modulation 1995Cambridge University Press, Cambridge; 57–80.ed. Powis, D.A. & Bunn, S.J., pp [Google Scholar]
- STJÄRNE L., BAO J.X., GONON F., MSGHINA M. Nerve activity-dependent variations in clearance of released noradrenaline: regulatory roles for sympathetic neuromuscular transmission in rat tail artery. Neuroscience. 1994;60:1021–1038. doi: 10.1016/0306-4522(94)90280-1. [DOI] [PubMed] [Google Scholar]
- STJÄRNE L., STJÄRNE E. Geometry, kinetics and plasticity of release and clearance of ATP and noradrenaline as sympathetic cotransmitters: roles for the neurogenic contraction. Prog. Neurobiol. 1995;47:45–94. doi: 10.1016/0301-0082(95)00018-q. [DOI] [PubMed] [Google Scholar]
- TODOROV L.D., MIHAYLOVA-TODOROVA S., CRAVISO G.L., BJUR R.A., WESTFALL D.P. Evidence for the differential release of the cotransmitters ATP and noradrenaline from sympathetic nerves of the guinea-pig vas deferens. J. Physiol. 1996;496:731–748. doi: 10.1113/jphysiol.1996.sp021723. [DOI] [PMC free article] [PubMed] [Google Scholar]