

Abstract
We have expressed the GABA transporter (GAT1) of mouse brain in Xenopus oocytes and have investigated the effects of four antiepileptic drugs, tiagabine (TGB), vigabatrin (VGB), gabapentin (GBP) and valproate (VAL), on GAT1 transporter function by measurements of 3H-labelled GABA uptake and GAT1-mediated currents.
Not only TGB, a well-known inhibitor of GAT1-mediated transport, but also the other drugs efficiently inhibit the uptake of [3H]-GABA by GAT1. Inhibition at 50% is obtained for VGB, TGB, GBP, and VAL at concentrations of about 1 nM, 1 μM, 50 μM and 100 μM, respectively.
However, GAT1-mediated steady-state and transient currents are nearly unaffected by VGB, GBP, and VAL at even five times higher concentrations. Only TGB blocks the uptake and steady-state and transient currents at micromolar concentrations.
VGB exhibits a complex interaction with GAT1; at concentrations about 1 nM, the inhibition of uptake is released, but at millimolar concentrations the uptake is inhibited again, and also the GAT1-mediated current is finally inhibited at these concentrations with a KI value of 0.5 mM. The concentration dependency of inhibition of uptake can be explained by two interaction sites with different affinities, a blocking site and a transport site.
The differences in effects of VAL, GBP, and VGB on uptake and currents can be attributed to the fact that GAT1 has the capability to operate in an electrogenic mode without uptake of GABA. We suggest that inhibition occurs only when GAT1 operates in the GABA-uptake mode.
The inhibition of GABA uptake by these four drugs will result in an elevation of the GABA concentration in the synaptic cleft, which will enhance synaptic inhibition and thereby contribute to their antiepileptic effects.
Keywords: GABA transporter, epilepsy, Xenopus oocyte, electrophysiology, tiagabine, vigabatrin, valproate, gabapentin
Introduction
The dominating inhibitory neurotransmitter in mammalian brain is γ-aminobutyric acid (GABA), and the GABAergic system has been assumed to play a key role in the occurrence of pathological conditions like epilepsy. For treatment of epilepsy, therefore, drugs have been designed to increase inhibitory synaptic activity by elevation of the concentration or dwell time of GABA in the synaptic cleft (see Löscher, 1998). These drugs include those that inhibit GABA transaminase, the major enzyme for its metabolic breakdown, or uptake of GABA, or that stimulate GABA synthesis. For example valproate (VAL), which belongs to the `old generation' of anticonvulsant drugs, and vigabatrin (VGB) of the so-called `second generation' are well-known for their inhibitory effect on transaminases. For VGB it has been suggested that it is also transported into the cell by the GABA transporter (Leach et al., 1996). Drugs of the newer generation are gabapentin (GBP) that is believed to stimulate the synthesis of GABA, and tiagabine (TGB), which has been shown to be a specific inhibitor of the transport system that mediates the uptake of GABA into neurones and glial cells. Usually, a single antiepileptic drug is applied for therapy, but recently add-on application became of interest in the therapy of refractory epilepsies since the combination of two drugs may have `supra-additive effects' (see e.g. Leach et al., 1997; Lücke et al., 1998). To understand the mechanisms, it is essential to have detailed knowledge on the mechanisms of each drug effect alone. Therefore, we have investigated whether not only tiagabine but also the other three drugs affect the GABA-uptake system GAT1, and what the mechanism could be. To test the function of GAT1 without interference from other GABAergic pathways, we expressed GAT1 from mouse brain (Tam et al., 1994) in Xenopus oocytes.
The GABA transporter GAT1 can be found as the dominating isoform in nerve terminals, but it exists also to a smaller extent in glial cells (Borden, 1996). GAT1 has been cloned and sequenced from the brains of a variety of animal species (Nelson & Mandiyan, 1990; Guastella et al., 1990; Liu et al., 1992; Tam et al., 1994). The transporter belongs to a family of secondary active systems (see e.g. Schloss et al., 1992) that are driven by the electrochemical gradients of Na+ and Cl−. Due to its 1 GABA/2 Na+/Cl− stoichiometry, the transporter is electrogenic. Nevertheless, the generated current cannot serve a priori as a measure for transport activity, since the transporter can operate in a mode, in which just the ions but no GABA are translocated (Cammack & Schwartz, 1996). In addition, transient currents can be detected in the absence of GABA in response to voltage steps, and can be attributed to partial reactions of the transport cycle (Mager et al., 1993; 1996; Liu et al., 1998). The combination of measurements of steady-state and transient currents with radioactive uptake measurements is an optimal protocol for the analysis of modulation of the transport function. Part of the results has recently been reported in abstract form (Eckstein-Ludwig & Schwarz, 1998; Eckstein-Ludwig et al., 1999).
Methods
Oocytes
Females of the clawed toad Xenopus laevis were anaesthetized with tricaine (MS222, Sandoz, Basel (Switzerland) 1 g l−1). Parts of the ovary were removed and treated with collagenase. Full-grown prophase-arrested oocytes were selected for experiments. For expression, cRNA of GAT1 of mouse brain (about 50 ng per oocyte) was injected. These cells as well as non-injected control oocytes were incubated at 19°C in oocyte Ringer's solution (ORi, see `Solutions') containing 70 mg l−1 gentamicin. Experiments were performed after 3–5 days of incubation.
Measurements of [3H]-GABA uptake
For determining the maximum transport activity, uptake of 3H-labelled GABA (Amersham, Braunschweig) was measured at 90 mM external Na+ and 100 μM total GABA. The oocytes were incubated for 20 min in a solution (volume 200 μl) of ORi (see Solutions) containing 100 μM GABA and 15 nM [3H]-GABA (9.25 kBq per 200 μl). For determination of non-specific GABA uptake, measurements were performed in parallel with oocytes kept in a Na+-free incubation solution, in which NaCl was replaced by choline chloride, or non-specific uptake of uninjected control oocytes was determined. For all the data presented here, the unspecific uptake was subtracted. To exclude oocytes with high membrane leakage, 1 mM sucrose with 18 μM [14C]-sucrose (16 kBq per 200 μl, DuPont NEN, Bad Homburg) were added to the incubation medium (see Schmalzing et al., 1991). Only oocytes with less than 150 d.p.m. of 14C per oocyte were used for averaging.
Voltage-clamp experiments
The electrophysiological experiments were performed on oocytes with the conventional two-electrode voltage clamp (TEVC) technique (see e.g. Lafaire & Schwarz, 1986). For characterization of the GABA transport, steady-state membrane currents were recorded at the end of 200- or 400-ms rectangular voltage pulses (from −150 up to +60 mV in 10-mV increments) that were applied from a holding potential of −60 mV, and voltage dependencies of steady-state membrane currents were obtained. The current generated by the GAT1 was determined as the current activated by extracellular application of 100 μM GABA in the presence of Na+ minus that in the absence of GABA (difference current). In control experiments, we confirmed that the difference current is the same as the current component that can be blocked by 10 μM SKF89976A, a GAT1-specific inhibitor, kindly provided to us by SmithKline Beecham Pharma GmbH, Munich. In addition to functional characterization of the GAT1 by [3H]-GABA uptake and steady-state current measurements, we determined the charges moved in the electrical field in the absence of GABA in response to rectangular voltage pulses. The amount of charges moved was calculated by integration of the transient component of the GAT1-mediated current signal. Since the time constants of the transients were in the range of several tens of milliseconds (Mager et al., 1996, and see results), the current was filtered at 150 Hz and sampled at 1 kHz. In a few experiments with a filter setting of 500 Hz we confirmed that determination of the time constants was not limited by the filter setting. The time course of the transient currents could be described by a single exponential.
Typical responses to voltage pulses in the absence and presence of 100 μM GABA are shown in Figure 1. No difference could be detected if GAT1 was not expressed in the oocytes. GAT1-mediated steady-state responses are represented by the difference in steady-state currents (GABA–no GABA). In these particular records, the potential was set from the holding potential to +60 (Figure 1b) or −150 mV (Figure 1c). At −150 mV an inward GAT1-mediated current of −420 nA can be detected, at −60 mV of −150 nA, and at +60 mV the current vanished. Comparison of the records in the absence and presence of GABA also reveals that in the absence of GABA a slow transient current occurs, which was not seen in oocytes without expressed GAT1 and represented the charge movements associated with a partial reaction. These transients were clearly visible for the pulses to +60 mV, but only a very small signal could be extracted from the response to pulses to −150 mV (see grey areas in Figure 1b,c) indicating an asymmetric charge distribution with respect to the holding potential.
Figure 1.
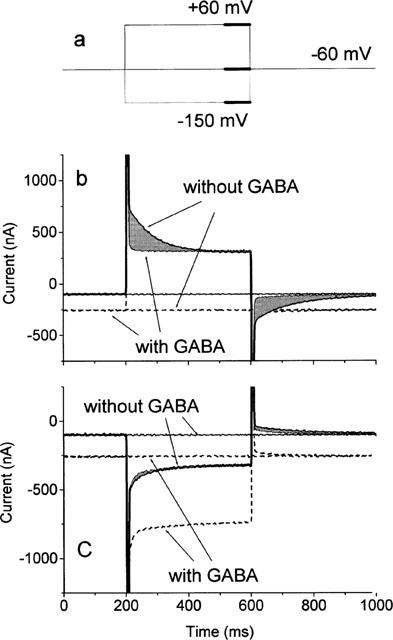
Currents at a holding potential of −60 mV, and in response to a 400-ms voltage pulse (pulse protocol in (a)) from the holding potential to +60 mV (b) and −150 mV (c) in the absence and presence of 100 μM GABA. The thick sections in the pulse protocol indicate the periods (20% of the pulse length) where averaged steady-state currents were determined. The grey areas represent the amount of transiently moved charges in the absence of GABA. They are determined as the difference of the transient contributions to the current responses in the absence and presence of GABA.
Solutions
The standard solution (ORi) had the following composition unless stated otherwise (in mM): NaCl 90, KCl 2, MgCl2 2, MOPS/Tris 5 (adjusted to pH 7.4). To reduce background currents mediated by Ca2+-activated channels (Cl− channels), no Ca2+ was added (see Miledi, 1982; Barish, 1983).
Results
Measurements of [3H]-GABA uptake
GAT1-mediated transport of GABA into oocytes in the presence of 100 μM GABA was determined from the specific tracer uptake of [3H]-GABA, and is illustrated in Figure 2. Data are shown for measurements in the absence and presence of different antiepileptic drugs. At the applied concentrations, which are in the range used in medical treatment (see Östergaard et al., 1995; Jung & Palfreyman, 1995; Taylor, 1995), all drugs inhibited the GABA uptake: 20 μM TGB gave 93±1%, 100 μM VGB 44±7%, 140 μM VAL 62±3%, and 60 μM GBP also 62±3% inhibition.
Figure 2.
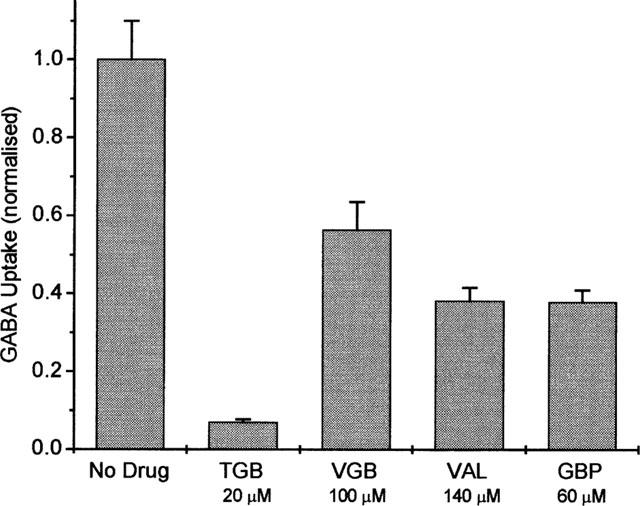
Normalized rates of GABA uptake (1 corresponds to 99±9 fmol s−1) in the absence and presence of TGB, VGB, VAL, and GBP, respectively. The GAT1-mediated transport (in the presence of 100 μM GABA) was determined as the difference of [3H]-GABA uptake in the presence and absence of 90 mM Na+, or by subtraction of unspecific uptake measured in uninjected oocytes of the respective batch. Data represent averages from three batches of oocytes±s.e.mean (with 10 oocytes per batch).
We analysed the concentration dependencies for two of the drugs in more detail: TGB, which was specifically designed to cross the blood-brain barrier to inhibit the GAT1 of neurones and glial cells, and VGB, which was developed to inhibit GABA transaminase. The results are shown in Figure 3. Inhibition of the uptake Φ by TGB can be described by:
with KI=1.8 μM and a Hill coefficient of n=1.
Figure 3.
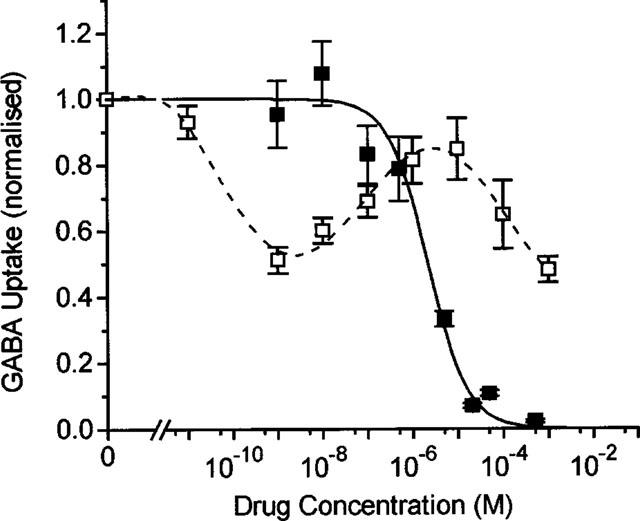
Concentration dependence of inhibition of [3H]-GABA uptake mediated by GAT1 (1 corresponds to 155±19 fmol s−1 for experiments with VGB, and to 102±26 fmol s−1 for those with TGB). The GAT1-specific transport (in the presence of 100 μM GABA) was determined as the difference of [3H]-GABA uptake in the presence and absence of 90 mM Na+, or by subtraction of unspecific uptake measured in uninjected oocytes of the respective batch. Data represent averages from three batches of oocytes for inhibition by TGB and two batches for inhibition by VGB±s.e.mean (with 10 oocytes per batch). The solid line represents a fit of equation 1 for inhibition by TGB with an app. KI value of 1.8 μM (with a Hill coefficient of n=1); the broken line was drawn by eye to follow the biphasic concentration-dependent inhibition by VGB.
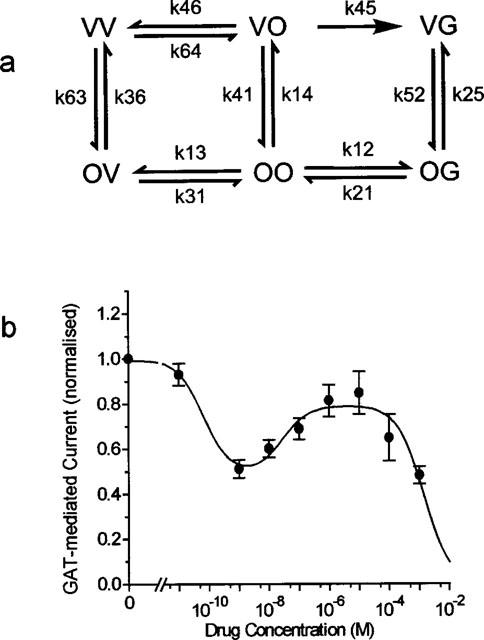
The concentration dependence of inhibition by VGB is more complex: 50% inhibition of uptake was first achieved at about 1 nM, then the inhibition was partially relieved with increasing concentration up to 10 μM, beyond which the inhibition developed again with an estimated KI value of about 800 μM. This complex dependency can be described by assuming two independent sites for VGB interaction with the GAT1, one inhibitory site and one transport site where VGB is accepted as substrate in competition with GABA (see Discussion).
For GBP and VAL we only estimated the concentration for inhibition at 50% of uptake rate from measurements at two different drug concentrations to about 100 μM for VAL and 50 μM for GBP (compare also Figure 2).
Measurements of steady-state current
Application of GABA activates a steady-state current that is in part mediated by the transporter due to the 1 GABA/2 Na+/1 Cl− stoichiometry and in part by a non-transporting mode (Cammack et al., 1994; Risso et al., 1996). We have analysed the effects of the antiepileptic drugs on total GAT1-mediated currents.
Figure 4a shows the effect of TGB on the current-voltage dependence. Application of 20 μM TGB produces an inhibition that is only partially reversible even after 15 min of washing with drug-free solution. The concentration dependence of inhibition is plotted for a series of selected potentials in Figure 4b. The apparent KI value (equation 1) is independent of membrane potential and amounts to about 0.3 μM (with a Hill coefficient of n=1). This KI value is smaller than that determined from the flux measurements but is of the same order of magnitude.
Figure 4.
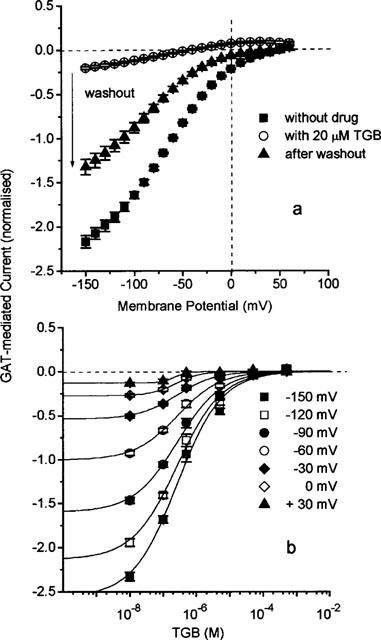
(a) Partially reversible inhibition of GAT1-mediated steady-state current by TGB determined as the difference of current in the presence and absence of 100 μM GABA. Washout time was 15 min. The GAT1-mediated current was determined as the current activated by 100 μM GABA. Data are normalized and represent averages from 10 oocytes±s.e.mean. The value of −1 corresponds to −227±12 nA at −60 mV. (b) Concentration dependence of inhibition by TGB of GAT1-mediated current at different membrane potentials. Data represent averages from 10 oocytes±s.e.mean. The solid lines represent fits of equation 1 with a voltage-independent app. KI value of 270 nM and a Hill coefficient of n=1.
The effect of VGB on the GAT1-mediated current is shown in Figure 5. Application of 500 μM VGB leads to about 50% reduction of the current that can be induced by 100 μM GABA. The effect is nearly completely reversible after washing with drug-free solution. Interestingly, in the absence of GABA, 500 μM VGB can induce a current of −62.5±0.3 nA at -60 mV, which corresponds to about 40% of the current induced by GABA alone at this potential (Figure 5a). The voltage dependence of the VGB-induced current is the same as that of the GABA-induced current. Because of its structural similarities to GABA, VGB besides being an inhibitor, is expected to serve as a substrate and gets transported into the cell (see also Leach et al., 1996). Both the dependencies on VGB concentration of inhibition of GABA-induced current and of the VGB-induced current are shown for different membrane potentials in Figure 5b,c, respectively. The inhibition can be described by a voltage-independent apparent KI value of 500 μM (with a Hill coefficient of n=1). The activation of VGB-induced current was investigated only for concentrations up to 1 mM, where VGB acts also as inhibitor; this allows only an estimate of an K1/2 value for activation up to about 1 mM. Assuming that VGB can generate at a particular potential a current not exceeding the current induced by GABA, a K1/2 value of 500 μM was obtained. These values are of the same magnitude as the KI value determined from the inhibition of GABA uptake for the higher concentration range (c.f. Figure 3). Since the rate of GABA uptake is already saturated at 100 μM GABA, the similarity between the KI and K1/2 values suggests that VGB competes against GABA for the transport site. Concentrations of VGB in the submicromolar range that give clear inhibition of GABA uptake do not show any effect on the GAT1-mediated currents.
Figure 5.
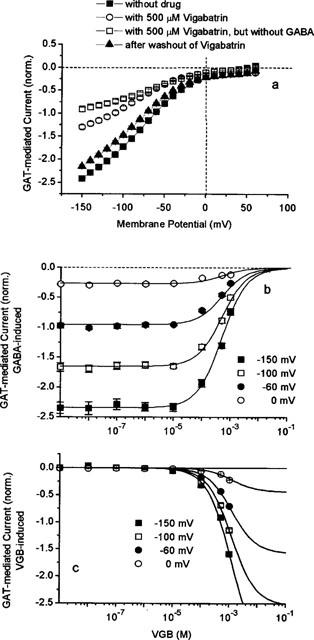
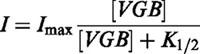 |
The concentrations of 140 μM VAL and of 60 μM GBP that produce about 40% inhibition of GABA uptake do not show any effect on the GAT1-mediated currents. Even increasing the concentrations to 1 mM and 300 μM, respectively, leads only to a slight inhibition, if any (see Figure 6a,b), but this may be attributed to a slight run-down.
Figure 6.
Voltage-dependence of normal GAT1-mediated current (−1 corresponds to −163+21 nA for experiments with GBP, and −196±16 nA for those with VAL) induced by 100 μM GABA before and during application of (a) 1 mM VAL and (b) 300 μM GBP, and after washout. The GAT1-mediated current was determined as the current activated by 100 μM GABA. Data represent averages from 4 and 5 oocytes±s.e.mean, respectively.
Measurements of transient currents
In the absence of GABA, we could not detect GAT1-mediated steady-state electrogenic transport in the oocytes. However, transient charge movements were clearly observed (see Figure 1) that have been attributed to voltage-dependent interaction of external Na+ with the transporter (Mager et al., 1993; 1996; Liu et al., 1998). The amount of charges moved (Q) can be calculated by fitting an exponential time course to the transient signal and subsequently integrating the time course. The voltage-dependent distribution of Q follows a Fermi equation:
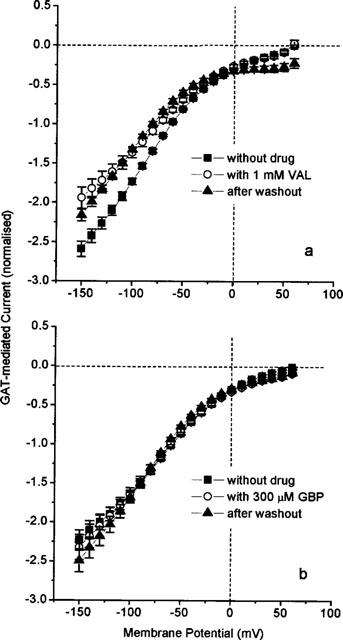
with maximally moved charge Qmax=Q+∞–Q−∞. Similar to the effects on fluxes and steady-state currents, 20 μM TGB nearly completely block the charge movements, whereas 100 nM give partial inhibition (Figure 7a) with a reduction of Qmax from 30.0 nC to 19.7 nC. The effect is hardly reversible even after 15 min of washing. The mid-point potential E1/2=−29 mV, the effective valency zf=−0.98 as well as the time constants (Figure 7b) of the transients are unaffected by TGB. These findings suggest that the charge movements remaining in the presence of TGB are not affected. The dependence of Qmax on TGB concentration (equation 1) reveals a KI value of 220 nM (with a Hill coefficient of n=1, Figure 7c), which is close to the KI value obtained for inhibition of steady-state current (KI=0.3 μM).
Figure 7.
(a) Irreversible effect of TGB on GAT1-mediated charge movements measured in the absence of external GABA. Voltage dependence of charge movements in the absence and presence of 100 nM TGB, and after washout (15 min). Solid lines represent fits of equation 2, fit parameters see text. (b) Voltage dependence of time constant of the transient on-responses in the absence and presence of 100 nM TGB. (c) Dependence of Qmax (see equation 2) on TGB concentration. The solid line represents a fit of equation 1 with KI=220 nM (with a Hill coefficient of n=1), and Qmax=1 in the absence of drug corresponds to 32±6 nC. The GAT1-mediated charge movements were determined as the charge movements blocked by 100 μM GABA. Data represent averages from 10 oocytes± s.e.mean.
Similarly, the effect of VGB on the Qmax like its effect on steady-state currents is hardly affected by 100 μM VGB, decreasing from 30.2 to 28.7 nC; but at 500 μM VGB produces clear inhibition (Qmax=16.1 nC, Figure 8a). While the mid-point potential is not affected (E1/2=−31.6 mV), the effective valency is altered slightly from −1.1 (in 0 and 100 μM) to −1.4 (in 500 μM). The KI value of 474 μM (with a Hill coefficient of n=1.51, Figure 8c) is closed to the value obtained for inhibition of the steady-state current (KI=500 μM). Application of 500 μM VGB also reduces the time constants, but without affecting its voltage dependence (Figure 8b). The extremely low concentrations in the nanomolar range, which lead to inhibition of GABA uptake, are without effect on steady-state current as well as on charge movements.
Figure 8.
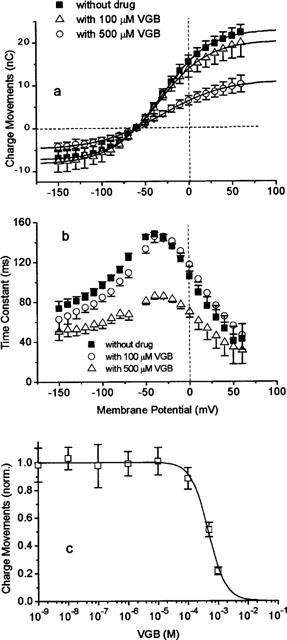
Effect of VGB on GAT1-mediated charge movements in the absence of external GABA. (a) Voltage dependence of charge movements in the absence and presence of 100 and 500 μM VGB. Solid lines represent fits of equation 2; fit parameters see text. (b) Voltage dependence of time constant of the transient on-responses in the absence and presence of 100 μM and 500 μM VGB. (c) Dependence of Qmax (see equation 2) on VGB concentration. The solid line represents a fit of equation 1 with KI=474 μM, with a Hill coefficient of n=1.51, and Qmax=1 in the absence of drug corresponds to 40.2±3.6 nC. The GAT1-mediated charge movements were determined as the charge movements blocked by 100 μM GABA. Data represent averages from 9 oocytes±s.e.mean.
The two antiepileptic drugs VAL and GBP, which inhibit GABA uptake at about 100 μM (see Figure 2), are without any effect on steady-state currents even at concentrations of 1 mM and 300 μM for VAL and GBP, respectively (see Figure 6). They also do not alter the charge movements; neither the amount of charges moved (Figure 9a,c) nor the time constants (Figure 9b,d) are altered.
Figure 9.
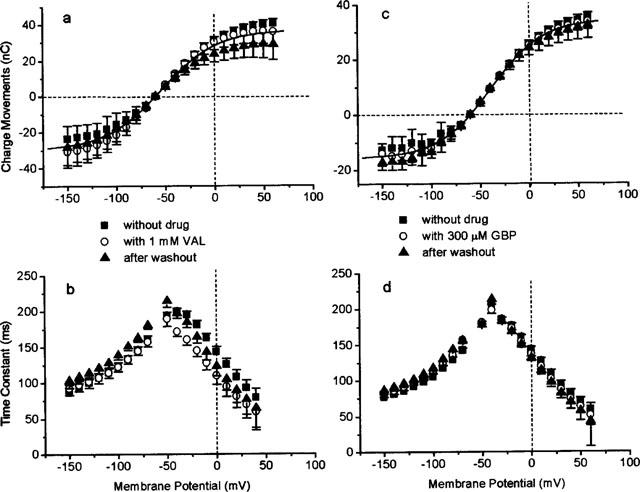
Effect of VAL (a and b) and GBP (c and d) on GAT1-mediated charge movements in the absence of external GABA. (a and c) Voltage dependence of charge movements in the absence and presence of 1 mM VAL and 300 μM GBP, respectively. Solid lines represent fits of equation 2. Data in the absence and presence of drug were fitted by the same parameters: for (a) Qmax=50.2 nC, zf=−1.1, E1/2=−39.2 mV, for (b) Qmax=66.6 nC, zf=−1.1, E1/2=−54.4 mV. (b and d) Voltage dependence of time constant of the transient on-responses in the absence and presence of 1 mM VAL and 300 μM GBP, respectively. The GAT1-mediated charge movements were determined as the charge movements blocked by 100 μM GABA.
Discussion
In our investigations on the effects of antiepileptic drugs on the GABA transporter GAT1, we have measured GABA uptake, steady-state currents and transient charge movements. All the tested drugs inhibit GABA uptake at clinically relevant concentrations (see Östergaard et al., 1995; Jung & Palfreyman, 1995; Taylor, 1995). The uptake measurements give direct information about the effectiveness of the GAT1 in removing GABA from the extracellular space. In principle, the steady-state current is also a measure of transport activity, provided that the stoichiometry of 1 GABA/2 Na+/1 Cl− is not variable; but this seems not to be the case under all conditions (Cammack et al., 1994; Risso et al., 1996). In particular, the existence of a transport mode, in which the transporter behaves like a channel allowing ion movements without GABA translocation, has been reported (Cammack & Schwartz, 1996). In our experiments on the oocytes, we never detected GAT1-mediated current in the absence of GABA (compare also Risso et al., 1996), except in the experiments with VGB that stimulates a current with similar voltage dependence as seen with GABA, suggesting that VGB is accepted as transported substrate. On the other hand, comparison of the results of uptake and steady-state current measurements suggests that GAT1 can operate in the presence of GABA either in the GABA-transporting mode or in a non-transporting electrogenic mode: in the presence of GABA a rate of uptake of about 100 fmol s−1 (see Figure 2) would correspond to a current of −10 nA assuming that GAT1 operates in the 1 GABA/2 Na+/1 Cl− mode. The resting potential of an oocyte in GABA-containing solution is between −20 and −10 mV. At this potential a current of 50 nA at least can be detected in the voltage-clamp experiments. In addition, in a few preliminary measurements of GABA uptake under voltage clamp, we obtained at −60 mV an uptake rate of 191±19 fmol s−1 (n=4, corresponding to about −20 nA) and measured a GABA-induced current of −295±25 nA. At −100 mV the rate of uptake increases by a factor of 1.3, the current by a factor of 2.2. These discrepancies between estimated and actually measured currents suggests a non-transporting mode, which contributes to the total current at least 4–10 times more than the GABA-uptake mode. Whether the non-transporting mode is a pore-forming conformation of the transporter (see Cammack & Schwartz, 1996) or operates in a carrier-like mode, cannot yet be decided. The most straightforward interpretation would be a mode with alternating gates (Läuger et al., 1980), but an alternative model of two separate pathways cannot be excluded.
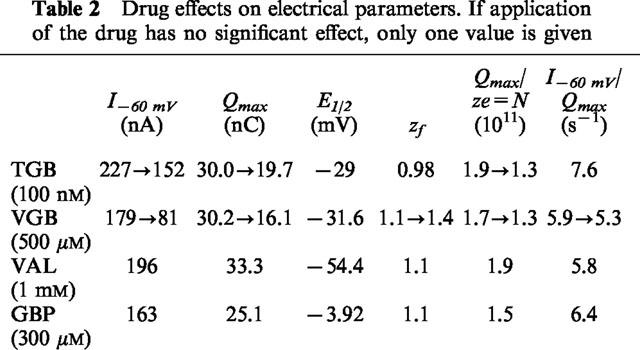
The transient charge movements in the absence of GABA are supposed to reflect voltage-dependent interaction of external Na+ ions with the transporter (Mager et al., 1993; 1996; Liu et al., 1998), an essential step in the reaction cycle proceeding GABA binding and translocation. The zf value (equation 2) represents the fraction of an elementary charge e that is effectively moved during the voltage-dependent step. The ratio Qmax/zfe, therefore, is a measure for the number of transporters, and is in the range of 1.5 to 1.9·1011 per oocyte (see Table 2). From the membrane capacitance of about 250 nF (data not shown), a surface area of 0.25 cm2 (assuming 1 μF cm−2) and a density of transporters of 6–7.6·103 per μm2 can be estimated. The ratio I/Qmax of the steady-state current I at a given potential and of maximum charge movement Qmax provides the transport rate at this potential, and is in the range of 5.8 to 7.6 s−1 at −60 mV (see Table 2). These values for transporter density and turnover rate are compatible with the values estimated previously from GABA-induced currents and charge movements in the oocytes (Mager et al., 1993). On the other hand, Risso et al. (1996) calculated a density of about 105 μm−2 from GAT1-mediated currents in transfected HeLa cells assuming a turnover rate of 10 s−1. The authors took such an obviously very high density as evidence that the rate of charge translocation was much higher, and proposed that GAT1 could exist also in a channel mode as had previously been suggested (Cammack et al., 1994). Our values are based on the assumption that Qmax and I originate from the same number of transporters. If Qmax arises only from the fraction of transporters that can operate in the GABA-transporting mode, then only one fifth to one tenth of I (see above) should be considered for the calculation.
Table 2.
Drug effects on electrical parameters. If application of the drug has no significant effect, only one value is given
Tiagabine
Of the four anticonvulsant drugs tested, TGB is the most potent in inhibiting GABA uptake when applied in micromolar concentrations. TGB (20 μM) produces a nearly complete inhibition of GABA uptake (Figures 2 and 3) and also of GAT1-mediated steady-state current (Figure 4) and transient charge movements (Figure 7). This inhibition and its nearly irreversible binding justifies the usage of [3H]-tiagabine in counting the transporters (Mager et al., 1996). On the other hand, the concentrations for 50% inhibition of the flux and electrical measurements clearly differ (see Table 1), but this discrepancy may in part be ascribed to the different techniques applied to measure transport activity, and may in part reflect different sensitivity of the different transport modes for TGB. Those transporters that are not blocked in the presence of TGB exhibit the same characteristics as in the absence of the drug: the time constants of the transients (Figure 7), the voltage-dependence of charge distribution as well as the transport rate are not affected. TGB simply reduces the number of functioning transporters per oocyte (see also Table 2). Our data are in concert with the electrophysiological mechanism of seizure suppression by TGB. In treatment of epilepsy inhibition of the uptake will result in an elevated concentration of GABA in the synaptic cleft. It has been shown that application of 20 μM TGB results in prolongation of inhibitory postsynaptic currents (IPSC) and potentials (IPSP) (Roepstorff & Lambert, 1992), and in genetically epileptic mice, application of TGB increases the duration of IPSCs and IPSPs to those of control mice, reduces disinhibition in paired-pulse protocols, and is capable in suppressing seizures (Lambert et al., 1996; Fueta et al., 1998).
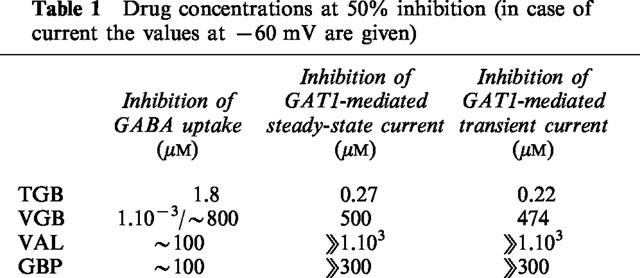
Table 1.
Drug concentrations at 50% inhibition (in case of current the values at −60 mV are given)
Vigabatrin
The results of this study indicate that VGB has a more complex mechanism of inhibition of the GABA transporter. Only at very high concentrations, in the range of 500 μM, VGB inhibits (like TGB) all three GAT1-mediated signals: uptake, steady-state current and transient charge movements (see Table 1). In contrast to TGB, VGB speeds up the time course of the transient signals at these high concentrations (Figure 8b) suggesting that VGB modulates the transport cycle. The stimulation of GAT1-mediated current by VGB in the absence of GABA supports the view that VGB can replace GABA and is transported as a substrate (see Figure 5c, compare also Schousboe et al., 1986; Leach et al., 1996); this may account for the slightly reduced transport rate (Table 2). The well-known uptake inhibitor nipecotic acid has also been proposed to act as a substrate, based on the observation that nipecotic acid, in contrast to TGB, only slightly prolongs IPSC but reduces its amplitude (Roepstorff & Lambert, 1992), and that it can induce in the absence of GABA a current (Mager et al., 1993) with voltage dependence similar to the GABA-induced current (own observations). Nevertheless, transport of VGB by GAT1 still needs to be demonstrated directly.
The complex dependency of the GABA uptake on VGB concentration can be explained if two independent sites of interaction with VGB are assumed (see Figure 10a): in addition to a transport site that accepts GABA as well as VGB, represented by the right site in the state symbols, an inhibitor site is assumed, represented by the left site in the state symbols. That two binding sites are involved is supported by the finding that the concentration-dependent inhibition of the charge movements could be described with a Hill coefficient of n=1.51. Of course, other models are also able to account for the dependence on VGB concentration, but the reaction scheme in Figure 10 represents the minimum model that can describe the partial relief of block at micromolar concentrations. At these concentrations completion of the transport cycle for GABA translocation, after binding of VGB to the inhibitor site, is assumed to go through k45. Using the diagram method developed for analysis of electrical networks by Kirchhoff (1847) and of enzyme reactions by King & Altman (1956), the probabilities of the states in steady-state can be described by the rate coefficients (see Appendix). Due to the large number of transitions, determination of the transition rates from the available data is impossible, and we rather tried to fit the equation A2 (of the Appendix) to the measured data of GABA uptake as a function of VGB concentration. In this equation all the terms with the same power in VGB concentration are lumped together. The result of the fit is shown in Figure 10b. The aim of this illustration is just to show that such a two-site model for VGB (an inhibitory and a transport site) can in principle describe the complex concentration dependence found in the flux measurements. The finding that VGB seems to be accepted as substrate with an apparent Km value of about 0.5 mM suggests that the transport site is a low-affinity and the inhibitory site a high-affinity site. In this case, very low concentrations produce inhibition of transport, at micromolar concentrations GABA translocation becomes possible through the PVO→PVG transition.
Figure 10.
To explain the ineffectiveness of VGB in blocking GAT1-mediated current at the low concentrations, we can assume different effects of VGB on the two transport modes, on the electrogenic substrate-transporting mode and on the electrogenically dominating non-transporting mode; the latter one effected only at the higher concentration. We have discussed above the existence of such modes in the oocytes (Cammack & Schwartz, 1996, see also Risso et al., 1996) in accounting for the discrepancy between the current calculated from GABA uptake and the current actually measured under voltage clamp conditions. Also the higher KI values found for inhibition of uptake by TGB compared with those for inhibition of current and charge movement can be ascribed to different effects on the modes of operation.
Though VGB has been shown to be an inhibitor of GABA transaminase, our results demonstrate that VGB can also act as an inhibitor of GABA transport at extremely low (nanomolar range) as well as extremely high (millimolar range) concentrations, and thus contributes to elevation of GABA concentration in the synaptic cleft. The proconvulsant effect previously reported by other investigators (see e.g. Löscher et al., 1989; Jackson et al., 1994; Veliskova et al., 1996) have been attributed to different concentration dependencies of different components of the GABAergic system (for a discussion see Jackson et al., 1994) including VGB acting on GABA receptor or as `false' transmitter taken up by the transporter and, therefore, reducing the release of GABA. Our findings of the different concentration dependencies of direct inhibition of GAT1 and of being taken up would be in line with the later interpretation.
Valproate and gabapentin
The existence of two modes of operation is also supported by the findings with VAL and GBP. Both drugs efficiently inhibit GABA uptake, but are without effect on the electrical signals. This suggests that VAL and GBP allow the transporter to continue ion translocation, but restrict GABA from getting coupled to the transport. Nevertheless, the presence of GABA is necessary, but these drugs are not transported like VGB since in the absence of GABA, application of VAL or GBP could not induce a current (not illustrated). Though these drugs are not as efficient as TGB, their inhibitory effect on GABA uptake may contribute to raising GABA levels and to their efficacy as antiepileptic drugs.
Conclusion
The results of this work are summarized in the cartoon shown in Figure 11. In the presence of GABA the GAT1 can operate in a GABA-transporting mode (Figure 11a right), and/or in a mode where just the ions are translocated (Figure 11a left). The most likely interpretation would be an alternating-gate model (Läuger et al., 1980) that can acquire with a certain probability a pore conformation (channel mode). The existence of a channel mode of a transporter has first been shown for the anion exchanger of red blood cells (Passow et al., 1988). Also for neurotransmitter transporters a pore conformation has been suggested though the single-channel conductance may be extremely low (see DeFelice & Blakely, 1996).
Figure 11.
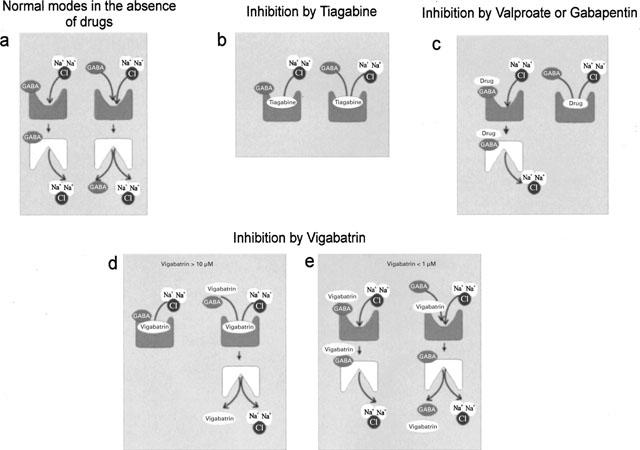
Cartoon illustrating the interaction of antiepileptic drugs with GAT1. The left-side symbols of each pair represent the mode in which only the ions are transported, the right side symbol the mode in which substrate can be transported. Upwards oriented symbols represent transporters with outward-directed binding sites, downwards oriented symbols with inward-directed binding sites.
(1) TGB, well known as an inhibitor of GABA uptake, blocks both of these modes (Figure 11b) in the micromolar range though with slightly different KI values. (2) VAL, known to be an inhibitor of GABA transaminase, and GBP, known to stimulate synthesis of GABA, efficiently suppress GAT1-mediated GABA uptake (Figure 11c right) at concentrations applied in medical treatment but are in contrast to TGB without effect on the non-GABA transporting mode (Figure 11c left). (3) VGB blocks at high concentrations both modes of transport but we suggest that VGB may also replace GABA in being transported (Figure 11d). To prove that VGB is accepted as substrate, uptake of VGB still needs to be demonstrated directly. The electrogenic contribution from the VGB-transporting mode is small compared to that of the non-transporting mode, which, nevertheless, needs the presence of GABA. At low concentrations, VGB blocks uptake but may also be transported to a small extent (Figure 11e).
Inhibition of the GABA transporter will result in membrane hyperpolarization as a result of inhibition of the channel mode and in an increase of GABA concentration in the synaptic cleft as a result of inhibition of the transport mode. It is difficult to estimate to what extent the hyperpolarization (up to 20 mV in the oocyte) is of pharmacological significance. The GABA concentration, on the other hand, is a dominating factor in the efficacy of inhibition in the central nervous system (Golan et al., 1996), and hence its elevation by inhibition of GAT1 can be expected to contribute to the antiepileptic action of the drugs.
Acknowledgments
We thank Drs Jürgen Rettinger and Yanhong Liu for fruitful discussion, and Dr Chau H. Wu for his reading and comments on the manuscript. We are also grateful to Heike Biehl and Eva-Marie Gärtner for their technical assistance, and we like to thank Drs Erwin-Josef Speckmann and Ulrich Mußhoff for providing the anticonvulsant drugs.
Abbreviations
- GABA
γ-aminobutyric acid
- VAL
valproic acid
- GBP
gabapentin
- VGB
vigabatrin
- TGB
tiagabine
- TEVC
two-electrode voltage clamp
Appendix
According to the Kirchhoff-King-Altman method, the probabilities of the states Pi given in the diagram (Figure 10) can be described by
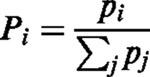 |
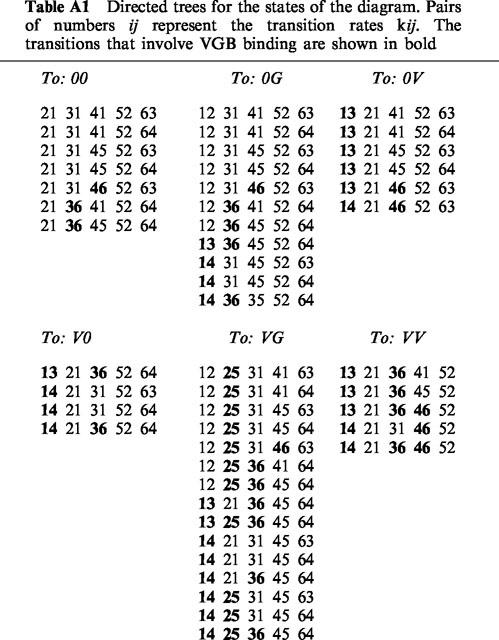
with the indices representing the states the klj are directing to, and pj are given by the sum of the trees listed in Table A1. The uptake can be expressed as:
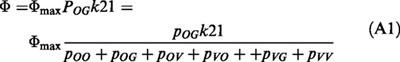 |
Inspection of the trees in Table A1 yields that this expression has the form:
Table A1.
Directed trees for the states of the diagram. Pairs of numbers ij represent the transition rates kij. The transitions that involve VGB binding are shown in bold
References
- BARISH M.E. A transient calcium-dependent chloride current in the immature Xenopus oocyte. J. Physiol. 1983;342:309–325. doi: 10.1113/jphysiol.1983.sp014852. [DOI] [PMC free article] [PubMed] [Google Scholar]
- BORDEN L.A. Gaba transporter heterogeneity – pharmacology and cellular localization. Neurochem. Int. 1996;29:335–356. doi: 10.1016/0197-0186(95)00158-1. [DOI] [PubMed] [Google Scholar]
- CAMMACK J.N., RAKHILIN S.V., SCHWARTZ E.A. A GABA transporter operates asymmetrically and with variable stoichiometry. Neuron. 1994;13:949–960. doi: 10.1016/0896-6273(94)90260-7. [DOI] [PubMed] [Google Scholar]
- CAMMACK J.N., SCHWARTZ E.A. Channel behavior in a gamma-aminobutyrate transporter. PNAS. 1996;93:723–727. doi: 10.1073/pnas.93.2.723. [DOI] [PMC free article] [PubMed] [Google Scholar]
- DEFELICE L.J., BLAKELY R.D. Pore models for transporters. Biophys. J. 1996;70:579–580. doi: 10.1016/S0006-3495(96)79604-2. [DOI] [PMC free article] [PubMed] [Google Scholar]
- ECKSTEIN-LUDWIG U., FEI J., SCHWARZ W. Inhibition of GABA transporter by tiagabine and vigabatrin. Pflügers Arch. 1999;437 Suppl:R97. [Google Scholar]
- ECKSTEIN-LUDWIG U., SCHWARTZ W. Inhibition of neuronal GABA transporter GAT1 expressed in Xenopus oocytes by various antiepileptic drugs. Europ. J. Neurosc. 1998;10 Suppl:353. [Google Scholar]
- FUETA Y., SCHWARZ W., FUKATA K., OHNO K. Antiepileptic effects of γ-aminobutyric acid transporter inhibitor tiagabine and its regionally different effects on paired-pulse responses in the hippocampal slices of epileptic E1 mice. Studia Biophysica. 1998;24:1940. [Google Scholar]
- GOLAN H., TALPALAR A.E., SCHLEIFSTEIN-ATTIAS D., GROSSMAN Y. GABA metabolism controls inhibition efficacy in the mammalian CNS. Neurosci. Let. 1996;217:25–28. doi: 10.1016/0304-3940(96)13061-5. [DOI] [PubMed] [Google Scholar]
- GUASTELLA J., NELSON N., NELSON H., CZYZYK L., KEYNAN S., MIEDEL M.C., DAVIDSON N., LESTER H.A., KANNER B.I. Cloning and expression of a rat brain GABA transporter. Science. 1990;249:1303–1306. doi: 10.1126/science.1975955. [DOI] [PubMed] [Google Scholar]
- JACKSON M.F., DENNIS T., ESPLIN B., CAPEK R. Acute effects of gamma-vinyl GABA (vigabatrin) on hippocampal GABAergic inhibition in vitro. Brain Res. 1994;65:85–91. doi: 10.1016/0006-8993(94)90682-3. [DOI] [PubMed] [Google Scholar]
- JUNG M.J., PALFREYMAN M.G.Vigabatrin – mechanisms of action Anti-epileptic Drugs 1995Raven Press, Ltd: New York; 903–913.In: R.H. Levy, R.H. Mattson & B.S. Meldrum. (eds)4. edition [Google Scholar]
- KING E.L., ALTMAN C. Schematic method of deriving the rate laws for enzyme-catalyzed reactions. J. Phys. Chem. 1956;60:1375–1378. [Google Scholar]
- KIRCHHOFF G. Ueber die Auflösung der Gleichungen, auf welche man bei der Untersuchung der linearen Vertheilung galvanischer Ströme geführt wird. Poggendorfs Ann. Phys. Chem. 1847;72:497–508. [Google Scholar]
- LAFAIRE A.V., SCHWARZ W. Voltage dependence of the rheogenic Na+/K+ ATPase in the membrane of oocytes of Xenopus laevis. J. Membrane Biol. 1986;91:43–51. doi: 10.1007/BF01870213. [DOI] [PubMed] [Google Scholar]
- LAMBERT J.D.C., FUETA Y., ROEPSTORFF A., ANDREASEN M. Analysis of the kinetics of synaptic inhibition points to a reduction in GABA release in area CA1 of the genetically epileptic mouse, E1. Epilepsy Res. 1996;26:15–23. doi: 10.1016/s0920-1211(96)00035-6. [DOI] [PubMed] [Google Scholar]
- LÄUGER P., STEPHAN W., FREHLAND E. Fluctuations of barrier structure in ionic channels. Biochim. Biophys. Acta. 1980;602:167–180. doi: 10.1016/0005-2736(80)90299-0. [DOI] [PubMed] [Google Scholar]
- LEACH J.P., SILLS G.J., BUTLER E., FORREST G., THOMPSON G.G., BRODIE M.J. Neurochemical actions of vigabatrin and tiagabine alone and in combination in mouse cortex. Gen. Physiol. Biophys. 1997;28:715–719. doi: 10.1016/s0306-3623(96)00357-6. [DOI] [PubMed] [Google Scholar]
- LEACH J.P., SILLS G.J., MAJID A., BUTLER E., CARSWELL A., THOMPSON G.G., BRODIE M.J. Effects of tiagabine and vigabatrin on GABA uptake into primary cultures of rat cortical astrocytes. Seizure. 1996;5:229–234. doi: 10.1016/s1059-1311(96)80041-0. [DOI] [PubMed] [Google Scholar]
- LIU Q.R., LOPEZ-CORCUERA B., NELSON H., NELSON N. Molecular characterization of four pharmacologically distinct γ-aminobutyric acid transporters in mouse brain. J. Biol. Chem. 1992;268:2106–2112. [PubMed] [Google Scholar]
- LIU Y., ECKSTEIN-LUDWIG U., FEI J., SCHWARZ W. Effect of mutation of glycosilation sites on the Na+ dependence of steady-state and transient current generated by the neuronal GABA transporter. Biochim. Biophys. Acta. 1998;1415:246–254. doi: 10.1016/s0005-2736(98)00200-4. [DOI] [PubMed] [Google Scholar]
- LÖSCHER W. New visions in the pharmacology of anticonvulsion. Eur. J. of Pharmacol. 1998;342:1–13. doi: 10.1016/s0014-2999(97)01514-8. [DOI] [PubMed] [Google Scholar]
- LÖSCHER W., JACKEL R., MÜLLER F. Anticonvulsant and proconvulsant effects of inhibitors of GABA degradation in the amygdala-kindling model. Europ. J. Pharmacol. 1989;163:1–14. doi: 10.1016/0014-2999(89)90389-0. [DOI] [PubMed] [Google Scholar]
- LÜCKE A., MUßHOFF U., KÖHLING R., OSTERFELD M., MAYER T., WOLF P., SCHÜTTE W., SPECKMAN E.J. Gabapentin potentiation of the antiepileptic efficacy of vigabatrin in an in vitro model of epilepsy. Br. J. Pharmacol. 1998;124:370–376. doi: 10.1038/sj.bjp.0701825. [DOI] [PMC free article] [PubMed] [Google Scholar]
- MAGERS S., KLEINBERGERDORON N., KESHET G.I., DAVIDSON N., KANNER B.I., LESTER H.A. Ion-binding and permeation at the gaba transporter gat1. J. Neurosci. 1996;16:5405–5414. doi: 10.1523/JNEUROSCI.16-17-05405.1996. [DOI] [PMC free article] [PubMed] [Google Scholar]
- MAGER S., NAEVE J., QUICK M., LABARCA C., DAVIDSON N., LESTER H.A. Steady-states, charge movements, and rates for a cloned gaba transporter expressed in Xenopus oocytes. Neuron. 1993;10:177–188. doi: 10.1016/0896-6273(93)90309-f. [DOI] [PubMed] [Google Scholar]
- MILEDI R. A calcium-dependent transient outward current in Xenopus-laevis oocytes (Article) Proc. Royal Soc. B. 1982;215:491–497. doi: 10.1098/rspb.1982.0056. [DOI] [PubMed] [Google Scholar]
- NELSON H.O., MANDIYAN S. Cloning of human brain GABA transporter. FEBS Letters. 1990;269:181–184. doi: 10.1016/0014-5793(90)81149-i. [DOI] [PubMed] [Google Scholar]
- ÖSTERGAARD L.H., GRAM L., DAM M.Potential anti-epileptic Drugs – Tiagabine Anti-epileptic Drugs 1995Raven Press, Ltd. New York; 1057–1061.In: R.H. Levy, R.H. Mattson & B.S. Meldrum (eds)4. edition [Google Scholar]
- PASSOW H., SCHWARZ W., GLIBOWICKA M., ARANIBAR N., RAIDA M.Studies of erythroid band 3 protein-mediated anion transport in red blood cells and in Xenopus oocytes Molecular Basis of Biomembrane Transport 1988Elsevier Sc. Publ. B.v. Amsterdam; 121–139.In: F. Palmieri & E Quagliariello (eds) [Google Scholar]
- RISSO S., DEFELICE L.J., BLAKELY R.D. Sodium-dependent GABA-induced currents in GAT1-transfected HeLa cells. J. Physiol. 1996;490:691–702. doi: 10.1113/jphysiol.1996.sp021178. [DOI] [PMC free article] [PubMed] [Google Scholar]
- ROEPSTORFF A., LAMBERT J.D.C. Comparison of the effect of the GABA uptake blockers, tiagabine and nipecotic acid, on inhibitory synaptic efficacy in hippocampal CA1 neurones. Neurosc. Let. 1992;146:131–134. doi: 10.1016/0304-3940(92)90060-k. [DOI] [PubMed] [Google Scholar]
- SCHLOSS P., MAYSER W., BETZ H. Neurotransmitter transporters: A novel family of integral plasma membrane proteins. FEBS Letters. 1992;307:76–80. doi: 10.1016/0014-5793(92)80905-v. [DOI] [PubMed] [Google Scholar]
- SCHMALZING G., OMAY H., KRÖNER S., GLOOR S., APPELHANS H., SCHWARZ W. Up-regulation of sodium pump activity in Xenopus laevis oocytes by expression of heterologous β1 subunits of the sodium pump. Biochem. J. 1991;279:329–336. doi: 10.1042/bj2790329. [DOI] [PMC free article] [PubMed] [Google Scholar]
- SCHOUSBOE A., LARSSON O.M., SEILER N. Stereoselective uptake of the GABA-transaminase inhibitors γ-vinyl GABA and γ-acetylenic GABA into neurons and astrocytes. Neurochem. Res. 1986;11:1497–1505. doi: 10.1007/BF00965769. [DOI] [PubMed] [Google Scholar]
- TAM A.C.W., GUO L.-H., LAM D.M.K. Cloning and sequencing of mouse GABA transporter complementary DNA. Cell Research. 1994;4:109–116. [Google Scholar]
- TAYLOR C.P.Gabapentin – mechanisms of action Anti-epileptic drugs 1995Raven Press, Ltd. New York; 829–841.In: R.H. Levy, R.H. Mattson & B.S. Meldrum (eds)4. edition [Google Scholar]
- VELISKOVA J., VELISEK L., NUNES M.L., MOSHE S.L. Developmental regulation of regional functionality of substantia nigra GABAA receptors in seizures. Europ. J. Pharmacol. 1996;309:167–173. doi: 10.1016/0014-2999(96)00341-x. [DOI] [PubMed] [Google Scholar]