Abstract
The inducible isoform of nitric oxide synthase (iNOS) may be involved in the pathogenesis of inflammatory bowel disease. Using the human intestinal epithelial cell line, Caco-2, iNOS expression, regulation and sensitivity to the glucocorticoid, dexamethasone after cytokine exposure and its relationship to the degree of differentiation has been studied.
NOS activity, assessed by NO2− and NO3− release, was time-dependently increased after exposure to interferon γ alone or in combination with interleukin-1β and tumour necrosis factor α.
Cytokine-induced iNOS activity was increased with days in culture over 20 days and number of passages, suggesting iNOS up-regulation during enterocyte-like differentiation. This activity was inhibited by the selective iNOS inhibitor 1400 W (0.1–100 μM). In addition, iNOS protein induction was confirmed by Western blot.
Actinomycin D (5 μg ml−1) inhibited cytokine-induced iNOS activity, protein expression and mRNA level. Pyrrolidine dithiocarbamate (PDTC: 10–200 μM) and 3,4 dichloroisocoumarin (0.1–100 μM) reduced cytokine-induced iNOS activity and protein expression at both day 10 and 15 after confluence. PDTC also decreased iNOS mRNA levels, suggesting NF-κB involvement in its transcription at these times.
The tyrphostins A25 and B42 reduced cytokine-induced iNOS activity at both day 10 and 15 after confluence, indicating the JAK-2 kinase is also involved at these times. The tyrphostins also reduced the iNOS protein expression.
Dexamethasone (0.1–10 μM, for 24 h) reduced cytokine-induced iNOS activity at day 15 and 20 after cell confluence, but not at day 5 or 10.
Dexamethasone (5 μM) decreased cytokine-induced iNOS protein expression at day 10 as well as at day 15 after confluence.
These findings indicate that iNOS induction and its inhibition by dexamethasone in this human intestinal epithelial cell line is dependent on the degree of differentiation.
Keywords: Inducible nitric oxide synthase, iNOS, colonic epithelial cell line, Caco-2, differentiation, NF-κB, JAK-2, glucocorticoids, 1400 W
Introduction
The inducible isoform of nitric oxide synthase (iNOS) (EC 1.14.13.39) is found in many different cell types. It is functionally calcium-independent and can be induced by cytokines and bacterial lipopolysaccharides. Once expressed, iNOS can produce sustained and substantial amounts of nitric oxide (NO), which is thought to be cytotoxic and to mediate deleterious effects (for reviews, see Knowles & Moncada, 1994; Förstermann et al., 1995). Since the first demonstration of increased calcium-independent iNOS activity in colonic tissue from patients with ulcerative colitis (Boughton-Smith et al., 1993), other studies have confirmed the increase in iNOS activity or nitric oxide (NO) release (Rachmilewitz et al., 1995), in iNOS protein (Singer et al., 1996), and in iNOS mRNA level (McLaughlin et al., 1997), in patients with inflammatory bowel disease (IBD). Studies using animal models of IBD have also shown iNOS involvement (for review see Whittle, 1997).
Macrophages and polymorphonuclear cells were initially thought to be the main source of NO during inflammatory processes. It is now clear that intestinal and colonic epithelial cells are a major site of iNOS expression, both in animal models of gut inflammation and in human IBD (Tepperman et al., 1993, 1994; Singer et al., 1996; Morin et al., 1998). The expression of iNOS has been reported in human intestinal epithelial cell lines (Radomski et al., 1991; Jenkins et al., 1994; Salzman et al., 1996; Kolios et al., 1995). In the extensively studied DLD-1 intestinal epithelial cells, the iNOS gene has been cloned, showing cDNA and amino acid sequences that are very similar to cloned human iNOS from other sources (Sherman et al., 1993). In this cell line, iNOS induction, by cytokines with or without bacterial products, is transcriptionally controlled, and involves NF-κB (Nunokawa et al., 1996; Salzman et al., 1996) and a tyrosine protein kinase (Kleinert et al., 1998a).
It is noteworthy that most of the human intestinal cell lines studied are poorly differentiated under standard growing conditions. However, because of the likely NO involvement in carcinogenic process, especially in colon or intestinal epithelial cell line (Jenkins et al., 1995; Ambs et al., 1998) and the known impairment of regulatory processes in these cells, including NF-κB/IκB pathway (Jobin et al., 1997), the current studies utilize the spontaneously well differentiated human intestinal epithelial cell line Caco-2. This cell line is considered to resemble normal intestinal epithelial cells (Zweibaum et al., 1991) and is known to process normally the NF-κB/IκB complex (Jobin et al., 1997). Previous reports have shown iNOS protein expression and RNA transcription without any cytokine stimulation (Vecchini et al., 1997) in Caco-2 and in a sub-clone of this cell line (Unno et al., 1995; Salzman et al., 1998) although the mechanisms of iNOS induction and control have not been characterized. The influence of the degree of differentiation on iNOS induction by cytokines in these cells, and the actions of NF-κB inhibitors have therefore been evaluated.
Glucocorticoids are one of the main and most effective treatments in IBD, although resistance to their actions is not uncommon during the course of these diseases (Hanauer, 1996). However, in contrast to many other cell types including inflammatory cells (Moncada & Higgs, 1993), glucocorticoids do not inhibit iNOS activity in the undifferentiated DLD-1 cells (Salzman et al., 1996). To assess whether such insensitivity could be related to the cell differentiation status, the effects of the potent glucocorticoid, dexamethasone on iNOS expression induced by cytokines were evaluated at different stages of differentiation in the Caco-2 cell line.
Methods
Cell culture
Caco-2 cells were obtained from The European Collection of Cell Culture (Salisbury, U.K.) (No 86010202) and were used between passages 31 and 41. Cells were grown in Dulbecco's modified Eagle's medium (DMEM) with 4 mM L-glutamine, 20% heat-inactivated foetal calf serum (FCS) and 1% non-essential amino-acids. Cells were cultured at 37°C in a water-saturated atmosphere of 95% air and 5% CO2, refed every 2 days and passaged weekly. Caco-2 cells were used between 5 and 20 days after confluence as indicated, to permit differentiation.
For a comparative study, the murine intestinal epithelial cell line, IEC-6, were grown in DMEM with 4 mM L-glutamine and 5% FCS and used at confluence.
Cell viability assessment
Mitochondrial respiration, an indicator of cell viability, was assessed by the mitochondrial-dependent reduction of MTT [3-(4,5-dimethylthiazol-2-yl)-2,5-diphenyltetrazolium bromide] to formazan. Cells grown in 96-well plates were incubated at 37°C for 1 h with 0.4 mM MTT. Cells were solubilized in 100 μl dimethyl sulphoxide and absorbance was read at λ=550 nm. Results were expressed as percentage of control non-treated cells.
Cell counting and protein concentration
Cells were harvested and dissociated in a solution of 0.25% trypsin and 3 mM ethylene diamine tetraacetic acid (EDTA) in phosphate buffered saline (PBS) pH 7.4 (without calcium and magnesium). After 5 min, cells were counted with a haemocytometer after adding trypan blue. Only cells that excluded dye were counted as viable cells. Results were expressed as number of viable cells per ml. The protein concentration was determined using a modification of Bradford method (Biorad kit) and serum albumin bovine as a standard. Results were expressed as mg of protein per ml.
Cell induction
Cells were grown as indicated above. After medium removal and cell monolayer wash with PBS (pH 7.4), cytokines or other agents were added to fresh medium without serum. This medium was further supplemented with 0.5 mM L-arginine. Cytokine concentrations used for induction were interferon-γ (IFN-γ) (200 u ml−1), interleukin-1 β (IL-1β) (5 ng ml−1), and tumour necrosis factor α (TNFα) (100 ng ml−1).
NOS activity assessment
Cells were stimulated in 96-well plates as indicated above. After the indicated time exposure, culture medium was removed for the determination of nitrite/nitrate production, as an index of NOS activity. To reduce nitrate (NO3−) to nitrite NO2−, 50 μl of medium was transferred in a 96-well plate and incubated for 15 min at 37°C with flavin adenine dinucleotide (50 μM), β-nicotinamide adenine dinucleotide phosphate, reduced form (500 μM) and nitrate reductase from aspergillus species (1 u ml−1) and then 5 min further with lactic dehydrogenase (100 u ml−1) and sodium pyruvate (100 mM). Then, 50 μl of Griess reagent (0.25 M phosphoric acid, 30 mM sulphanilamide, 2 mM naphthylethylene diamine) was added to each well. The resultant colour change was quantified by spectrophotometry (λ=550–650 nm). Nitrate levels were determined using a sodium nitrate standard curve and are expressed as μM 106 cells−1 according to the cell number in each well.
Brush-border enzyme activity assessment
Alkaline phosphatase and sucrase-isomaltase were assessed in whole cell homogenates obtained as for Western blotting (see below). Alkaline phosphatase: Samples from cell homogenates were incubated at 37°C in dark with 0.75 mM p-nitrophenyl phosphate (pNPP) for 15 min, leading to the formation of p-nitrophenol (pNP). The reaction was stopped with 1 M NaOH. Absorbance was then measured at λ=405 nm. Results are expressed as mU mg−1 protein, one unit corresponding to the formation of 1 μmol pNP per min at 37°C. pNP levels were assessed according to a standard curve prepared in 0.2 M Tris buffer. Sucrase-isomaltase: Homogenates samples were incubated at 37°C for 30 min with 0.140 M sucrose in 0.1 M NaH2PO4, pH 6.0. Then the reaction was stopped by tris-glucose oxidase buffer (0.5 M tris, 0.01 u ml−1 glucose oxidase type V, 1.6 u ml−1 peroxidase type II, 0.3 mM orthodianisidine diHCl), which permits glucose oxidation. Then samples and glucose standards were incubated for further 30 min at 37°C and the reaction stopped with 5 N HCl. The resultant colour change was quantified spectrophotometrically at λ=520 nm. Results are expressed as mU mg−1 protein, one unit corresponding to the formation of 1 μmol glucose per min at 37°C.
Western blotting
Cells were washed with ice-cold PBS (pH 7.4) and homogenized in Tris-mannitol buffer (2 mM Tris 7–9, 50 mM mannitol, 100 μM phenyl methyl sulphonyl fluoride, 2 μM leupeptin, 0.5 μ ml−1 aprotinin, 0.5% Triton X-100). Homogenates were sonicated twice for 10 s on ice and spun for 15 min at 21,000×g at 4°C. Aliquots of 100 μg of total cellular protein were denatured by mixing and boiling v v−1 with 20 mM Tris 7–9, 2 mM EDTA, 2% sodium dodecyl sulphate (SDS), 10% β-mercaptoethanol, 20% glycerol. The samples were electrophoresed on 7.5% SDS-polyacrylamide gel, and transferred to nitro-cellulose membrane (Amersham, Little Chalfont, U.K.). After blocking with PBS (pH 7.4), 0.25% tween 20 (v v−1) and 5% non-fat dried milk, membrane was probed with anti-iNOS polyclonal antibody (1/500) (Autogen Bioclear, Calne, U.K.) for 1 h at room temperature, washed with PBS-tween 20 and then incubated with horseradish peroxidase-conjugated second antibody (1/4000) for 1 h at room temperature. Membranes were developed, using an enhanced chemiluminescence system (Amersham) and exposed to Hyperfilm (Amersham). Films were analysed using the Molecular Analyst Software (BioRad Laboratories, Hercules, CA, U.S.A.) after scanning on a densitometer (GS-700 Imaging Densitometer, BioRad Laboratories).
Northern blotting
The iNOS cDNA probe was obtained by polymerase chain reaction (PCR) amplification of iNOS RNA from cytokine-induced DLD-1 cells. The following primers were used to amplify the 3590- to 3848-bp region of human iNOS cDNA according to the published sequence (GenBank accession number: L09210), leading to a 259 bp fragment: 5′-CGG TGC TGT ATT TCC TTA CGA GGC GAA GAA GG and 5′-GGT GCT GCT TGT TAG GAG GTC AAG TAA AGG GC. Then, the positive band was excised from the agarose gel and cDNA purified using a commercially available kit (Geneclean kit, Bio 101 Inc. La Jolla, CA, U.S.A.). Total RNA from cell monolayers was extracted using Trizol (Gibco BRL, Paisley, U.K.). The amount of RNA was calculated from optical density measurements at λ=260 nm. Ten μg of total RNA were loaded on a 1% denaturing agarose gel, containing 2 M formaldehyde and 6 mM 3(N-morpholino)propanesulphonic acid. RNA was transferred onto an uncharged nylon membrane followed by hybridization (QuikHyb hybridization solution, Stratagene, Cambridge, U.K.). The iNOS cDNA was radiolabelled with [32P]-dCTP by the random primer method (Multiprime DNA labelling system, Amersham). A photograph of agarose gel stained with ethidium bromide was taken as control of equivalent loading between lanes. Films were analysed as described for Western blot.
Statistical analysis
Data are shown as means±s.e.mean from at least three independent experiments, each conducted in triplicate. Northern blot and Western blot are shown as representative photographs of three independent experiments. Statistical significance was assessed by Student's t-test where P<0.05 was taken as significant.
Chemicals
The iNOS antibody was from Santa Cruz Biotechnology (Autogen Bioclear, Calne, U.K.). Human TNFα was from R&D Systems, Abingdon, U.K. Nitrate reductase was from Boehringer Mannheim, Lewes, U.K. Methanol and ethanol were from BDH Laboratories Supplies, Lutterworth, U.K. Bis-acrylamide solution and protein assay kit were from Bio-Rad Laboratories, Hertfordshire, U.K. DMEM, non-essential amino acids, Trizol and primers were obtained from Gibco BRL, Paisley, U.K. Tyrphostins A25 [α-cyano-(3,4,5-trihydroxy)cinnamonitrile] and B42 (N-Benzyl-3,4-dihydroxybenzylidenecyanoacetamide) were from Calbiochem, Nottingham, U.K. 1400 W (N-(3-(aminomethyl)benzyl)acetamidine) was a kind gift from Dr R. Knowles, GlaxoWellcome Research, Stevenage, U.K. All other compounds and chemicals were purchased from Sigma, Poole, U.K.
Results
NOS activity after cytokine exposure in Caco-2 cells
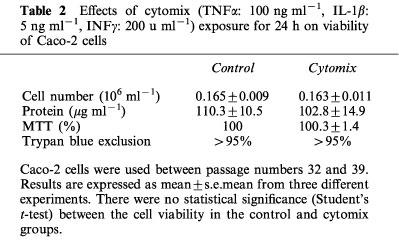
A low level of NOx (NO2− and NO3−) was detectable in control cells exposed for 24 h to vehicle alone (PBS, pH 7.4) at 17.7±1.6 μM 106 cells−1 when the Caco-2 cells were used 10 days after confluence. IFNγ was the only cytokine, when used alone, to significantly increase the NOx level (to 31.1±8.3 μM 106 cells−1). This effect was enhanced by addition of IL-1β or TNFα. The highest stimulation of NOx production was obtained with the three cytokines (cytomix), which reached 68.7±5.9 μM 106 cells−1. These results are summarized in Table 1. This latter mixture was then used to stimulate the cells in the remainder of this study. NO3− accounted for approximately 80% of the total NOx production. When the cells were treated with cytomix, there was an increase in NOx with time over the first 24 h (Figure 1a). Cytomix was not cytotoxic in Caco-2 cells as shown by the number of viable cells, the protein concentration, the trypan blue dye and the MTT assay (Table 2).
Table 1.
NOx production after 24 h exposure to cytokines in Caco-2 cells and action of inhibitors of de novo translation (cycloheximide) and de novo transcription (actinomycin D)
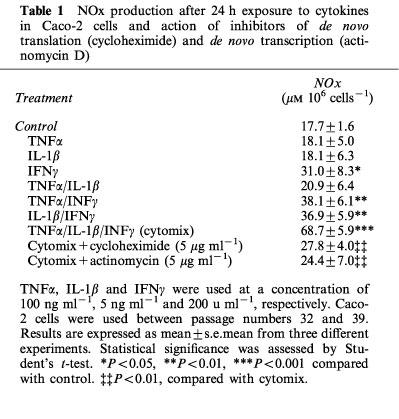
Figure 1.
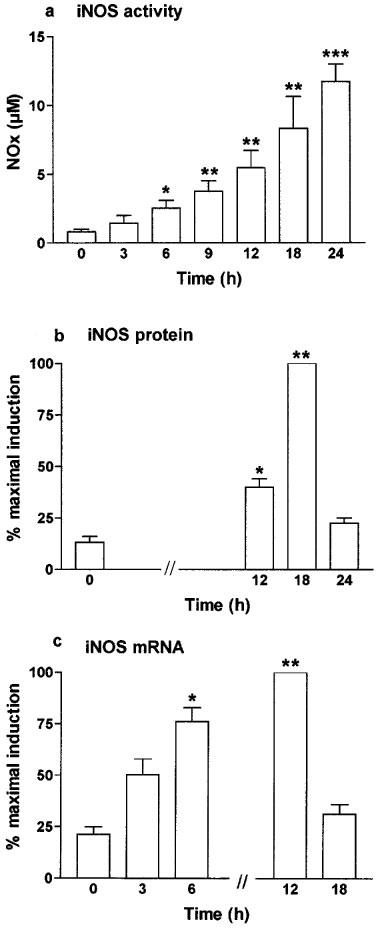
Time dependence of iNOS activity (a), iNOS protein expression (b) and iNOS mRNA steady-state level (c) after exposure to cytomix in Caco-2 cells. Caco-2 cells were used 10 days after confluence and incubated in serum free medium with cytomix (TNFα; 100 ng ml−1, IL-1β: 5 ng ml−1, IFNγ: 200 u ml−1) for the indicated period of time. (a) NOx level was determined as an index of iNOS activity in the supernatant by nitrate reduction and the Griess reaction. Results are expressed as means (±s.e.mean) from at least three different experiments, each done in triplicate. *P<0.05, **P<0.01, ***P<0.001 compared with value at 0 h. (b) iNOS protein expression was determined by Western blot. (c) iNOS mRNA level was determined by Northern blot. In (b and c) results represent means (±s.e.mean) of three different densitometry analyses and are expressed as the percentage of maximal induction.
Table 2.
Effects of cytomix (TNFα: 100 ng ml−1, IL-1β: 5 ng ml−1, INFγ: 200 u ml−1) exposure for 24 h on viability of Caco-2 cells
Cytomix-induced NOS activity and enterocytic-like differentiation in Caco-2 cells
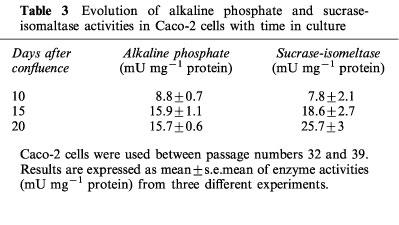
The activity of two of the brush-border hydrolases, sucrase isomaltase and alkaline phosphatase, increased with time over the 20 days period. At day 15 and 20 the levels of these enzymes were significantly greater than those at day 10, indicative of a more differentiated phenotype at these times (Table 3).
Table 3.
Evolution of alkaline phosphate and sucrase-isomaltase activities in Caco-2 cells with time in culture
There was an increase in NOx production by these cells with the number of days in culture after confluence. Indeed, cytomix-induced NOx production increased from 30.9±1 μM 106 cells−1 at day 5 after confluence to 107.5±5.7 μM 106 cells−1 at day 20 after confluence (Figure 2a). Moreover, NOx production increased with passages (Figure 2b). There was no significant change in the NOx level in control non-stimulated cells with days in culture (18±7.8 μM 106 cells−1 at day 5 vs 11.9±3.0 μM 106 cells−1 at day 15, P>0.05) or passages (17.35±2.2 μM 106 cells−1 at passages 32–33, day 10 vs 20.05±2.4 μM 106 cells−1 at day 10, passages 38–39, P>0.05).
Figure 2.
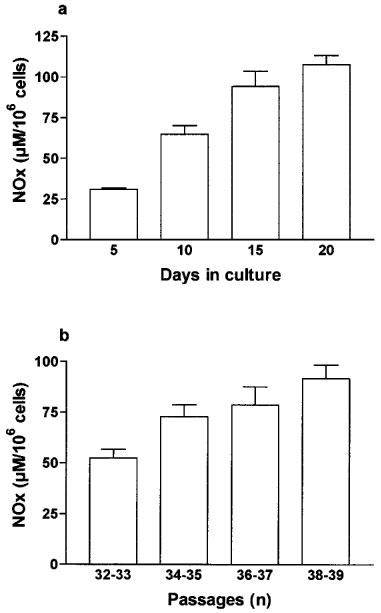
NOx production after cytomix exposure was increased with days in culture (a) and with passages (b) in Caco-2 cells. (a) Caco-2 cells (passages 34 to 37) were used between 5 and 20 days after confluence as indicated and incubated for 24 h with cytomix. (b) Caco-2 cells were used 10 days after confluence in each set of passages and incubated for 24 h with cytomix. In (a and b) NOx level was determined in the supernatant by nitrate reduction and the Griess reaction. Results are expressed as means (±s.e.mean) from at least three different experiments, each done in triplicate.
Characterization of iNOS in Caco-2 cells
The calcium inhibitor, EGTA (ethylene glycol-bisaminoethyl ether) (0.1–1 mM, range) had no action against cytomix-induced NOx production (96±6% and 99±6% of the control value with 0.1 mM and 1 mM EGTA, respectively). Likewise, EGTA had no effect on non-induced NOx production (84.1±8% and 88±8% of the control value with 0.1 mM and 1 mM EGTA, respectively).
NOx production induced by cytomix was concentration-dependently inhibited by the isoform non-selective NOS inhibitor L-NG-nitroarginine (L-NOARG) Figure 3a) and by the highly selective iNOS inhibitor, 1400 W (Figure 3b), with IC50 value of 11.5±1.8 μM and 4.7±1.7 μM, respectively. With 1400 W (100 μM) the cytomix-induced NOx was inhibited by 99±1% (P<0.001).
Figure 3.
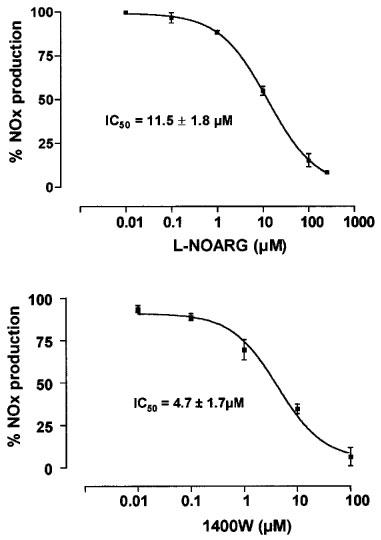
Dose dependent inhibition of cytomix-induced NOx production by NOS inhibitors in Caco-2 cells. Caco-2 cells (passages 32 to 39) were used 10 days after confluence. They were treated in serum free medium for 24 h with cytomix alone or with increasing concentrations of the non-selective NOS inhibitor L-NG-nitroarginine (L-NOARG) (a) and of the highly selective iNOS inhibitor 1400 W (b). NOx level was determined in the supernatant by nitrate reduction and the Griess reaction. Results are expressed as percentage of maximal induction (without NOS inhibitor). Each point represents the mean (±s.e.mean) from at least three different experiments, each done in triplicate. IC50 are given as mean±s.e.mean.
1400 W also inhibited in a concentration-dependent manner, the resting NOx level in the control cells to reach 6.78±1.87 μM 106 cells−1 with 1400 W (100 μM) representing an inhibition of 62±9% (P<0.01, compared with untreated cells) of the unstimulated NOx production.
The expression of iNOS protein was confirmed by Western blot after treatment with cytomix for 18 h with a strong increase of the faint band observed in non-treated cells (Figure 4a). The iNOS protein was transiently expressed with a maximal expression at 18 h and decreased at 24 h to reach basal level (Figure 1b). Cycloheximide (5 μg ml−1), a translation inhibitor, reduced NOx production (Table 1) and iNOS protein expression (Figure 4a) to levels close to that observed in control cells.
Figure 4.
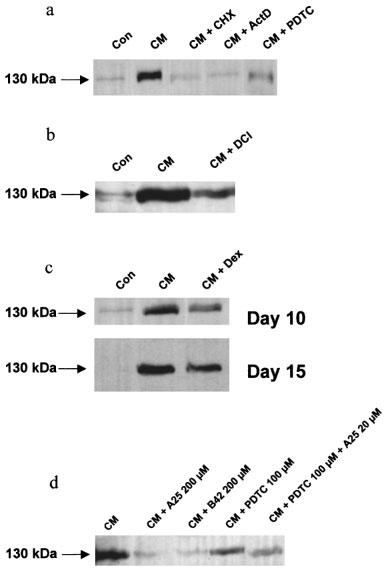
Inducible NOS protein expression in Caco-2 cells assessed by Western blot. The inducible NOS protein expression was determined by Western blot using a polyclonal iNOS antibody. Each panel is a representative of three different experiments. (a) Caco-2 cells (passages 32 to 39) were used 10 days after confluence. Cells were treated for 18 h with vehicle alone (Con), cytomix (CM), cytomix and cycloheximide (CHX) (5 μg ml−1, added concurrently), cytomix and actinomycin D (ActD) (5 μg ml−1, added concurrently), or cytomix and pyrrolidine dithiocarbamate (PDTC) (200 μM, 2 h pre-treatment). (b) Caco-2 cells were used 10 days after confluence. Cells were treated for 18 h with vehicle alone (Con), cytomix (CM) or cytomix and dichloroisocoumarin (DCI) (200 μM, 2 h pre-treatment). (c) Caco-2 cells were used 10 or 15 days after confluence as indicated. Cells were treated for 18 h with vehicle alone (Con), cytomix (CM), or cytomix and dexamethasone (Dex) (5 μM). (d) Caco-2 cells were used 10 days after confluence. Cells were treated for 18 h with vehicle alone (Con), cytomix (CM), or cytomix and tyrphostin A25 (200 μM), cytomix and tyrphostin B42 (200 μM), cytomix and PDTC (100 μM, 2 h pre-treatment), or cytomix, PDTC (100 μM) and A25 (20 μM).
iNOS transcriptional induction and NF-κB inhibitors
In Caco-2 cells used 10 days after confluence, Northern blot analyses showed a very low level of iNOS mRNA in control cells with a substantial increase in cytomix-treated cells, reflecting increased transcription of the iNOS gene. The time course study revealed that iNOS mRNA was moderately increased 3 h after cytomix challenge, peaked at 12 h and returned after 18 h to a value close to that observed in non-stimulated cells (Figures 5a and 1c). The steady-state level of iNOS mRNA was not changed by exposure to IL-1β alone, but slightly increased after IFNγ alone and after IFNγ/IL-1β treatment (data not shown). Incubation with actinomycin (5 μg ml−1) reduced NOx production (Table 1), iNOS protein expression (Figure 4a) and RNA level (Figure 5b) to the basal values.
Figure 5.
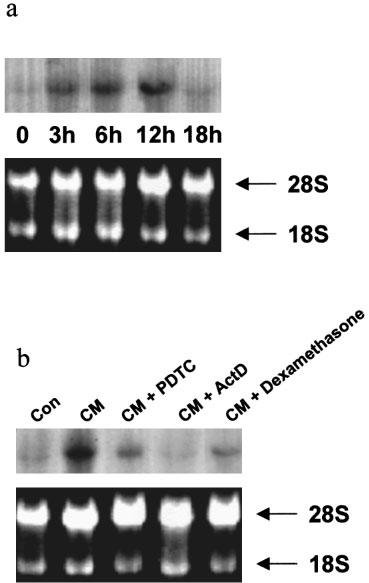
Time dependence of iNOS mRNA level after treatment with cytomix in Caco-2 cells (a) and the inhibition of its expression by pyrrolidine dithiocarbamate, actinomycin D, and dexamethasone (b). (a) Caco-2 cells (passages 32 to 39) were used 10 days after confluence and treated for the indicated time with cytomix. iNOS mRNA expression was assessed by Northern blot after standard RNA extraction. The upper panel is the Northern blot and the lower panel is the ethidium bromide staining of 28S and 18S RNA bands indicating equal loading of the lanes. This is a representative of three experiments. (b) Caco-2 cells were used 10 days after confluence and treated for 12 h with vehicle (Con), cytomix (CM), cytomix and PDTC (100 μM, 2 h pre-treatment), cytomix and actinomycin D (5 μg ml−1, added concurrently), or cytomix and dexamethasone (5 μM, 2 h pre-treatment).
The role of NF-κB activation in the induction of iNOS was assessed by using two different putative NF-κB inhibitors, pyrrolidine dithiocarbamate (PDTC; 10–200 μM), and 3,4 dichloroisocoumarin (DCI; 0.1–100 μM). In cells used 10 days after confluence, the two inhibitors dose-dependently inhibited cytomix-induced NOx production (Figure 6). Thus, PDTC (200 μM) and DCI (100 μM) reduced cytomix-induced NOx production by 70±9% and 86±2%, respectively. PDTC (200 μM), but not DCI, also decreased the NOx production observed in control cells by 58.3±6% to reach 7.4±2.3 μM 106 cells−1 (P<0.05, compared with untreated cells).
Figure 6.
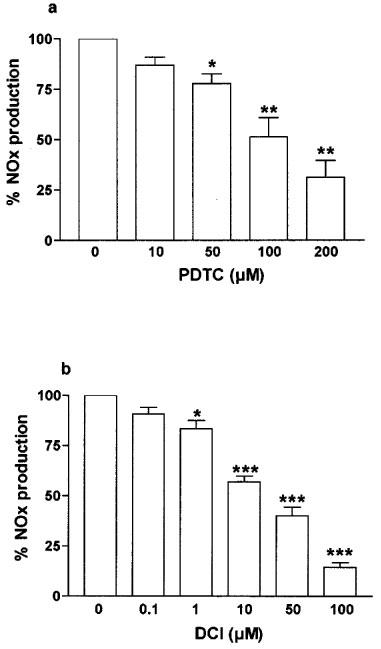
Dose dependent inhibition of cytomix-induced NOx production by NF-κB inhibitors in Caco-2 cells. Caco-2 cells (passages 32 to 39) were used 10 days after confluence. They were treated in serum free medium for 24 h with cytomix alone or with increasing concentrations of pyrrolidine dithiocarbamate (PTDC) (a) and 3,4 dichloroisocoumarin (DCI) (b). NOx level was determined in the supernatant by nitrate reduction and the Griess reaction. Results are expressed as percentage of maximal induction (cytomix alone) and represent means (±s.e.mean) from at least three different experiments, each done in triplicate. *P<0.05, **P<0.01, ***P<0.001 compared with value obtained with no inhibitor.
PDTC (200 μM) and DCI (100 μM) also decreased cytomix-induced iNOS protein expression, showing 40 to 75% (range from three experiments) reduction in the intensity of the signal with PDTC (200 μM) as shown in Figure 4a,b. Likewise, the steady-state level of iNOS mRNA at 12 h was strongly decreased after PDTC treatment (15% of the cytomix-induced iNOS RNA level) as shown in Figure 5b.
PDTC and DCI had similar effectiveness in reducing NOx production at day 15 after confluence. Indeed, at this time, PDTC (200 μM) and DCI (100 μM) decreased cytomix-induced NOx production by 77±3% and 91±1%, respectively. PDTC and DCI also reduced iNOS protein expression at day 15 after confluence (data not shown).
Effects of the tyrphostins A25 and B42 on iNOS induction
The tyrosine kinase inhibitor, tyrphostin A25 (10–200 μM) and the specific JAK-2 inhibitor, tyrphostin B42 (10–200 μM) had no significant effect on NOx production in unstimulated control cells. In Caco-2 cells used 10 days after confluence, the tyrphostins A25 and B42 inhibited the NOx production caused by cytomix in a concentration-dependent manner with IC50 values of 98±35 μM and 125±29 μM with A25 and B42, respectively (Figure 7). The tyrphostins A25 (200 μM) and B42 (200 μM) also substantially reduced the iNOS protein expression induced by cytomix as shown by Western blot (Figure 4d).
Figure 7.
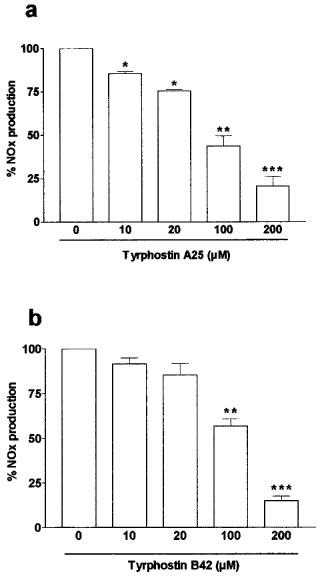
Inhibition of cytomix-induced NOx production by the tyrosine kinase inhibitor, tyrphostin A25 (a) and the JAK-2 inhibitor, tyrphostin B42 (b) in Caco-2 cells. Caco-2 cells (passages 23 to 39) used 10 days after confluence were treated in serum free medium for 24 h with cytomix and increasing concentrations of A25 (0–200 μM, added concurrently) (a) or B42 (0–200 μM, added concurrently) (b). NOx level was determined in the supernatant by nitrate reduction and the Griess reaction. Results are expressed as percentage of maximal induction (without tyrphostin) and represent means (s.e.mean) from at least three different experiments, each done in triplicate. *P<0.05, **P<0.01, ***P<0.001 compared with value obtained with no inhibitor.
The tyrphostins A25 and B42 had a similar inhibitory effect on cytomix-induced iNOS activity in Caco-2 cells studied 15 days after confluence with IC50 values of 78±25 μM and 134±14 μM with A25 and B42, respectively (full data not shown).
Effects of dexamethasone on cytokine-induced iNOS expression and activity
Dexamethasone (0.01–10 μM) did not inhibit cytomix-induced NOx production in Caco-2 cells used 5 and 10 days after confluence. In contrast, dexamethasone (0.01–10 μM) significantly decreased the cytomix-induced NOx production in cells used 15 and 20 days after confluence (Figure 8). Dexamethasone (1 μM) led to 40±3% inhibition (compared with untreated stimulated cells) at day 15 after confluence (P<0.01) and 29±9% inhibition at day 20 after confluence (P<0.01). Similarly, dexamethasone at a lower concentration (0.1 μM) led to 33.2±3.1% inhibition (compared with untreated stimulated cells) at day 15 after confluence (P<0.01) and 25±6.8% inhibition at day 20 after confluence (P<0.01).
Figure 8.
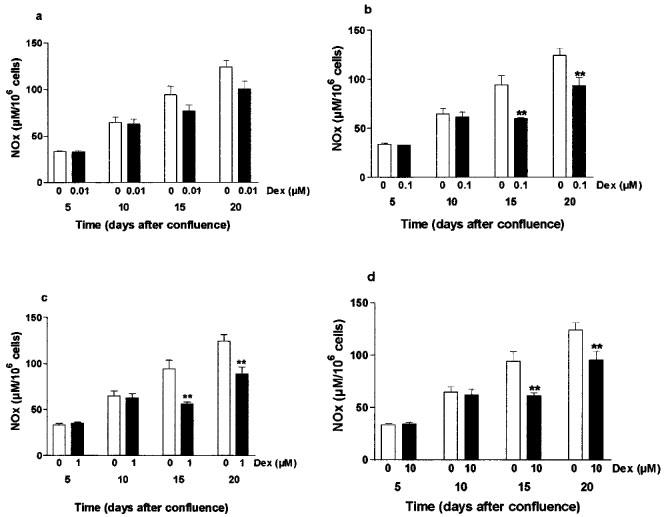
Actions of dexamethasone (0.01–10 μM) on cytomix-induced NOx production in Caco-2 cells increased with days in culture. Caco-2 cells (passage 32 to 39) were used between 5 and 20 days after confluence as indicated. NOx levels were determined by nitrate reduction followed by Griess reaction in the supernatant of the cells exposed for 24 h to cytomix (open bars) or cytomix and dexamethasone (0.01–10 μM, 2 h pre-treatment) (solid bars). Results are expressed as means (±s.e.mean) from at least three different experiments, each done in triplicate. **P<0.01, ***P<0.001 compared with value in the cells treated by cytomix alone.
Northern blot analysis showed that the cytomix-induced iNOS mRNA steady-state level was substantially reduced by dexamethasone (5 μM) in Caco-2 cells used 10 days after confluence (Figure 5b). Western blot analyses indicated that dexamethasone (5 μM) also decreased the expression of the iNOS protein at day 10 after confluence by 52±9% (Figure 4c). In addition, the cytomix-induced iNOS protein expression was inhibited at day 15 after confluence by 61±12% as determined by Western blot (Figure 4c).
In a comparative study on the nature of the concentration-response relationship using murine cells, dexamethasone inhibited iNOS activity in the intestinal epithelial cells, IEC-6. In this cell line, a combination of IFNγ (200 U ml−1) and IL-1β (5 ng ml−1) significantly induced NOx production from 3.68±0.7 μM in resting cells to 14.8±2.3 μM in cells treated with these cytokines for 24 h. Dexamethasone (0.1 μM) significantly inhibited this cytokine-induced NOS activity to 5.9±1.2 μM (P<0.01), corresponding to 60±8% inhibition. A similar inhibition was observed at dexamethasone concentrations of 1 and 10 μM with NOx levels being reduced to 5.36±1 μM and 5.16±1.2 μM, respectively (n=3; P<0.01).
Discussion
Many intestinal epithelial cell lines previously used to study iNOS expression are poorly differentiated under standard growing conditions. In contrast, Caco-2 cells undergo a typical enterocytic differentiation, occurring at confluence and being complete within 20 days (Zweibaum et al., 1991). Therefore, they are considered a useful model of normal intestinal or foetal colonic epithelial cells and could furthermore be regarded as a relevant model of the differentiation process occurring in vivo along the crypt-villus axis. This cell line is known to express more differentiation features upon successive passages (Zweibaum et al., 1991; Briske-Anderson et al., 1997). Moreover, Caco-2 cells normally process the NF-κB complex, involved in iNOS transcription, whereas other human intestinal epithelial cell lines such as HT-29, SW-480 and T84 incompletely degrade IκB (Jobin et al., 1997). Indeed, the degradation of IκB, which is provoked by its phosphorylation, is a key step permitting the cytoplasmic factor NF-κB to translocate into the nucleus and to bind relevant DNA recognition sites (for review, see Bauerle, 1998). In the present study, Caco-2 cells produced increasing levels of sucrase-isomaltase and alkaline phosphatase over 20 days, similar to those recently published (Briske-Anderson et al., 1997), confirming their time-dependent degree of differentiation.
In the current work, we have characterized iNOS in Caco-2 cells as shown by its calcium-independence and its inhibition by the highly selective iNOS inhibitor, 1400 W. Moreover, iNOS activity was up-regulated during Caco-2 cell differentiation. Thus, the elevation in iNOS activity in these cells increased with days in culture over the 20 days period and passage number. In contrast to these current findings, it has been previously reported that iNOS (RNA, protein and activity) was decreased with differentiation of Caco-2 cells (Vecchini et al., 1997). However, that study was performed without any stimulation and may reflect a down-regulation of ‘constitutive' expression of iNOS. Indeed, our results also show a low level of iNOS mRNA and protein, as well as NOx production that could be inhibited, at least partially by 1400 W, in the resting differentiated Caco-2 cells, suggesting a basal expression of iNOS-like activity in this cell line under these conditions. However, this activity did not change over the period of differentiation in the current work.
As shown by Northern blot analyses and the effects of actinomycin D on iNOS activity, protein and mRNA, the present studies indicate that iNOS is regulated mainly at the transcriptional level in Caco-2 cells. These findings are in agreement with previous results obtained in other human intestinal epithelial cell lines, in which iNOS induction has been demonstrated (Kolios et al., 1995; Sherman et al., 1993; Salzman et al., 1996; Linn et al., 1997). DLD-1, a heterogeneous and multiclonal intestinal epithelial cell line (Dexter et al., 1981), is a well-studied cell line as a result of its ability to express iNOS and high levels of NO under cytokine stimulation. In that cell line, cytokine-induced iNOS expression is regulated at the transcriptional level and reported to involve the transcriptional factor NF-κB (Nunokawa et al., 1996; Salzman et al., 1996; Linn et al., 1997).
In the present study, two putative NF-κB inhibitors, PDTC and DCI, with distinct mechanisms of action, decreased cytokine-induced iNOS activity. This reduction in iNOS activity was similar at day 10 and 15 after confluence. Likewise, these agents reduced iNOS protein expression. Moreover, PDTC substantially decreased iNOS mRNA level after cytokine induction. High concentrations of PDTC, but not DCI, also reduced the iNOS-like activity in resting Caco-2 cells but the reason for this difference is not clear and could warrant further investigation. PDTC, a metal chelator and an anti-oxidant, is thought to inhibit the release of the IκB unit, leaving the DNA-binding activity of other transcription factors unaffected (Schrek et al., 1992). PDTC may also inhibit the AP-1 transcription factor, which is thought to participate in iNOS gene transcription (Müller et al., 1997; Kleinert et al., 1998b). DCI, an anti-oxidant and a potent serine protease inhibitor, stabilizes IκB, but could also inhibit iNOS gene expression by preventing IRF-1 activation (Hecker et al., 1996). However, the similar effect of the two structurally and mechanistically dissimilar inhibitors argues for NF-κB involvement on iNOS expression in Caco-2 cells after cytokine stimulation at both day 10 and 15 after confluence. These findings thus contrast with a recent report that suggests that NF-κB is not involved in iNOS transcription in the undifferentiated DLD-1 cells (Kleinert et al., 1998b).
The IFNγ-activated kinase JAK-2 is known to tyrosine-phosphorylate STAT1α, which is subsequently translocated into the nucleus to bind specific DNA sites (Weber-Nordt et al., 1998). It has been recently proposed that the JAK-STAT pathway could play an important role in iNOS induction in DLD-1 cells (Kleinert et al., 1998b). Our findings in Caco-2 cells likewise demonstrate that the cytokine-stimulated iNOS activity and the iNOS protein expression were potently inhibited by the tyrosine kinase inhibitor, A25 and also by B42, known to be a specific JAK-2 inhibitor (Meydan et al., 1996). These agents had no action on the resting iNOS-like activity in unstimulated cells. As with the putative NF-κB inhibitors PDTC and DCI, both A25 and B42 had comparable activity on NOx production at day 10 and 15 after confluence. Thus, these present observations suggest that in this cell line, both NF-κB and JAK-2 kinase pathways may be involved in cytokine-stimulated iNOS expression at these stages of differentiation.
In this current study, dexamethasone did not decrease the NO production in Caco-2 cells used 5 or 10 days after confluence. Such findings agree with studies using DLD-1 cells in which dexamethasone at 100 μM did not reduce iNOS activity, although a 22% reduction in iNOS RNA was noted (Salzman et al., 1996). In contrast, in the present investigation, dexamethasone did inhibit NO production when incubated for 24 h with the Caco-2 cells, studied at day 15 and 20 after confluence. The inhibitory effect of dexamethasone on iNOS activity, although moderate, exhibited a flat concentration-response relationship, and significant inhibition was achieved with a concentration of 0.1 μM. This concentration of dexamethasone is comparable or lower to that causing iNOS inhibition in most other cell systems such as hepatocytes or fibroblasts (Geller et al., 1993; Kleinert et al., 1996a). In a comparative study on murine cells, dexamethasone inhibited cytokine-induced iNOS activity in the intestinal epithelial cells, IEC-6, which resemble crypt intestinal cells (Quaroni et al., 1979). The dose-relationship and potency of the inhibitory actions of dexamethasone on NOx production was similar to that observed in Caco-2 cells. The inhibitory effect of dexamethasone on iNOS expression at day 15 and 20 after confluence in the human cell line thus suggests a possible relationship with enterocytic-like differentiation occurring during cell growth.
Our results on iNOS add to the previously reported effectiveness of glucocorticoids in differentiated Caco-2 cells in modulating other genes or pathways such as those for monocyte-chemoattractant protein 1 (MCP-1) or leukotriene B4 synthesis (Dias et al., 1994; Reinecker et al., 1995). Such findings indicate that the glucocorticoid receptor and transduction pathways involving this receptor can function in these cells, including under cytokine stimulation (Reinecker et al., 1995; O'Flaherty et al., 1997).
No glucocorticoid responsive element has been described in human iNOS gene, but glucocorticoids can inhibit iNOS through multiple mechanisms in a number of cell systems. At the transcriptional level, they can reduce the activation of NF-κB (Kunz et al., 1996) and induce the expression of the IκB protein (Saura et al., 1998). Activation of the glucocorticoid receptor can also counteract the action of transcription factors, such as AP-1 and NF-κB (Pfahl, 1993; Kleinert et al., 1996b). Our results with PDTC and DCI on NO production from cytokine-induced iNOS, suggest that the NF-κB pathway is fully functional from day 10 to day 15 after confluence in Caco-2 cells. Therefore, the lack of inhibitory effect of dexamethasone on iNOS activity at day 10 is unlikely to be due to an impairment or an immaturity of the NF-κB pathway, but could possibly reflect some defect of the glucocorticoid inhibitory process at this time.
In contrast to NO production, however, iNOS protein expression determined by Western blot, was decreased by dexamethasone incubation both at day 10 and day 15. This unexpected finding suggests that dexamethasone can act at different levels to bring about inhibition of iNOS and that the extent of reduction of iNOS protein levels seen at day 10 is insufficient to substantially attenuate NO production in these human intestinal cells. It is feasible that post-translational actions of dexamethasone could modulate iNOS activity and such events might be more important in the control of iNOS activity in these cells than previously thought. Indeed, glucocorticoids are known to increase iNOS protein degradation in rat mesangial cells (Kunz et al., 1996). Moreover, NO production can be modulated not only by altering the expression of the enzyme but also by changing the enzymatic activity through direct modification, through affecting its cofactors or its substrate. Glucocorticoids have thus been demonstrated to limit the availability of important iNOS co-factors, such as tetrahydrobiopterin and L-arginine, the formation of which are increased under cytokine exposure (Nüssler et al., 1996; Simmons et al., 1996). The effects of glucocorticoids could also involve interactions of other genes or proteins with the iNOS system, such as COX-2 (for review, see Wu, 1995) and lipocortin 1 (Bryant et al., 1998).
The current findings in Caco-2 cells indicate that the induction of iNOS activity in this human intestinal epithelial cell line and its inhibition by dexamethasone is closely related to the cell differentiation status.
Acknowledgments
The authors are indebted to Ms Elizabeth Wood for maintaining the cultures of the cells. They would like to acknowledge Dr Linda Gibbs for her help in performing Northern blot and Dr Richard Knowles from GlaxoWellcome for providing 1400 W. M. Cavicchi is a recipient of a grant from Institut de Recherche pour les Maladies de l'Appareil Digestif, France.
Abbreviations
- DCI
3,4 dichloroisocoumarin
- IFNγ
interferon γ
- IL-1β
interleukin-1β
- iNOS
inducible nitric oxide synthase
- JAK-2
Janus kinase-2
- NF-κB
nuclear factor κB
- NO
nitric oxide
- PBS
phosphate buffered saline
- PDTC
pyrrolidine dithiocarbamate
- SDS
sodium dodecyl sulphate
- TNFα
tumour necrosis factor α
References
- AMBS S., MERRIAM W.G., BENNETT W.P., FELLEY-BOSCO E., OGUNFUSIKA M.O., OSER S.M., KLEIN S., SHIELDS P.G., BILLIAR T.R., HARRIS C.C. Frequent nitric oxide synthase-2 expression in human colon adenomas: Implication for tumour angiogenesis and colon cancer progression. Cancer Res. 1998;58:334–341. [PubMed] [Google Scholar]
- BAEUERLE P.A. Pro-inflammatory signaling: Last pieces in the NF-kappaB puzzle. Curr. Biol. 1998;8:R19–R22. doi: 10.1016/s0960-9822(98)70010-7. [DOI] [PubMed] [Google Scholar]
- BOUGHTON-SMITH N.K., EVANS S.M., HAWKEY C.J., COLE A.T., BALSITIS M., WHITTLE B.J.R., MONCADA S. Nitric oxide synthase activity in ulcerative colitis and Crohn's disease. Lancet. 1993;342:338–340. doi: 10.1016/0140-6736(93)91476-3. [DOI] [PubMed] [Google Scholar]
- BRISKE-ANDERSON M.J., FINLEY J.W., NEWMAN S.M. The influence of cultured time and passage number on the morphological and physiological development of Caco-2 cells. Proc. Soc. Exp. Biol. Med. 1997;214:248–257. doi: 10.3181/00379727-214-44093. [DOI] [PubMed] [Google Scholar]
- BRYANT C.E., PERRETTI M., FLOWER R.J. Suppression by dexamethasone of inducible nitric oxide synthase protein expression in vivo: A possible role for lipocortin 1. Biochem. Pharmacol. 1998;55:279–285. doi: 10.1016/s0006-2952(97)00462-0. [DOI] [PubMed] [Google Scholar]
- DEXTER D.L., SPREMULLI E.N., FLIGIEL Z., BARBOSA J.A., VOGEL R., VAN VOORHEEES A., CALABRESI P. Heterogeneity of cancer cells from a single human colon carcinoma. Am. J. Med. 1981;71:949–956. doi: 10.1016/0002-9343(81)90312-0. [DOI] [PubMed] [Google Scholar]
- DIAS V.C., SHAFFER E.A., WALLACE J.L., PARSONS H.G. Bile salts determine leukotriene B4 synthesis in a human intestinal cell line (CaCo-2) Dig. Dis. Sci. 1994;39:802–808. doi: 10.1007/BF02087427. [DOI] [PubMed] [Google Scholar]
- FÖRSTERMANN U., GATH I., SCHWARZ P., CLOSS E.I., KLEINERT H. Isoforms of nitric oxide synthase. Properties, cellular distribution and expressional control. Biochem. Pharmacol. 1995;50:1321–1332. doi: 10.1016/0006-2952(95)00181-6. [DOI] [PubMed] [Google Scholar]
- GELLER D.A., NUSSLER A.K., DI SILVIO M., LOWENSTEIN C.J., SHAPIRO R.A., WANG S.C., SIMMONS R.L., BILLIAR T.R. Cytokines, endotoxin, and glucocorticoids regulate the expression of inducible nitric oxide synthase in hepatocytes. Proc. Natl. Acad. Sci. 1993;90:522–526. doi: 10.1073/pnas.90.2.522. [DOI] [PMC free article] [PubMed] [Google Scholar]
- HANAUER S.B. Inflammatory bowel disease. N. Engl. J. Med. 1996;334:841–848. doi: 10.1056/NEJM199603283341307. [DOI] [PubMed] [Google Scholar]
- HECKER M., PREISS C., KLEMM P., BUSSE R. Inhibition by antioxidants of nitric oxide synthase expression in murine macrophages: Role of nuclear factor κB and interferon regulatory factor 1. Br. J. Pharmacol. 1996;118:2178–2184. doi: 10.1111/j.1476-5381.1996.tb15660.x. [DOI] [PMC free article] [PubMed] [Google Scholar]
- JENKINS D.C., CHARLES I.G., BAYLIS S.A., LELCHUK R., RADOMSKI M.W., MONCADA S. Human colon cancer cell lines show a diverse pattern of nitric oxide synthase gene expression and nitric oxide generation. Br. J. Cancer. 1994;70:847–849. doi: 10.1038/bjc.1994.409. [DOI] [PMC free article] [PubMed] [Google Scholar]
- JENKINS D.C., CHARLES I.G., THOMSEN L.L., MOSS D.W., HOLMES L.S., BAYLIS S.A., RHODES P., WESTMORE K., EMSON P.C., MONCADA S. Roles of nitric oxide in tumour growth. Proc. Natl. Acad. Sci. 1995;92:4392–4396. doi: 10.1073/pnas.92.10.4392. [DOI] [PMC free article] [PubMed] [Google Scholar]
- JOBIN C., HASKILL S., MAYER L., PANJA A., SARTOR R.B. Evidence for altered regulation of IκBα degradation in human colonic cells. J. Immunol. 1997;158:226–234. [PubMed] [Google Scholar]
- KLEINERT H., EUCHENHOFER C., FRITZ G., IHRIG-BIEDERT I., FÖRSTERMANN U. Involvement of protein kinases in the induction of NO synthase II in human DLD-1 cells. Br. J. Pharmacol. 1998a;123:1716–1722. doi: 10.1038/sj.bjp.0701782. [DOI] [PMC free article] [PubMed] [Google Scholar]
- KLEINERT H., EUCHENHOFER C., IHRIG-BIEDERT I., FÖRSTERMANN U. In murine 3T3 fibroblasts, different second messenger pathways resulting in the induction of NO synthase II (iNOS) converge in the activation of transcription factor NF-κB. J. Biol. Chem. 1996a;271:6039–6044. doi: 10.1074/jbc.271.11.6039. [DOI] [PubMed] [Google Scholar]
- KLEINERT H., EUCHENHOFER C., IHRIG-BIEDERT I., FÖRSTERMANN U. Glucocorticoids inhibit the induction of nitric oxide synthase II by down-regulating cytokine-induced activity of transcription factor nuclear factor-κB. Mol. Pharmacol. 1996b;49:15–21. [PubMed] [Google Scholar]
- KLEINERT H., WALLERATH T., FRITZ G., IHRIG-BIEDERT I., RODRIGUEZ-PASCUAL F., GELLER D.A., FÖRSTERMANN U. Cytokine induction of NO synthase II in human DLD-1 cells: roles of the JAK-STAT, AP-1 and NF-kappaB-signaling pathways. Br. J. Pharmacol. 1998b;125:193–201. doi: 10.1038/sj.bjp.0702039. [DOI] [PMC free article] [PubMed] [Google Scholar]
- KNOWLES R.G., MONCADA S. Nitric oxide synthases in mammals. Biochem. J. 1994;298:249–258. doi: 10.1042/bj2980249. [DOI] [PMC free article] [PubMed] [Google Scholar]
- KOLIOS G., BROWN Z., ROBSON R.L., ROBERTSON D.A.F., WESTWICK J. Inducible nitric oxide synthase activity and expression in a human colonic epithelial cell line, HT-29. Br. J. Pharmacol. 1995;116:2866–2872. doi: 10.1111/j.1476-5381.1995.tb15938.x. [DOI] [PMC free article] [PubMed] [Google Scholar]
- KUNZ D., WALKER G., EBERHARDT W., PFEILSCHIFTER J. Molecular mechanisms of dexamethasone inhibition of nitric oxide synthase expression in interleukin 1β-stimulated mesangial cells: Evidence for the involvement of transcriptional and posttranscriptional regulation. Proc. Natl. Acad. Sci. 1996;93:255–259. doi: 10.1073/pnas.93.1.255. [DOI] [PMC free article] [PubMed] [Google Scholar]
- LINN S.C., MORELLI P.J., EDRY I., COTTONGIM S.E.M., SZABÓ C., SALZMAN A.L. Transcriptional regulation of human inducible nitric oxide synthase gene in an intestinal epithelial cell line. Am. J. Physiol. 1997;35:G1499–G1508. doi: 10.1152/ajpgi.1997.272.6.G1499. [DOI] [PubMed] [Google Scholar]
- MCLAUGHLAN J.M., SETH R., VAUTIER G., ROBINS R.A., SCOTT B.B., HAWKEY C.J., JENKINS D. Interleukin-8 and inducible nitric oxide synthase mRNA levels in inflammatory bowel disease at first presentation. J. Pathol. 1997;181:87–92. doi: 10.1002/(SICI)1096-9896(199701)181:1<87::AID-PATH736>3.0.CO;2-J. [DOI] [PubMed] [Google Scholar]
- MEYDAN N., GRUNBERGER T., DADI H., SHAHAR M., ARPAIA E., LAPIDOT Z., LEEDER J.S., FREEDMAN M., COHEN A., GAZIT A., LEVITZKI A., ROIFMAN C.M. Inhibition of acute lymphoblastic leukaemia by a Jak-2 inhibitor. Nature. 1996;379:645–648. doi: 10.1038/379645a0. [DOI] [PubMed] [Google Scholar]
- MONCADA S., HIGGS A. The L-arginine-nitric oxide pathway. N. Engl. J. Med. 1993;329:2002–2012. doi: 10.1056/NEJM199312303292706. [DOI] [PubMed] [Google Scholar]
- MORIN M.J., UNNO N., HODIN R.A., FINK M.P. Differential expression of inducible nitric oxide synthase messenger RNA along the longitudinal and crypt-villus axes of the intestine in endotoxemic rats. Crit. Care Med. 1998;26:1258–1264. doi: 10.1097/00003246-199807000-00031. [DOI] [PubMed] [Google Scholar]
- MULLER J.M., RUPEC R.A., BAEUERLE P.A. Study of gene regulation by NF-kappa B and AP-1 in response to reactive oxygen intermediates. Methods. 1997;11:301–312. doi: 10.1006/meth.1996.0424. [DOI] [PubMed] [Google Scholar]
- NUNOKAWA Y., OIKAWA S., TANAKA S. Human inducible nitric oxide synthase gene is transcriptionally regulated by nuclear factor-κB dependent mechanism. Biochem. Biophys. Res. Commun. 1996;223:347–352. doi: 10.1006/bbrc.1996.0897. [DOI] [PubMed] [Google Scholar]
- NUSSLER A.K., LIU Z.Z., HATAKEYAMA K., GELLER D.A., BILLIAR T.R., MORRIS S.M., JR A cohort of supporting metabolic enzymes is coinduced with nitric oxide synthase in human tumour cell lines. Cancer Lett. 1996;103:79–84. doi: 10.1016/0304-3835(96)04199-7. [DOI] [PubMed] [Google Scholar]
- O'FLAHERTY L., STAPLETON P.P., REDMOND H.P., BOUCHIER-HAYES D. Dexamethasone and lipopolysaccharide regulation of taurine transport in Caco-2 cells. J. Surg. Res. 1997;69:331–336. doi: 10.1006/jsre.1997.5067. [DOI] [PubMed] [Google Scholar]
- PFAHL M. Nuclear receptor/AP-1 interaction. Endoc. Rev. 1993;14:651–658. doi: 10.1210/edrv-14-5-651. [DOI] [PubMed] [Google Scholar]
- QUARONI A., WANDS J., TRELSTAD T.L., ISSELBACHER K.J. Epithelial cell cultures from rat small intestine. J. Cell. Biol. 1979;80:245–265. doi: 10.1083/jcb.80.2.248. [DOI] [PMC free article] [PubMed] [Google Scholar]
- RACHMILEWITZ D., STAMLER J.S., BACHWICH D., KARMELI F., ACKERMAN Z., PODOLSKY D.K. Enhanced colonic nitric oxide generation and nitric oxide synthase activity in ulcerative colitis and Crohn's disease. Gut. 1995;36:718–723. doi: 10.1136/gut.36.5.718. [DOI] [PMC free article] [PubMed] [Google Scholar]
- RADOMSKI M.W., JENKINS D.C., HOLMES L., MONCADA S. Human colorectal adenocarcinoma cells: Differential nitric oxide synthesis determines their ability to aggregate platelets. Cancer Res. 1991;51:6073–6078. [PubMed] [Google Scholar]
- REINECKER H.C., LOH E.Y., RINGLER D.J., MEHTA A., ROMBEAU J.L., MACDERMOTT R.P. Monocyte-chemoattractant protein 1 gene expression in intestinal epithelial cells and inflammatory bowel disease mucosa. Gastroenterology. 1995;108:40–50. doi: 10.1016/0016-5085(95)90006-3. [DOI] [PubMed] [Google Scholar]
- SALZMAN A.L., DENENBERG A.G., UETA I., O'CONNOR M., LINN S.C., SZABÓ C. Induction and activity of nitric oxide synthase in cultured human intestinal epithelial monolayers. Am. J. Physiol. 1996;270:G565–G573. doi: 10.1152/ajpgi.1996.270.4.G565. [DOI] [PubMed] [Google Scholar]
- SALZMAN A.L., EAVES-PYLES T., LINN S.C., DENENBERG A.G., SZABÓ C. Bacterial induction of inducible nitric oxide synthase in cultured human intestinal epithelial cells. Gastroenterology. 1998;114:93–102. doi: 10.1016/s0016-5085(98)70637-7. [DOI] [PubMed] [Google Scholar]
- SAURA M., ZARAGOZA C., DIAZ-CAZORLA M., HERNANDEZ-PERERA O., ENG E., LOWENSTEIN C.J., PEREZ-SALA D., LAMAS S. Involvement of transcriptional mechanisms in the inhibition of NOS2 expression by dexamethasone in rat mesangial cells. Kidney Int. 1998;53:38–49. doi: 10.1046/j.1523-1755.1998.00725.x. [DOI] [PubMed] [Google Scholar]
- SCHRECK R., MEIER B., MÄNNEL D.N., DRÖGE W., BAEUERLE P.A. Dithiocarbamates as potent inhibitors of nuclear factor κB activation in intact cells. J. Exp. Med. 1992;175:1181–1194. doi: 10.1084/jem.175.5.1181. [DOI] [PMC free article] [PubMed] [Google Scholar]
- SHERMAN P.A., LAUBACH V.E., REEP B.R., WOOD E.R. Purification and cDNA sequence of an inducible nitric oxide synthase from a human tumour cell line. Biochemistry. 1993;32:11600–11605. doi: 10.1021/bi00094a017. [DOI] [PubMed] [Google Scholar]
- SIMMONS W.W., UNGUREANU-LONGROIS D., SMITH G.K., SMITH T.W., KELLY R.A. Glucocorticoids regulate inducible nitric oxide synthase by inhibiting tetrahydrobiopterin synthesis and L-arginine transport. J. Biol. Chem. 1996;271:23928–23937. doi: 10.1074/jbc.271.39.23928. [DOI] [PubMed] [Google Scholar]
- SINGER I.I., KAWKA D.W., SCOTT S., WEIDNER J.R., MUMFORD R.A., RIEHL T.E., STENSON W.F. Expression of inducible nitric oxide synthase and nitrotyrosine in colonic epithelium in inflammatory bowel disease. Gastroenterology. 1996;111:871–885. doi: 10.1016/s0016-5085(96)70055-0. [DOI] [PubMed] [Google Scholar]
- TEPPERMAN B.L., BROWN J.F., KOROLKIEWICZ R., WHITTLE B.J.R. Nitric oxide synthase activity, viability and cyclic GMP levels in rat colonic epithelial cells: Effect of endotoxin challenge. J. Pharmacol. Exp. Ther. 1994;271:1477–1482. [PubMed] [Google Scholar]
- TEPPERMAN B.L., BROWN J.F., WHITTLE B.J.R. Nitric oxide synthase induction and intestinal cell viability in rats. Am. J. Physiol. 1993;265:G214–G218. doi: 10.1152/ajpgi.1993.265.2.G214. [DOI] [PubMed] [Google Scholar]
- UNNO N., MENCONI M.J., SMITH M., FINK M.P. Nitric oxide mediated interferon-γ-induced hyperpermeability in cultured human intestinal epithelial monolayers. Crit. Care Med. 1995;23:1170–1176. doi: 10.1097/00003246-199507000-00004. [DOI] [PubMed] [Google Scholar]
- VECCHINI F., PRINGAULT E., BILLIAR T.R., GELLER D.A., HAUSEL P., FELLEY-BOSCO E. Decreased activity of inducible nitric oxide synthase type 2 and modulation of the expression of glutathione S-transferase, bcl-2, and methallothioneins during the differentiation of CaCo-2 cells. Cell Growth Differ. 1997;8:261–268. [PubMed] [Google Scholar]
- WEBER-NORDT R.M., MERTELSMANN R., FINKE J. The JAK-STAT pathway: signal transduction involved in proliferation, differentiation and transformation. Leuk. Lymphoma. 1998;28:459–467. doi: 10.3109/10428199809058353. [DOI] [PubMed] [Google Scholar]
- WHITTLE B.J.R. Nitric oxide a mediator of inflammation or mucosal defence. Eur. J. Gastroenterol. Hepatol. 1997;9:1026–1032. doi: 10.1097/00042737-199711000-00002. [DOI] [PubMed] [Google Scholar]
- WU K.K. Inducible cyclooxygenase and nitric oxide synthase. Adv. Pharmacol. 1995;33:179–207. doi: 10.1016/s1054-3589(08)60669-9. [DOI] [PubMed] [Google Scholar]
- ZWEIBAUM A., LABURTHE M., GRASSET E., LOUVARD D.Use of cultured cell lines in studies of intestinal cell differentiation and function The gastrointestinal system, IV. Am. Physiol Soc. 1991Bethesda, MD; 223–255.In Field, M. & Frizzell, R.A. (ed) [Google Scholar]


