

Abstract
This study was done to find out how morphine 6-beta-D-glucuronide (M6G) induces more potent central analgesia than morphine, despite its poor blood–brain barrier (BBB) permeability. The brain uptake and disposition of these compounds were investigated in plasma and in various brain compartments: extracellular fluid (ECF), intracellular space (ICS) and cerebrospinal fluid (CSF).
Morphine or M6G was given to rats at 10 mg kg−1 s.c. Transcortical microdialysis was used to assess their distributions in the brain ECF. Conventional tissue homogenization was used to determine the distribution in the cortex and whole brain. These two procedures were combined to estimate drug distribution in the brain ICS. The blood and CSF pharmacokinetics were also determined.
Plasma concentration data for M6G were much higher than those of morphine, with Cmax and AUC 4–5 times more higher, Tmax shorter, and VZf−1 (volume of distribution) and CL f−1 (clearance) 4–6 times lower. The concentrations of the compounds in various brain compartments also differed: AUC values for M6G were lower than those of morphine in tissue and CSF and higher in brain ECF. AUC values in brain show that morphine levels were four times higher in ICS than in ECF, whereas M6G levels were 125 higher in ECF than in ICS.
Morphine entered brain cells, whereas M6G was almost exclusively extracellular. This high extracellular concentration, coupled with extremely slow diffusion into the CSF, indicates that M6G was predominantly trapped in the extracellular fluid and therefore durably available to bind at opioid receptors.
Keywords: Morphine, morphine 6-glucuronide (M6G), transcortical microdialysis, extracellular fluid (ECF), intracellular space (ICS), cerebrospinal fluid (CSF), uptake and disposition
Introduction
Morphine 3-glucuronide (M3G), the main metabolite of morphine, has no analgesic activity (Shimomura et al., 1971; Gong et al., 1991), whereas the other major metabolite, morphine 6-beta-D-glucuronide (M6G), has more potent analgesic effects than morphine. Studies in mice have shown that the antinociceptive potency of M6G, measured after thermal stimulation, is double that of morphine by subcutaneous route (Paul et al., 1989), 45 times greater by intravenous route (Shimomura et al., 1971) and 680 times greater by intrathecal route (Paul et al., 1989). These differences in analgesic properties have also been observed in the rat, where M6G is 200 times more active than morphine following direct administration into the cerebral ventricles (Gong et al., 1991). This analgesic effect has also been demonstrated in humans after an intravenous administration of M6G (Osborne et al., 1992). The concentration of M6G in the plasma is higher than that of morphine after given morphine to humans (Osborne et al., 1990; Hasselstrom et al., 1996), which suggests that M6G may contribute to the analgesic effect of morphine. Wu et al. (1997) demonstrated that the analgesic action of M6G is mediated entirely by CNS opioid receptors. The affinity with which M6G binds to the μ opioid receptors, which are important in mediating analgesia (Matthes et al., 1996), is 3–4 times lower than that of morphine in vitro (Christensen & Jorgensen, 1987; Paul et al., 1989) and five times lower in vivo (Frances et al., 1992). Systemic injection of M6G leads to its detection in brain homogenates (Yoshimura et al., 1973; Murphey & Olsen, 1994), and it has been quantified in rat brain dialysates (Aasmunstad et al., 1995; Stain et al., 1995), in rabbit (Mignat et al., 1995) and human cerebrospinal fluid (CSF) (Goucke et al., 1994; Wolff et al., 1995). Comparison of the permeability of the blood–brain barrier (BBB) towards M6G and morphine using the internal carotid artery perfusion technique in rats (Bickel et al., 1996) has demonstrated that the BBB permeability to M6G is 32 times lower than that of morphine. Using a single intravenous injection technique Wu et al. (1997) have demonstrated that the BBB permeability-surface area product for M6G is 57 times lower than that of morphine, and that the 1-octanol partition coefficient of M6G is 187 times lower than that of morphine. These data are consistent with reports by several groups showing that M6G penetrates less well than morphine into the brain (Bickel et al., 1996; Wu et al., 1997). However, microdialysis measurements of morphine and M6G in the brain extracellular fluid (ECF) have detected higher concentrations of M6G than of morphine (Aasmunstad et al., 1995; Stain et al., 1995).
The enigma of poor BBB permeability to M6G combined with the high concentrations of M6G found in the brain ECF have not yet been explained and have been contested (Bickel et al., 1996; Wu et al., 1997). The main reason why no relevant explanations have been forthcoming is that the processes characterizing morphine and M6G brain uptake and disposition have been studied separately. The present study was designed to investigate the passage of morphine and M6G across the BBB and the disposition of these two compounds in various compartments of the brain, such as the brain extracellular fluid (ECF), the brain intracellular space (ICS) and the CSF. As far as we know, this is the first attempt to study the different steps involved in the brain uptake and disposition of M6G and morphine. To investigate these kinetic events in the rat, we used the brain microdialysis technique, which provides quantitative kinetic information on the extracellular uptake and disposition of morphine and M6G within the brain, and the brain tissue homogenate technique to determine the uptake of the two compounds by the cortex and by the whole brain. The combination of these two procedures made it possible to estimate the intracellular distribution of the drugs within the brain. Blood and CSF concentrations of the compounds were measured to investigate their partition between the multiple compartments involved. The concentrations of morphine and M6G were determined by h.p.l.c. with fluorimetric detection.
Methods
Animals
Male Sprague-Dawley rats weighing 280–300 g (Iffa Credo, L'arbresle, France) were used. They had free access to standard laboratory chow and water and kept on a 12 h light-dark cycle at 22±1°C. The animals were housed under these conditions for at least 5 days before being used.
Drugs
Morphine was purchased from Lavoisier, France (1%, injectable solution). M6G was obtained from Francopia-Sanofi (Paris, France). The purity of M6G (C23H27NO9.2H2O, m.w. 497.5) was checked after receipt by h.p.l.c. with fluorimetric detection (see below for h.p.l.c. procedure). Purity was ⩾98.5%. The drug was stable for at least 24 h, at pH ranging from 3.0–8.0. M6G was dissolved in saline before being injected. The drugs were injected subcutaneously into the back of the neck in a volume of 1 ml kg−1 body weight. Both drugs were used at a dose of 10 mg kg−1 (26.6 μmol kg−1 for morphine and 20.1 μmol kg−1 for M6G). Chemicals were of h.p.l.c. grade and purchased from Sigma (St Quentin Fallavier, France) or Merck (Nogent sur Marne, France).
Study A: Brain tissue and plasma pharmacokinetics of morphine and M6G
At times 5, 10, 15, 30, 45, 60, 120 and 180 min after subcutaneous (s.c.) administration of 10 mg kg−1 of morphine or M6G, three animals were decapitated and blood was collected from the trunk. The blood was centrifuged at 3000×g for 5 min to collect plasma for the measurement of the concentrations of total and unbound morphine and M6G. The brain was removed and the cortex separated. The two brain parts of rats receiving morphine were weighed and homogenized with an Ultra-Turrax in 5 ml of a phosphate buffer at pH 7.4. The suspension was then centrifuged at 4800×g for 15 min and the supernatant was kept for morphine assay. For the rats given M6G, the procedure for the extraction of M6G was as described by Murphey & Olsen (1994): both parts of the brain were homogenized in 1 ml of 0.01 M NaH2PO4, pH 2.0 and centrifuged at 10,000×g for 20 min. The supernatant was then centrifuged at 13,000×g for 45 min and the resulting supernatant was neutralized to pH 7.0 with NaOH before being frozen until analysed. Morphine and M6G were assayed in plasma and brain supernatants by h.p.l.c. with fluorimetric detection. The apparent concentrations found reflected the content of both the parenchyma and the cerebral vasculature, and so all data were corrected from the vascular space (Vs), which was taken to be 31 μl g−1 (Everett et al., 1956). The morphine and M6G concentrations in the homogenate were expressed in terms of the cortex and of whole brain (cortex plus the rest of the brain).
Study B: Brain ECF and plasma pharmacokinetics of morphine and M6G
Microdialysis procedure
Rats were anaesthetized with chloral hydrate (300 mg kg−1, i.p.) and the femoral artery was cannulated with polyethylene tubing (PE50) for blood collection. The cannula was filled with heparin to prevent coagulation before the experiment. The animals were then placed in a stereotaxic frame (David Kopf Instruments, Roucaire, France) and the horizontal transcortical dialysis fibre was implanted as described by Barjavel et al. (1994). The microdialysis probe was an acrylonitrile-sodium methallyl sulphate membrane (AN69 HF Filtral 12; i.d. 240 μm; o.d. 290 μm; molecular weight cutoff 60,000 Da; Hospal Industrie S.A., Lyon, France). The dialysis membrane was coated with epoxy glue, except for an 8-mm dialysis tip corresponding to the length of the parietal cortex. Two holes were drilled on the sides of the skull at the following coordinates: A-P 0.3 mm posterior to bregma, V 2.0 mm from the skull surface according to the atlas of Paxinos & Watson (1986). The dialysis fibre, kept straight by an internal tungsten wire, was implanted transversely into the cerebral cortex. The tungsten wire was withdrawn and two stainless steel tubes (23G needle, 10 mm long) were glued to the end of the fibre to form the outlet. After surgery, the rats were allowed to recover overnight. They were supplied with food and water ad libitum.
In vivo recovery by loss (RL) of morphine and M6G from the dialysis fibre
The retrodialysis recoveries (RL) for morphine and M6G were determined 24 h after implanting the fibre by perfusing it with Ringer's solution (mM): NaCl 147, KCl 4, CaCl2 2.4, pH adjusted to 7.3 with NaOH, containing morphine (160 nM) and M6G (100 nM) at a flow rate of 3 μl min−1. Before the drugs were perfused, four dialysate samples were collected every 20 min to provide blank samples, and then the perfusion was continued for another 4 h, during which samples were collected every 20 min, and stored at −20°C until assay. The recovery for each compound at each time was calculated as follows RL=(Cin–Cout)×Cin−1, where Cin and Cout were the concentrations of the drug in the perfusate and in the dialysate samples respectively (Wang et al., 1993). The recoveries for morphine and M6G were 15.6±1.7% and 11.4±1.4%, respectively, and did not change significantly during the 4 h period. The concentrations of morphine and M6G in dialysates were corrected on the basis of the mean recovery of the fibre to determine the corresponding concentrations of unbound drugs in brain ECF.
Microdialysis experiments
Dialysis experiments were performed 24 h after fibre implantation to allow the BBB to recover its integrity (Barjavel et al., 1994). The dialysis fibre was perfused with Ringer's solution at a constant flow rate of 3 μl min−1. Four dialysate samples were collected at 10-min intervals and defined as blanks. Groups of five rats were given morphine or M6G (10 mg kg−1 s.c.). The dialysate samples were collected every 10 min for 90 min and then every 30 min for 150 min during the 4 h experiment. They were kept at −20°C until analysis. In parallel, 300 μl blood from the femoral artery were collected 15, 35, 55, 85, 115, 145, 204 and 240 min after drug administration. Samples were centrifuged at 3000×g for 5 min and used to determine the total plasma morphine and M6G concentrations. Two 500 μl blood samples were collected for the determination of unbound and total opioid concentrations. These two sampling times were selected at random among the previous fixed times of blood collection. After each collection, an equal volume of blood was taken from a donor rat and injected to maintain the blood volume. The concentration of opioids in plasma and dialysates were determined by h.p.l.c. with fluorimetric detection.
Study C: CSF and plasma pharmacokinetics of morphine and M6G
Rats were anaesthetized with chloral hydrate (300 mg kg−1, i.p.). At each CSF-collection time (5, 10, 15, 30, 45, 60, 120 and 180 min) after administering morphine or M6G (10 mg kg−1 s.c.), 50 μl of CSF was taken by cisterna magna puncture from three rats, using an adapted microsyringe (Boschi et al., 1983). The animals were then decapitated and blood was collected from the trunk. The plasma was separated by centrifuging, and used to measure the total and unbound morphine and M6G concentrations. CSF and plasma samples were kept at −20°C until h.p.l.c. analysis for opioids.
Preparation and analysis of samples
h.p.l.c. procedure
Samples of plasma, CSF, brain dialysates and tissues were subjected to solid phase extraction (Pawula et al., 1993). Concentrations of M6G and morphine were then determined by reverse-phase high-performance liquid chromatography with fluorimetric detection (Déchelotte et al., 1993; D'Honneur et al., 1994). Extractions were performed using a C18 cartridge which was first pre-wetted with methanol (1 ml), followed by water (1 ml). The sample was then applied to the cartridge, and washed with 4×1 ml of water. Morphine and its metabolites were then eluted with 0.5 ml of the h.p.l.c. mobile phase, 20 μl of which was injected directly onto the h.p.l.c. column. The extraction recoveries ranged from 85–101%. Hydromorphone was used as an internal standard. The h.p.l.c. system consisted of a Merck-Hitachi 6200 pump, a Rheodyne valve (20 μl loop), a C8 reverse-phase column (LiChrospher 60 RP Select B, Merck), 250×4 mm, 5 μm, and a fluorescence spectrophotometer Merck-Hitachi L-3000 with a photodiode array detector. The excitation and emission wavelengths were 280 and 335 nm respectively. The mobile phase contained 0.1% trifluoroacetic acid in 4% acetonitrile. The flow rate was 1.5 ml min−1 and the column was maintained at 40°C. The results were recorded on a D-2500 integrator (Merck), and integrated using chromatography data station software (HPLC Manager, Merck-Hitachi). A standard curve was plotted for each biological fluid or tissue. The limits of quantification were 3 and 12 nM for morphine and M6G, respectively. Assay precision determination showed that within- and between-day reproducibility values were 6.0 and 11.2% respectively for morphine and 4.5 and 9.7% for M6G.
Plasma protein binding
Plasma protein binding was determined in the plasma samples from Studies A and C and in two randomized plasma samples of each rat from Study B. The concentration of unbound and protein bound morphine and M6G in 200 μl of plasma was determined by equilibrium dialysis against a solution of phosphate buffer solution (pH 7.4) as previously described by Stain et al. (1995).
Pharmacokinetic analysis
Pharmacokinetic parameters were calculated by a model-independent method. All drug concentrations were fitted at the time of blood- or tissue-sampling, apart from the brain ECF level of the drug, which was plotted at the mid-point of the time collection interval, as suggested by Stahle (1992). The maximum concentration (Cmax) and time to reach Cmax (Tmax) were the observed values. The medium time delay (MTD) was calculated as the difference between plasma and brain Tmax values. The terminal half-lives (t1/2λZ) of morphine and M6G were determined from the terminal rate constant, λZ, calculated by linear regression analysis of the last points belonging to the terminal phase using the Siphar program (Simed, Créteil, France). The area under the concentration-time curve from time zero to the last measured concentration at time t (AUC0-t) was calculated by the trapezoidal method from the experimental curve. The extrapolated AUCt-∞ was calculated by dividing the last concentration by λZ. The AUC of drug concentrations in brain intracellular space (AUCICS) was calculated as AUCICS=(AUCtissue–fv,extAUCECF) (1–fv,ext)−1, where AUCtissue was the AUC of the drug in total brain, AUCECF the AUC of the drug in the brain extracellular fluid and fv,ext, the brain extracellular volume fraction; fv,ext was taken to be 0.18 (Bradbury, 1979).
The AUC ratios for brain ECF to unbound drug plasma, CSF to unbound drug plasma and brain ICS to ECF were calculated. The apparent clearance (CL f−1) in plasma was calculated as dose×(AUC0-∞)−1 where f corresponds to the bioavailability factor and the volume of distribution (VZ f−1) was calculated as f×dose×(AUC0-∞×λZ)−1.
Data analysis
Comparisons of the plasma concentrations of morphine and M6G from Studies A,B,C were analysed by one-way analysis of variance followed by Student's t-test. The level of significance, P<0.05, was corrected using the Bonferroni formula.
Results
Plasma pharmacokinetics of morphine and M6G
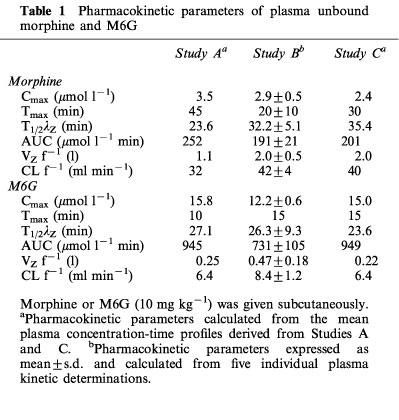
The mean total plasma morphine and M6G concentrations versus time profiles after drug administration (10 mg kg−1) for the rats from Studies A, B and C are shown in Figure 1. No significant differences were observed between the three studies for the total plasma concentration of each compound for each time. Concentrations of M6G were far higher than those of morphine and remained higher for 1 h thereafter. The percentages of unbound drugs determined in plasma samples from the three studies ranged from 71–94% for morphine and from 73–96% for M6G. Pharmacokinetic parameters were calculated from the disposition kinetics of both unbound compounds (Table 1). The plasma Cmax of unbound M6G was 4.2–6.2 times higher than that of unbound morphine, and therefore the AUC of the plasma concentrations of unbound M6G was 3.7–4.7 fold higher than that of unbound morphine. M6G was found to reach its maximum concentration at Tmax=10–15 min, whereas morphine was more slowly absorbed, with Tmax ranging from 20–45 min. Thereafter, M6G and morphine declined biexponentially with terminal half-lives (t1/2λZ) of 26.3±9.3 and 32.2±5.1 min (Study B) respectively. The systemic CL f−1 and VZ f−1 values for unbound morphine were approximately five and four times higher than those of M6G, respectively.
Figure 1.
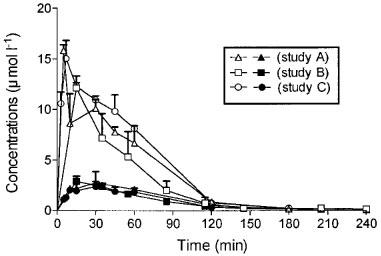
Time course of plasma concentrations of total M6G (10 mg kg−1 s.c., solid symbols) and total morphine (10 mg kg−1 s.c., open symbols) in rats. Values represent mean±s.d., n=5 (Anova, Bonferroni multiple comparison tests).
Table 1.
Pharmacokinetic parameters of plasma unbound morphine and M6G
Brain and CSF pharmacokinetics of morphine
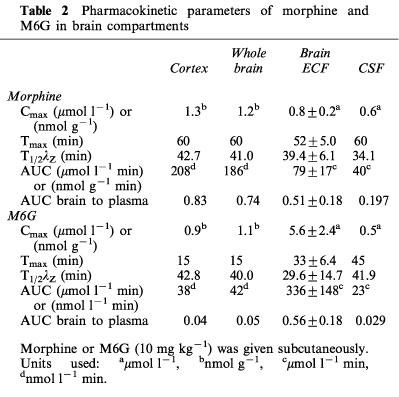
The time course of morphine concentrations in brain ECF, cortex, whole brain and CSF are displayed in Figure 2 and the pharmacokinetic parameters are given in Table 2. Morphine exhibited a rather similar brain uptake time course in all the brain compartments investigated (Tmax around 60 min) and the terminal half-lives ranged from 34.1 min (CSF) to 42.7 min (cortex). The median time delay (MTD) between plasma and brain parenchyma or brain ECF was 15 and 32 min, respectively and the MTD between plasma and CSF was 30 min. The ratios between the various AUC of brain to plasma for unbound morphine ranged from 0.83 (cortex) and 0.74 (whole brain) to 0.51 (ECF) and 0.19 (CSF). The AUC of the brain intracellular concentrations of morphine (AUCICS) was calculated using the formula: AUCICS=(AUCtissue–fv,ext AUCECF) (1–fv,ext)−1 (see Pharmacokinetic analysis in Methods) and found to be 323.8 μmol l−1 min. On the basis of the ratio of their respective brain AUC values, the concentration of morphine in the intracellular space (ICS) was four and eight times higher than in the ECF and CSF, respectively.
Figure 2.
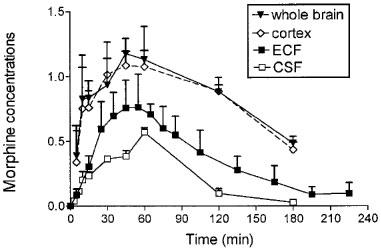
Time course of morphine concentrations (10 mg kg−1 s.c.) in brain compartments. Concentrations were expressed in nmol g−1 in whole brain and cortex and in μmol l−1 in brain ECF and CSF. Values represent mean±s.d. (n=5).
Table 2.
Pharmacokinetic parameters of morphine and M6G in brain compartments
Brain and CSF pharmacokinetics of M6G
The time course and the pharmacokinetic parameters of M6G in brain ECF, cortex, whole brain and CSF are shown in Figure 3 and Table 2. The disposition of M6G did not appear to be as homogeneous as that of morphine. The Cmax of M6G in cortex and whole brain was of the order of unity (nmol g−1), whereas it was five times higher in brain ECF. Tmax was observed at 15 min in the cortex and whole brain, at 33 min in the ECF and not until 45 min in the CSF. The MTD between plasma and ECF was 19 min, but there was no delay between plasma and cortex and whole brain. The MTD between plasma and CSF was the longest at 31 min. The terminal half-lives were found in similar ranges in the various compartments (t1/2λZ=29.6–42.8 min), and were similar to the values found for morphine (34.1–42.7 min). However, the various AUC ratios of brain to plasma unbound M6G differed markedly from those of morphine. They were found to be dramatically low in the cortex (0.04), whole brain (0.05) and CSF (0.029) and quite similar to that of morphine in the ECF (0.56). The AUC of the brain intracellular concentrations (AUCICS) of M6G was calculated in the same way as for morphine, and found to be 2.7 μmol l−1 min. Comparison of M6G brain AUC values for ICS, ECF and CSF shows that the level of M6G in ECF was 125 and 20 times higher than in ICS and CSF, respectively.
Figure 3.
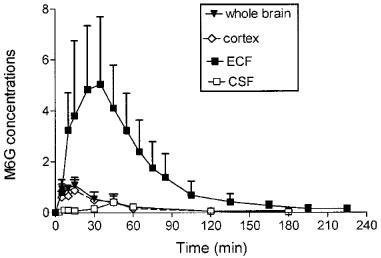
Time course of M6G concentrations (10 mg kg−1 s.c.) in brain compartments. Concentrations were expressed in nmol g−1 in whole brain and cortex and in μmol l−1 in brain ECF and CSF. Values represent mean±s.d. (n=5).
The various brain to plasma ratios of morphine and M6G concentrations as a function of time are shown in Figure 4. The brain tissue to plasma ratios for morphine were much higher than those for M6G, and the maximum ratio was reached at 60 min for M6G and at 120 min for morphine (Figure 4a). The brain ECF to plasma ratios were in the same range for morphine and M6G, but had different kinetic profiles. M6G ratios slowly increased over 210 min, whereas morphine ratios reached a maximum within 60–90 min and started to decline at 150 min (Figure 4b). The CSF to plasma ratios differed markedly for the two drugs. For morphine, the ratios soon exceeded those of M6G and continued to increase up to 120 min, then they declined rapidly (Figure 4c). In contrast, very low values of the CSF to plasma ratios for M6G persisted until 60 min and then the ratios increased extremely slowly up to 180 min.
Figure 4.
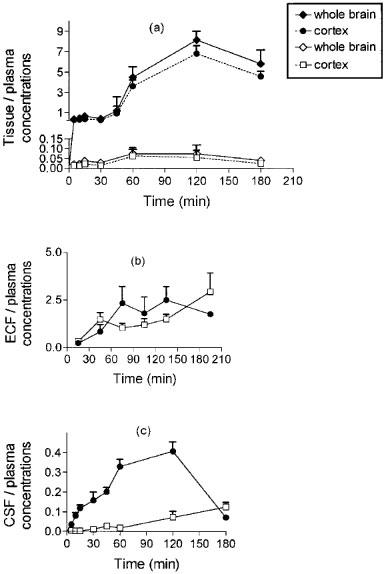
Concentration ratios of morphine (solid symbols) and M6G (open symbols) between brain compartments and plasma. Values represent mean±s.d. (n=5).
Discussion
The enigmatic combination of the extremely low permeability of BBB to M6G and the CNS-mediated analgesia induced by M6G following peripheral administration is still subject to debate. A complete understanding of all the pharmacokinetic steps characterizing brain M6G uptake and disposition could elucidate the apparent paradox. When a drug crosses the BBB, it first enters the brain ECF. The concentration in the brain ECF is regulated by at least five factors (1) the plasma protein binding, which determines the unbound fraction of the drug available in the brain capillaries, (2) BBB transport rates, which determine the transfer of the drug between plasma and ECF, which may be the result of passive diffusion, active uptake, or efflux transport processes, (3) brain ICS-to-ECF partitioning and binding to tissues including receptors, (4) metabolism of the drug in the various brain spaces and (5) clearance by the CSF. Our data help to describe most of these kinetic regulating factors and provide the information to clarify the enigma of the disposition and activity of M6G in the brain.
(1) Plasma protein binding cannot be considered as a limiting factor of brain uptake of M6G or morphine. The percentages of unbound morphine and M6G in plasma were similar, and ranged from 71–96%. These values were comparable to those reported by others in rats: 85% for morphine (Mistry & Houston, 1987) and 83% for M6G (Bickel et al., 1996). One important difference is the higher plasma levels of M6G following administration of the same dose and by the same route. After therapeutic administration of oral morphine, the plasma AUC of M6G exceeds that of morphine by a factor of 9 : 1 (Osborne et al., 1990). These higher M6G plasma levels result from the lower volume of distribution and lower clearance of M6G. The higher clearance of morphine is related to its biotransformation in M3G (Kuo et al., 1991). These parameters explain why plasma M6G peaks more quickly (Tmax at 10–15 min versus 20–45 min for morphine) and reaches concentrations 4.2–6.2 times higher than those of morphine. These two synergistic pharmacokinetic effects lead to a steeper blood-brain concentration gradient for M6G which could compensate for the poor BBB permeability.
(2) The low BBB permeability to M6G is well documented by the two studies of Bickel et al. (1996) and Wu et al. (1997), who have reported that the BBB of the rat is 32 and 57 times less permeable to M6G than to morphine. The permeability-surface area product (PS) of M6G (0.11±0.01 μl min−1 g−1) can be considered to be similar to that of sucrose (PS=0.62±0.60 μl min−1 g−1) (Bickel et al., 1996), a commonly used reference marker of the BBB integrity which has a brain ECF to plasma ratio estimated at 3.7% (Terasaki et al., 1992). The low BBB permeability to M6G is mainly attributable to the highly hydrophilic nature of morphine glucuronides, with log P values around −log 3. The transport of these opioids to the brain is thought to occur mainly by diffusion (Carrupt et al., 1991; Murphey & Olsen, 1994), but more recent studies have also implicated the P-glycoprotein (P-gp) in the efflux of drugs like morphine and M6G from cerebral endothelial cells to blood (Huwyler et al., 1996). This means that the higher unbound plasma levels of M6G can partially compensate for the permeability difference between M6G and morphine in determining entry into the brain. This possibility is well documented by Björkman et al. (1995) who used a physiological model in the pig and measured the arterio-venous concentration gradient, to demonstrate that rapid and extensive brain uptake occurs in the first 5 min after an intravenous administration of morphine, M3G or M6G, i.e. when the concentration gradient is at its steepest. This explanation is supported by the lack of delay between Tmax in plasma and brain tissues, i.e. 15 min after administering M6G. In our experiments, Tmax in brain ECF was apparently later (33±6.4 min), but this may have been attributable to the 20 min sample collection interval in the microdialysis protocol. We found that Tmax in the brain compartments occurred later for morphine than for M6G. A similar finding is reported by Aasmunstad et al. (1995), who suggest that morphine is loaded into the brain intracellular space to a greater extent than M6G so that it takes longer to reach steady state. The quasi-instantaneous equilibrium of drug concentrations in the blood and the brain extracellular fluid has been demonstrated for other hydrophilic compounds, such as atenolol, acetaminophen (for a review see Hammarlund-Udenaes et al., 1997).
(3) This quasi-instantaneous plasma to brain ECF equilibrium of M6G concentration does not only depend on rapid passage across the BBB, but also on extra- and intracellular partitioning within the brain. Combining the data obtained by these two procedures spectacularly elucidates the enigma. Analysis of the whole brain tissue samples provides a measurement of the total brain drug concentrations (ECF +ICS). The distinction between extracellular and intracellular drug concentration was obtained from the brain microdialysis technique which measured ECF drug concentrations. The cortex of rat was chosen because it offers access to a large surface of dialysis, resulting in satisfying in vivo recoveries (15.6 and 11.4% for morphine and M6G, respectively). Our results, obtained in brain homogenates, indicate that pharmacokinetic parameters are similar for cortex and whole brain. Measurements of homogenates from several regions of the rat brain after intravenous administration of morphine had already demonstrated that the morphine level in the cortex is representative of the rest of the brain (Bhargava et al., 1993). This has been confirmed by microdialysis following the administration of morphine (10 mg kg−1, i.p.); peak concentrations of morphine were found to be in the same range in several cerebral structures in which the time course of the extracellular morphine concentration was almost identical (Matos et al., 1992). By comparing the AUC ratios of cortex to plasma of unbound morphine and M6G (Table 2), we found dramatic differences in the brain ECF to ICS partitioning of the two compounds. By considering the whole brain or cortex tissue to plasma ratios, we found relatively high ratios for morphine, quite similar to those described by Bhargava et al. (1993), but much lower values for M6G, about 21 times lower than those of morphine (cortex). These values are in agreement with those of other studies showing that around 1% of the M6G dose was found in the brain of rats (Yoshimura et al., 1973) and guinea-pig (Murphey & Olsen, 1994) and more interestingly, that 3% of the plasma M6G level had entered the brain by 60 min (Bickel et al., 1996). Allowing for the effect of plasma protein binding, our value is similar to that reported by Bickel (4–5% based on our AUC values). In contrast, we did not find any differences between morphine and M6G for the brain ECF to plasma ratios, suggesting that M6G brain partitioning from ECF to ICS did not occur. In fact, we calculated that the concentration of M6G molecules in ECF was 125 times higher than in ICS, whereas morphine levels were four times greater in ICS than in ECF. Assuming that the brain ECF space represents only 18% of the brain weight (Bradbury, 1979), restriction of the diffusion of the M6G molecules within this small hydrophilic space yields unexpected elevated M6G concentrations, which can be only measured by the microdialysis technique. In contrast, morphine preferentially entered the brain ICS, so that brain ECF concentrations were lower than those of M6G, though more morphine may enter the brain. This partition is the key to the paradox, and explains why M6G induces CNS-mediated analgesia despite low BBB permeability. Bickel et al. (1996) suggested three hypotheses to explain how the poor uptake of M6G by the brain could be compensated for. He advanced one pharmacodynamic hypothesis based on the fact that in vivo M6G elicits the same analgesic effect as morphine while occupying 10–46 times fewer receptors. He also suggested two pharmacokinetic possibilities: (1) M6G may have a higher plasma AUC and (2) the distribution of glucuronides may be restricted to the brain extracellular space, so that they reach relatively higher brain ECF concentrations despite lower total brain tissue concentrations. Our data confirmed both these pharmacokinetic hypotheses. Our data shows that it is only by combining brain microdialysis and conventional determinations of brain concentrations that the critical ECF-ICS partitioning parameter of a drug can be determined. Our data also indicates that the brain microdialysis technique may be misinterpreted if the ECF concentrations of a drug alone are taken into account in determining BBB permeability, without considering partitioning within the various brain spaces. This misinterpretation has led to some discrepancies, as high brain ECF levels of opioids, specially M6G, have sometimes been attributed to disruption of the BBB caused by the insertion of the microdialysis probe (Morgan et al., 1996). A previous study had already clearly demonstrated that BBB integrity is restored within 24 h after implanting the dialysis probe (Barjavel et al., 1994) and numerous drug dispositions in the brain have now been determined accurately by microdialysis (for a review see Elmquist & Sawchuk, 1997). Recently, we used a double blood–brain microdialysis technique in mice to show that colchicine reaches levels in the brain ICS which are ten times higher than in the brain ECF (Evrard et al., 1998). Other studies have demonstrated that centrally active drugs (including valproate) may reach relatively high extracellular concentrations, despite poor penetration into brain tissue (Wolf et al., 1991). Brain microdialysis data reflect the balance between passage across the BBB and partitioning between brain ECF and brain ICS in the early phase of the kinetics. Thereafter, other processes may determine the kinetics in ECF, such as clearance events including drug metabolism and elimination in the blood and/or CSF.
(4) We have previously demonstrated the stability of M6G in whole brain homogenates (Stain-Texier et al., 1998). In consequence, clearance can be taken to be restricted to the rate of diffusion from the brain ECF to the CSF compartment, where the convective flow of ECF may also contribute to the clearance of the compound from this space (Morrison et al., 1991; Collins & Dedrick, 1983).
(5) Lower AUC values and the later Tmax observed for morphine and M6G in CSF than in the other CNS compartments also suggest that these drugs enter the brain predominantly through the BBB, and that the blood–CSF barrier plays a less important role. This means that morphine and M6G could enter the brain ECF, reach the ependymal lining of the ventricle, and then diffuse into the flowing CSF environment. M6G enters the CSF more slowly than morphine with a CSF to plasma concentration ratio for M6G which slowly attained a value of 0.1 at 120 min. The observation that the brain ECF concentrations are higher than the CSF concentrations for both morphine and M6G confirm observations that have been made for a number of solutes (Hollingsworth & Davson, 1973). The AUCECF to AUCCSF ratio was more elevated for M6G than for morphine (15 and 2, respectively) confirming that M6G was trapped in the brain ECF. Moreover the increase of the brain ECF to plasma and CSF to plasma ratios for M6G throughout the 210 min measured, suggests that active processes may be involved in trapping M6G within the brain ECF space. It was recently suggested that morphine is a substrate for P-gp but M6G may be a substrate for multidrug resistance-associated protein (MRP). This difference may have some bearing on brain ECF concentrations given that P-gp is expressed mainly in the cerebral capillary endothelium whereas MRP is predominantly expressed elsewhere in the brain (Regina et al., 1998).
These elevated M6G levels in brain ECF may explain why M6G demonstrates greater analgesic potency than morphine (Shimomura et al., 1971; Paul et al., 1989; Stain et al., 1995). Binding studies have indicated that M6G has 3–5 times lower affinity than morphine for μ receptors both in vitro and in vivo (Christensen & Jorgensen, 1987; Paul et al., 1989; Frances et al., 1992). The difference between the pharmacological responses to morphine and M6G cannot therefore be attributed to their affinities for the opioid receptors in brain ECF. Finally, this difference in the pharmacological response can be explained by differences in the distribution of the two drugs to the various brain compartments. Morphine diffuses extensively within the brain cells whereas M6G is located almost exclusively outside the brain cells, remaining available quickly and durably to bind at opioid receptors.
In conclusion, a compound with poor BBB permeability, such as M6G, may reach high concentrations in the brain ECF if its distribution is limited to this small space. This space corresponds to the biophase of the compound, and so significant pharmacodynamic efficacy may be attained. Events of this type determine the pharmacokinetics and pharmacodynamics in the brain, and should be taken into account in studies of CNS drugs.
Acknowledgments
The authors thank Owen Parkes for editing the English text.
Abbreviations
- AUC
area under the curve
- BBB
blood–brain barrier
- CL f−1
apparent clearance
- Cmax
maximum concentration
- ECF
extracellular fluid
- fv,ext
brain extracellular volume fraction
- ICS
intracellular space
- M6G
morphine 6-glucuronide
- MTD
medium time delay
- t1/2λz
terminal half-life
- Tmax
time to reach Cmax
- Vzf−1
volume of distribution
References
- AASMUNSTAD T.A., MORLAND J., PAULSEN R. Distribution of morphine 6-glucuronide and morphine across the blood–brain barrier in awake, freely moving rats investigated by in vivo microdialysis. J. Pharmacol. Exp. Ther. 1995;275:435–441. [PubMed] [Google Scholar]
- BARJAVEL M., SANDOUK P., PLOTKINE M., SCHERRMANN J.M. Morphine and morphine metabolite kinetics in the rat brain as assessed by transcortical microdialysis. Life Sci. 1994;55:1301–1308. doi: 10.1016/0024-3205(94)90069-8. [DOI] [PubMed] [Google Scholar]
- BHARGAVA H.N., VILLAR V.M., RAHMANI N.H., LARSEN A.K. Time course of the distribution of morphine in brain regions, spinal cord and serum following intravenous injection to rats of differing ages. Pharmacology. 1993;47:12–23. doi: 10.1159/000139073. [DOI] [PubMed] [Google Scholar]
- BICKEL U., SCHUMACHER O.P., KANG Y.-S., VOIGT K. Poor permeability of morphine 3-glucuronide and morphine 6-glucuronide through the blood–brain barrier in the rat. J. Pharmacol. Exp. Ther. 1996;278:107–113. [PubMed] [Google Scholar]
- BJÖRKMAN S., AKESON J., HELFER M., FYGE A., GUSTAFSSON L. Cerebral uptake of morphine in the pig calculated from arterio-venous plasma concentration gradients: an alternative to tissue microdialysis. Life Sci. 1995;57:2335–2345. doi: 10.1016/0024-3205(95)02228-b. [DOI] [PubMed] [Google Scholar]
- BOSCHI G., MORIER E., RIPS R. Comparison of biogenic amines and their metabolites in the CSF of mice and rats. IRCS Med. Sci. 1983;11:518–519. [Google Scholar]
- BRADBURY M. The ultrastructure of the blood–brain barrier. The Concept of a Blood–Brain Barrier. New York: John Wiley & Sons; 1979. pp. 60–83. [Google Scholar]
- CARRUPT P.A., TESTA B., BECHALANY A., EL TAYAR N., DESCAS P., PERRISSOUD D. Morphine 6-glucuronide and morphine 3-glucuronide as molecular chameleons with unexpected lipophilicity. J. Med. Chem. 1991;34:1272–1275. doi: 10.1021/jm00108a005. [DOI] [PubMed] [Google Scholar]
- CHRISTENSEN C.B., JORGENSEN L.N. Morphine 6-glucuronide has high affinity for the opioid receptor. Pharmacol. Toxicol. 1987;60:75–76. doi: 10.1111/j.1600-0773.1987.tb01724.x. [DOI] [PubMed] [Google Scholar]
- COLLINS J.M., DEDRICK R.L. Distributed model for drug delivery to CSF and brain tissue. Am. J. Physiol. 1983;245:303–310. doi: 10.1152/ajpregu.1983.245.3.R303. [DOI] [PubMed] [Google Scholar]
- DECHELOTTE P., SABOURAUD A., SANDOUK P., HACKBARTH I., SCHWENK M. Uptake, 3- and 6-glucuronidation of morphine in isolated cells from stomach, intestine, colon and liver of guinea-pig. Drug Metab. Dispos. 1993;21:13–17. [PubMed] [Google Scholar]
- D'HONNEUR G., GILTON A., SANDOUK P., SCHERRMANN J.M., DUVALDESTIN P. Plasma and cerebrospinal fluid concentrations of morphine and morphine glucuronides after oral morphine. Anesthesiology. 1994;81:87–93. doi: 10.1097/00000542-199407000-00013. [DOI] [PubMed] [Google Scholar]
- ELMQUIST W.F., SAWCHUK R.J. Application of microdialysis in pharmacokinetic studies. Pharm. Res. 1997;14:267–287. doi: 10.1023/a:1012081501464. [DOI] [PubMed] [Google Scholar]
- EVERETT N.B., SIMMONS B., LASHER E.P. Distribution of blood (Fe59) and plasma (I131) volumes of rats determined by liquid nitrogen freezing. Circulation Res. 1956;4:419–425. doi: 10.1161/01.res.4.4.419. [DOI] [PubMed] [Google Scholar]
- EVRARD P.A., RAGUSI C., BOSCHI G., VERBEEK R.K., SCHERRMANN J.M. Simultaneous microdialysis in brain and blood of the mouse: extracellular and intracellular brain colchicine disposition. Brain Res. 1998;786:122–127. doi: 10.1016/s0006-8993(97)01454-6. [DOI] [PubMed] [Google Scholar]
- FRANCES B., GOUT R., MONTSARRAT B., CROS J., ZAJAC J.M. Further evidence that morphine 6-β-glucuronide is a more potent opioid agonist than morphine. J. Pharmacol. Exp. Ther. 1992;262:25–31. [PubMed] [Google Scholar]
- GONG Q.L., HEDNER T., HEDNER J., BJORKMAN R., NORDBERG G. Antinociceptive and ventilatory effects of the morphine metabolites: morphine 6-glucuronide and morphine 3-glucuronide. Eur. J. Pharmacol. 1991;193:47–56. doi: 10.1016/0014-2999(91)90199-z. [DOI] [PubMed] [Google Scholar]
- GOUCKE C.R., HACKETT L.P., ILETT K.F. Concentrations of morphine, morphine 6-glucuronide and morphine 3-glucuronide in serum and cerebrospinal fluid following morphine drug equilibration across the blood–brain barrier–Pharmacokinetic considerations based on the microdialysis method. Pharm. Res. 1994;14:128–134. doi: 10.1023/a:1012080106490. [DOI] [PubMed] [Google Scholar]
- HAMMARLUND-UDENAES M., PAALZOW L.K., DE LANGE C.M. Disposition and analgesic effects of systemic morphine, morphine 6-glucuronide and normorphine in rat. Pharmacol. Toxicol. 1997;79:40–46. doi: 10.1111/j.1600-0773.1996.tb00239.x. [DOI] [PubMed] [Google Scholar]
- HASSELSTRÖM J., SVENSSON J.O., SÄWE J., WIESENFELD-HALLIN Z., YUE Q.-Y., XU X.-J. Administration to patients with morphine-resistance pain. Pain. 1996;56:145–149. [Google Scholar]
- HOLLINGSWORTH J.G., DAVSON H. Transport of sulfate in the rabbits brain. J. Neurobiol. 1973;4:389–396. doi: 10.1002/neu.480040407. [DOI] [PubMed] [Google Scholar]
- HUWYLER J., DREWE J., KLUSEMANN C., FRICKER G. Evidence for P-glycoprotein-modulated penetration of morphine 6-glucuronide into brain capillary endothelium. Br. J. Pharmacol. 1996;118:1879–1885. doi: 10.1111/j.1476-5381.1996.tb15619.x. [DOI] [PMC free article] [PubMed] [Google Scholar]
- KUO C.K., HANIOKA N., HOSHIKAWA Y., OGURI K., YOSHIMURA H. Species differences of site-selective glucuronidation of morphine. J. Pharmacobio-Dyn. 1991;14:187–193. doi: 10.1248/bpb1978.14.187. [DOI] [PubMed] [Google Scholar]
- MATOS F.F., ROLLEMA H., BASBAUM A.I. Simultaneous measurement of extracellular morphine and serotonin in brain tissue and CSF by microdialysis in awake rats. J. Neurochem. 1992;58:1773–1781. doi: 10.1111/j.1471-4159.1992.tb10053.x. [DOI] [PubMed] [Google Scholar]
- MATTHES H.W.D., MALDONADO R., SIMONIN F., VALVERDE O., SLOWE S., KITCHEN I., BEFORT K., DIERICH A., LE MEUR M., DOLLÉ P., TZAVARA E., HANOUNE J., ROQUES B.P., KIEFFER B.L. Loss of morphine-induced analgesia, reward effect and withdrawal symptoms in mice lacking the μ-opioid-receptor gene. Nature. 1996;383:819–823. doi: 10.1038/383819a0. [DOI] [PubMed] [Google Scholar]
- MIGNAT C., JANSEN R., ZIEGLER A. Plasma and cerebrospinal fluid concentration of morphine and morphine glucuronides in rabbits receiving single and repeated doses of morphine. J. Pharm. Pharmacol. 1995;47:171–175. doi: 10.1111/j.2042-7158.1995.tb05772.x. [DOI] [PubMed] [Google Scholar]
- MISTRY M., HOUSTON J.B. Glucuronidation in vitro and in vivo. Comparison of intestinal and hepatic conjugation of morphine, naloxone and buprenorphine. Drug Metab. Dispos. 1987;15:710–717. [PubMed] [Google Scholar]
- MORGAN M.E., SINGHAL D., ANDERSON B.D. Quantitative assessment of blood–brain barrier damage during microdialysis. J. Pharmacol. Exp. Ther. 1996;277:1167–1176. [PubMed] [Google Scholar]
- MORRISON P.F., BUNGAY P.M., HSIAO J.K., BALL B.A., MEFFORD I.N., DEDRICK T.L. Quantitative microdialysis: Analysis of transients and application to pharmacokinetics in brain. J. Neurochem. 1991;57:103–119. doi: 10.1111/j.1471-4159.1991.tb02105.x. [DOI] [PubMed] [Google Scholar]
- MURPHEY L.J., OLSEN G.D. Diffusion of morphine-6-β-D-glucuronide into the neonatal guinea pig brain during drug-induced respiratory depression. J. Pharmacol. Exp. Ther. 1994;271:118–124. [PubMed] [Google Scholar]
- OSBORNE R., JOEL S., TREW D., PATEL N., SLEVIN M. Morphine and metabolite behavior after different routes of morphine administration: Demonstration of the importance of the active metabolite morphine-6-glucuronide. Clin. Pharmacol. Ther. 1990;47:12–19. doi: 10.1038/clpt.1990.2. [DOI] [PubMed] [Google Scholar]
- OSBORNE R., THOMPSON P., JOEL S., TREW D., PATEL N., SLEVIN M. The analgesic activity of morphine 6-glucuronide. Br. J. Clin. Pharmacol. 1992;34:103–138. doi: 10.1111/j.1365-2125.1992.tb04121.x. [DOI] [PMC free article] [PubMed] [Google Scholar]
- PAUL D., STANDIFFER K.M., INTURRISI C.E., PASTERNAK G.W. Pharmacological characterization of morphine 6-β-glucuronidase, a very potent morphine metabolite. J. Pharmacol. Exp. Ther. 1989;251:477–483. [PubMed] [Google Scholar]
- PAWULA M., BARRETT D.A., SHAW P.N. An improved extraction method for the HPLC determination of morphine and its metabolites in plasma. J. Pharm. Biomed. Anal. 1993;11:401–406. doi: 10.1016/0731-7085(93)80036-z. [DOI] [PubMed] [Google Scholar]
- PAXINOS G., WATSON C. The Rat Brain in Stereotaxic Coordinates. San Diego: Academic Press; 1986. [Google Scholar]
- REGINA A., KOMAN A., PICIOTTI M., EL HAFNY B., CENTER M.S., BERGMANN R., COURAUD P.O., ROUX F. Mrp1 multidrug resistance-associated protein and P-glycoprotein expression in rat brain microvessel endothelial cells. J. Neurochem. 1998;71:705–715. doi: 10.1046/j.1471-4159.1998.71020705.x. [DOI] [PubMed] [Google Scholar]
- SHIMOMURA K., KAMATA O., UEKI S., IDA S., OGURI K., YOSHIMURA H., TSUKAMOTO H. Analgesic effect of morphine glucuronide. Tohoku J. Exp. Med. 1971;105:45–52. doi: 10.1620/tjem.105.45. [DOI] [PubMed] [Google Scholar]
- STAHLE L. Pharmacokinetic estimations from microdialysis data. Eur. J. Clin. Pharmacol. 1992;43:289–291. doi: 10.1007/BF02333025. [DOI] [PubMed] [Google Scholar]
- STAIN F., BARJAVEL M.J., SANDOUK P., PLOTKINE M., SCHERRMANN J.-M., BHARGAVA H.N. Analgesic response and plasma and brain extracellular fluid pharmacokinetics of morphine and morphine-6-β-D-glucuronide in the rat. J. Pharmacol. Exp. Ther. 1995;274:852–857. [PubMed] [Google Scholar]
- STAIN-TEXIER F., SANDOUK P., SCHERRMANN J.-M. Stability of morphine 6-glucuronide in different physiological compartments of the rat. Drug Metab. Dispos. 1998;26:383–387. [PubMed] [Google Scholar]
- TERASAKI T., DEGUCHI Y., KASAMA Y., PARDRIDGE W.M., TSUJI A. Determination of in vivo steady-state unbound drug concentration in the brain interstitial fluid by microdialysis. Int. J. Pharmac. 1992;81:143–152. [Google Scholar]
- WANG Y., WONG S.L., SAWCHUK R.J. Microdialysis calibration using retrodialysis and zero-net-flux: application to a study of the distribution of zidovudine to rabbit cerebrospinal fluid and thalamus. Pharm. Res. 1993;10:1411–1419. doi: 10.1023/a:1018906821725. [DOI] [PubMed] [Google Scholar]
- WOLF J.H., VEENMA-VAN DER DUIN L., KORF J. The extracellular concentration of the anti-epileptic drug valproate in the rat brain as determined with microdialysis and an automated HPLC procedure. J. Pharm. Pharmacol. 1991;43:101–106. doi: 10.1111/j.2042-7158.1991.tb06640.x. [DOI] [PubMed] [Google Scholar]
- WOLFF T., SAMUELSSON H., HEDNER T. Morphine and morphine metabolite concentrations in cerebrospinal fluid and plasma in cancer pain patients after slow-release oral morphine administration. Pain. 1995;62:147–154. doi: 10.1016/0304-3959(94)00268-J. [DOI] [PubMed] [Google Scholar]
- WU D., KANG Y.-S., BICKEL U., PARDRIDGE W.M. Blood–brain barrier permeability to morphine 6-glucuronide is markedly reduced compared with morphine. Drug Metab. Dispos. 1997;26:768–771. [PubMed] [Google Scholar]
- YOSHIMURA Y., IDA S., OGURI K., TSUKAMOTO H. Biochemical basis for analgesic activity of morphine-6-glucuronide: I. Penetration of morphine-6-glucuronide in the brain of rats. Biochem. Pharmacol. 1973;22:1423–1430. doi: 10.1016/0006-2952(73)90320-1. [DOI] [PubMed] [Google Scholar]