Abstract
Power spectra (0–30 Hz) were recorded from transcortical electrodes implanted in prefrontal and sensorimotor cortex in conscious rats. For each animal, the spectra in the presence of a drug were divided by the spectra in the presence of vehicle to give a drug-related differential display of the power spectra, the profile of EEG effects.
The profiles of a range of antipsychotic agents of different classes were compared. Haloperidol (0.5 mg kg−1 and 1 mg kg−1 s.c., peak 8–12 Hz), chlorpromazine (0.5 mg kg−1, i.p., peak 8 Hz), levomepromazine (1 mg kg−1, i.p., peak 8 Hz), quetiapine (2.5 mg kg−1, s.c., peak 9–12 Hz), sertindole (2.5 mg kg−1, s.c., peak 6–14 Hz), risperidone (0.5 and 1 mg kg−1 i.p., peak 9 Hz), clozapine (0.1, 0.2, 0.3 and 5 mg kg−1, s.c., peak 8 Hz) and MDL100907 (0.01 mg kg−1 s.c. peak 2 Hz) synchronized the EEG, increasing the power spectra between 2 and 30 Hz, although there were marked differences between the individual profile of EEG effects for each drug.
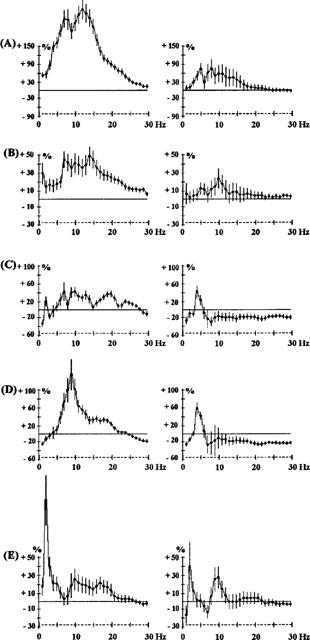
In contrast, the benzamides, sulpiride (7.5 and 15 mg kg−1 i.p.), and amisulpiride (1 and 15 mg kg−1 i.p.) caused marked asynchronous changes in the EEG. Raclopride (2.5 mg kg−1 i.p.), caused an initial peak at 9 Hz, but the effects of raclopride desynchronized over a 3 h time period.
Modafinil and apomorphine, administered alone, decreased the power spectra at frequencies higher than 4 Hz. Modafinil (62.4 mg kg−1, i.p.) selectively antagonized the effects of clozapine, but did not antagonize the effects of raclopride.
Different pharmacological classes of antipsychotic show synchronization or desynchronization of the EEG in the prefrontal cortex, with the benzamides showing a distinctive spectrum. There appears to be a specific interaction between modafinil and clozapine. Thus, modulation of prefrontal cortical function, perhaps by thalamic gating, may be important for antipsychotic activity.
Keywords: EEG, rat, thalamus, clozapine, risperidone, prefrontal cortex, sensorimotor cortex, modafinil
Introduction
The causes of schizophrenia are not known but there is increasing evidence for developmental disruption of the cortex, and of thalamocortical circuitry, in the pathogenesis of the disease (Jacob & Beckman, 1994; Andreasen, 1994; Weinberger, 1987; 1996). Thus, changes in the innervation of temporal and entorhinal cortex have been defined, with reductions in hippocampal, and particularly thalamic volume. Thalamic innervation of the cortex, via the cortical plate, particularly at risk during the 3rd–5th month of foetal development (Molnar & Blakemore, 1995), may be disrupted leading to changes in cortical structure. If not severe, these changes may be compensated for during development so that changes in cognitive function are not marked, or are subtle, until stresses in adolescence or young adulthood, predominate over compensatory changes, leading to the classic signs of schizophrenia.
Neuro-imaging studies of hallucinations have indicated inappropriate cortical address and filtering compatible with problems in thalamocortical activation. Indeed, based on behavioural studies, it has been suggested that schizophrenia may be a disorder associated with hyperattention (Mar et al., 1996). Schizophrenia is frequently associated with EEG abnormalities (Hermann et al., 1991; Matsuura et al., 1994), involving an increase in delta and theta power. The prefrontal cortex in man is important for working memory (Posner, 1997; Rugg et al., 1998; Wharton & Grafman, 1998), which can be assessed by the EEG and by evoked potentials (Gevins et al., 1995). Sarnthein et al. (1998) have shown that low frequency (7–8 Hz) EEG oscillations interact between the prefrontal cortex and posterior association areas during working memory tasks. Schizophrenics have difficulty in activating prefrontal cortex during such tasks (Andreasen, 1994), although it is not clear if this impairment is due to the secondary negative symptoms, which are associated with a hypofrontality and reduced blood flow in frontal areas (Andreasen et al., 1992). Volz et al. (1994) considered that difficulties with interpretation of contextual information was associated with a reduced EEG amplitude at frontal sites and increased amplitude at occipital sites. Changes in event-related potentials have been also correlated with structural brain alterations and clinical features (Egan et al., 1994).
The ascending reticular activating system is composed in part of thalamocortical afferents and activation of this system results in desynchronization of the EEG. When the thalamic relay neurons are hyperpolarized and in burst mode the EEG is desynchronized, whereas their depolarization leads to tonic discharges and EEG synchronization (Steriade & Contreras, 1995). Also, ascending fibres of the serotoninergic, noradrenergic, dopaminergic and cholinergic systems are an important part of the reticular activating system (McCormick, 1992; Steriade et al., 1990a,1990b; 1991; 1993a,1993b,1993c). As indicated by pharmacological studies in rats, changes in the activity of one system is closely linked to specific synchronization or desynchronization of EEG (Shvaloff et al., 1988; Sebban et al., 1999). Pro-psychotic drugs (methamphetamine, phencyclidine) also show distinct EEG spectra (Yamamoto, 1997). We have proposed that synchronization may be taken as an increase in the power spectra in our studies and desynchronization as a reduction (Sebban et al., 1999).
Neuroleptic agents such as haloperidol, used for the treatment of schizophrenia, have been associated with approximately 80% occupation of nigrostriatal D2 receptors and it is probable that modulation of dopaminergic transmission in mesolimbic, mesocortical and nigrostriatal pathways leads to the beneficial and deleterious effects of this class of drug. However, 5-HT2 receptor antagonism may reduce extrapyramidal side effects and the degree of D2 antagonism required for antipsychotic efficacy (Andreasen, 1994). Atypical antipsychotics such as clozapine have improved efficacy with a low profile of extrapyramidal side effects (Andreasen, 1994). Clozapine has affinity for a range of other receptors (Table 1), in particular α1-adrenoceptors. The α1-adrenoceptors are critical in activating glial metabolism (Magistretti et al., 1995) and in modulating local cortical vigilance and thus in coupling neuronal activation with metabolic demand. The α1-adrenoceptors, linked to dopamine receptors (Tassin et al., 1992), form a key thalamo-cortical activation pathway, which may be important in schizophrenia.
Table 1.
pKi values for antipsychotic compounds
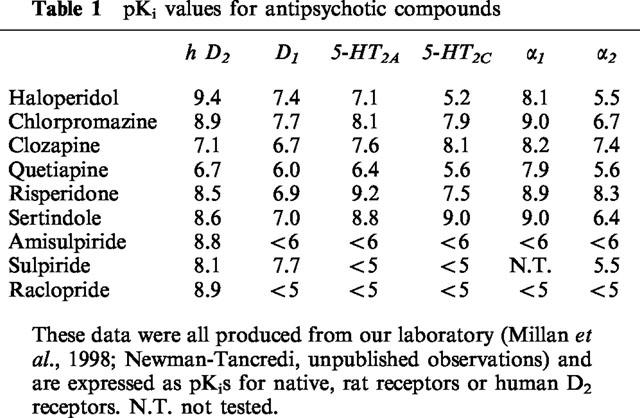
By assessing EEG spectral changes in the prefrontal and sensorimotor cortex in conscious rats (Sebban et al., 1999), we have evaluated the effects of a range of antipsychotic compounds. The aim was to compare the different classes of compound and to assess if the receptor profiles correlate with EEG spectra.
Methods
All the studies have been performed in adult (8 months old) male Wistar rats which were raised in our laboratory. They had a light period of 12 h and free access to food and drinking water. Two bipolar transcortical electrodes were implanted under chloral hydrate anaesthesia (350 mg kg−1 i.p.). The electrode had one exposed site on the surface of the cortex and a second exposed site at the deepest cortical level. The distance between the two contacts was 1 mm. Electrodes were placed in the right and left prefrontal cortex (A+4 mm L+2.5 mm with the bregma as the zero reference point) and in the right and left sensorimotor cortex (A−4 mm; L+4 mm).
After a recovery period of 10 days, rats were trained to remain quiet in small cages (22×12×10 cm) which restricted gross movement. This restraining cage was used during EEG recordings.
Recordings were carried out by placing the rat in the restraining cage into a large electrically insulated chamber (70×70×100 cm). A light source was applied 10 cm in front of the rat nose (Sebban et al., 1987; Shvaloff et al., 1988). In these condition, the rats remained quiet with open eyes and the head held up. They showed quick reactions to slight sound stimulation by turning their head to the source of sound. This behaviour was observed throughout the 3 h recording period.
For each treatment studied (one dose of one drug), two EEG recordings were performed in each rat. The first recording lasted 165 min after i.p. or s.c. injection of the vehicle. The second one was done 24 h later at the same hour for the same duration following i.p. or s.c. administration of the drug.
EEG signals were amplified, filtered and digitalized (64 points s−1) for calculation of the Fourier transformation to obtain the power variable (μV2). Anti-aliasing filters (90 db oct−1) were used. Then four absolute power spectra (right and left) were calculated on 30 s periods for prefrontal and sensorimotor cortex for 165 min after injection of the vehicle or drug. Power spectra were calculated from 1–30 Hz in 1 Hz steps. The drug-induced changes in EEG spectral power were calculated as the ratio of mean spectral power obtained following the injection of drug versus the mean spectral power obtained following administration of vehicle:
 |
This procedure therefore allows for the change in EEG power, expressed as a percentage of the original power, induced by a drug, compared with the control, in the same animal. The EEG spectral power of left and right prefrontal cortex together were averaged for 5 min periods for each recording session. The same was done for left and right sensorimotor cortex.
Statistical analysis
For each dose of a drug, ratios describing the drug effects over each 5 min period have been submitted to an analysis of variance (ANOVA) with three main factors: cortical region, time (1st, 2nd and 3rd hour with 12 repetitions) and animals. The mean power change for each cortical region was calculated from the number of rats and the time. The confidence intervals were calculated for an α risk less or equal to 0.05. This confidence interval corresponds to the vertical bars in every figure. P<0.05 for each drug effect, regarding an increase or decrease in power, was taken as being significant.
Drugs
The following drugs were used: Amisulpride (Synthélabo), chlorpromazine (Sigma), clozapine (RBI), haloperidol (Sigma), levomepromazine (RPR), MDL 100907 (synthesis of Dr G. Lavielle, IdRS), metoclopramide (Sigma), quetiapine synthesis of Dr J. L. Peglion, IdRS), raclopride (RBI), risperidone (Janssen), sertindole (synthesis of Dr J. L. Peglion, IdRS) and sulpiride (Interchim). For the study of raclopride interactions, raclopride was used with apomorphine (Sigma) and modafinil (gift of Laboratoires Lafon). For the study of clozapine interactions, clozapine was used with apomorphine and modafinil.
Results
Comparison of antipsychotic agents
Two main characteristics can be described in the EEG effects of all antipsychotic agents tested (Figures 1, 2, 3, 4 and 5). First, they induced an increase in power over all the frequency bands, with a peak frequency inherent to each drug. Second, the effects in the prefrontal cortex were more marked than those in the sensorimotor cortex.
Figure 1.
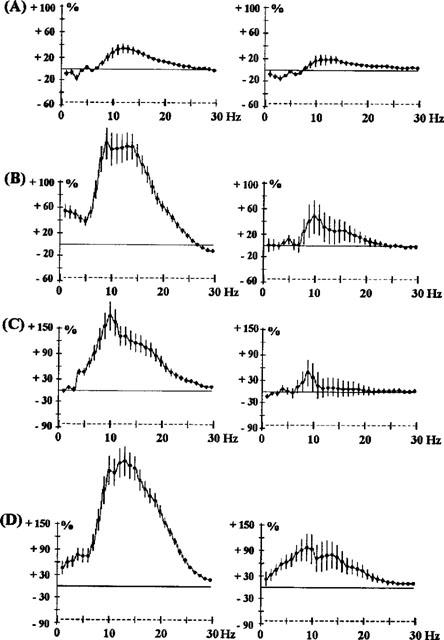
Effects of haloperidol 0.5 mg kg−1 s.c. (A) and 1 mg kg−1 s.c. (B); chlorpromazine 0.5 mg kg−1 i.p. (C) and quetiapine 2.5 mg kg−1 s.c. (D) on EEG spectral power in rats. The abscissa represents the EEG spectral component at each frequency from 1–30 Hz. The ordinate indicates the change in the EEG power spectrum produced by drug administration, as a percentage of the EEG spectrum obtained with vehicle administration 24 h earlier. The horizontal line indicates 0% change. The increases in EEG power may be taken as a synchronization of EEG at the particular frequency and a decrease in power as a desynchronization. Because of local factors (electrode placement) synchronization of the EEG change yields larger percentage changes than desynchronization. Vertical bars for each Hz show 95% confidence intervals. Panels on the left show data from prefrontal cortex, panels on the right show data from sensorimotor cortex.
Figure 2.
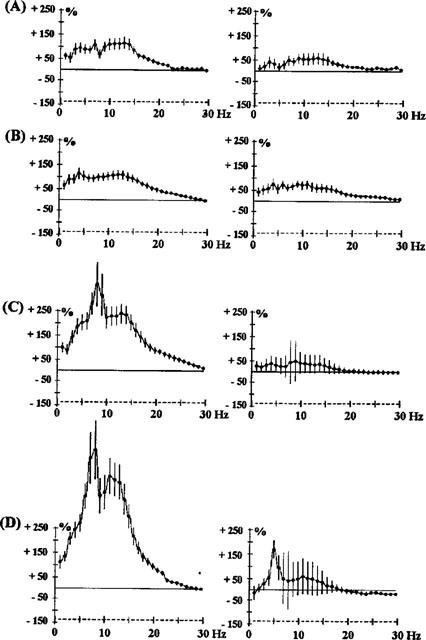
Effects of s.c. clozapine, 0.1 mg kg−1 (A), 0.2 mg kg−1 (B), 0.3 mg kg−1 (C) and 5 mg kg−1 (D), on EEG spectral power in rats. The ordinate represents the percentage change in EEG power. Vertical bars for each Hz show 95% confidence intervals. Panels on the left show data from prefrontal cortex, panels on the right show data from sensorimotor cortex.
Figure 3.
Effects of levomepromazine 1 mg kg−1 i.p. (A), sertindole 2.5 mg kg−1 s.c. (B), risperidone 0.5 mg kg−1 i.p. (C) and 1 mg kg−1 i.p. (D) and MDL100907 0.01 mg kg−1 s.c. (E). The ordinate represents the percentage change in EEG power. Vertical bars for each Hz show 95% confidence intervals. Panels on the left show data from prefrontal cortex, panels on the right show data from sensorimotor cortex.
Figure 4.
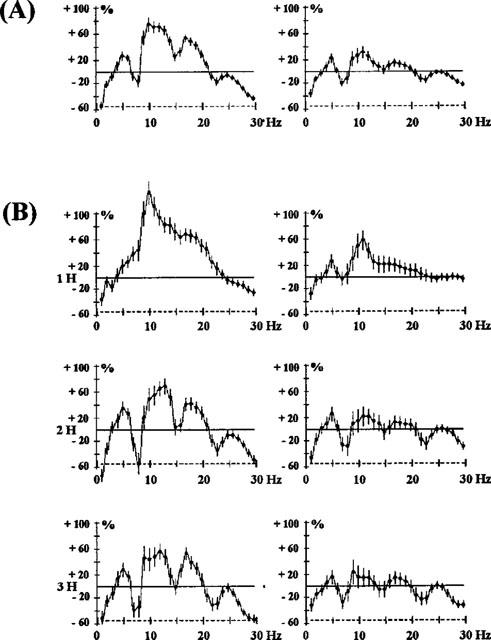
Effects of raclopride 2.5 mg kg−1 s.c., expressed as a mean of the first 3 h after administration (A) and as recorded at 1, 2 and 3 h (B). The ordinate represents the percentage change in EEG power. Vertical bars for each Hz show 95% confidence intervals. Panels on the left show data from prefrontal cortex, panels on the right show data from sensorimotor cortex.
Figure 5.
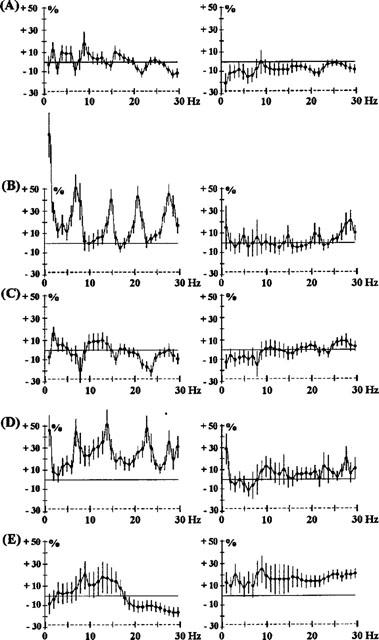
Effects of benzamides: amisulpride 1 mg kg−1 i.p. (A) and 15 mg kg−1 i.p. (B); metoclopramide 2.5 mg kg−1 i.p. (C); sulpiride 7.5 mg kg−1 i.p. (D) and 15 mg kg−1 i.p. (E). The ordinate represents the percentage change in EEG power. Vertical bars for each Hz show 95% confidence intervals. Panels on the left show data from prefrontal cortex, panels on the right show data from sensorimotor cortex.
A more analytical description of the drugs and their effects on the EEG is given in Table 2 which indicates the relative importance of these different EEG changes. Power changes on all five frequency bands were sometimes observed. For most of the drugs studied, EEG synchronization was maximum for the 10–15 Hz frequencies. This was particularly true for haloperidol (0.5 and 1 mg kg−1 Figure 1) and raclopride (2.5 mg kg−1 Figure 4A). However, some drugs caused a sharp synchronization on one frequency band. For example, the 5-HT2A-selective antagonist, MDL100907, caused a synchronization at 2 Hz (Figure 3).
Table 2.
Relative amplitude of main EEG changes induced by different neuroleptics. Comparison of the peak power changes induced by each drug
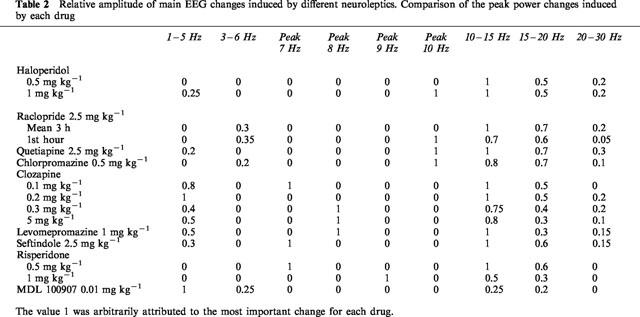
A peak effect was observed at one frequency for most of the drugs: it was at 10 Hz for quetiapine (2.5 mg kg−1 Figure 1) and chlorpromazine (0.5 mg kg−1 Figure 1). For clozapine it shifted from 7–8 Hz from 0.1–0.3 mg kg−1 (Figure 2). The amplitude of synchronization at 15–20 Hz was dependent on the drug. It was particularly low for clozapine (5 mg kg−1 Figure 2), levomepromazine (1 mg kg−1 Figure 3) and risperidone (1 mg kg−1 Figure 3).
The benzamide, raclopride (2.5 mg kg−1 Figure 4A), showed an EEG synchronization from 5–20 Hz, maximum for the frequencies 10–15 Hz, but after 1 h, gaps in this synchronization over the frequency range 7–8 Hz appeared. This suggests that this treatment modifies one EEG wave which is nearly periodic i.e. corresponding to a raw power spectrum (7–8, 14–16 and 21–24 Hz). This aspect of raclopride on the EEG developed 2 and 3 h after administration (Figure 4B). Similarly, the other benzamides tested, sulpiride (7.5 and 15 mg kg−1 i.p.) and amisulpiride (1 and 15 mg kg−1 i.p.) caused EEG changes (Figure 5) showing this characteristic with either a peak synchronization on 7, 14 and 21 Hz or a lack of this effect on these frequencies. Metoclopramide (2.5 mg−1, i.p.), a benzamide which does not pass the blood-brain barrier, showed little activity.
Interactions of clozapine with apomorphine and modafinil
Simultaneous administration of apomorphine (0.1 or 0.25 mg kg−1) with raclopride (2.5 mg kg−1) showed an attenuation of the effects of raclopride in the sensorimotor cortex only (Figure 6). Co-administration of modafinil (62.5, 125 or 250 mg kg−1) and raclopride (2.5 mg kg−1) resulted in an accentuation of EEG synchronization induced in both cortices (Figure 7). This synchronization was of a longer duration (3 h) than with raclopride alone.
Figure 6.
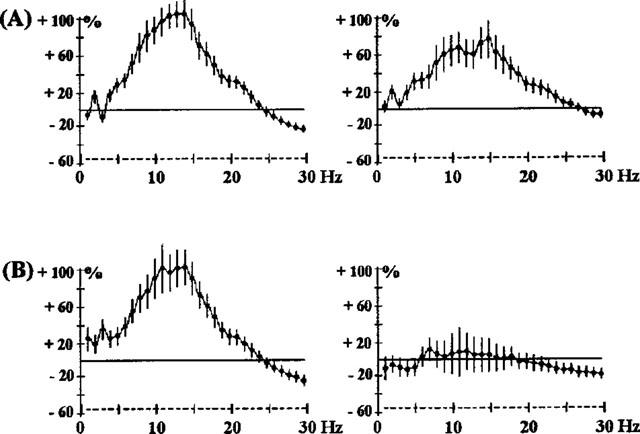
Effects of the co-administration of raclopride 2.5 mg kg−1 s.c. and apomorphine (APO) 0.1 mg kg−1 s.c. (A) or 0.25 mg kg−1 s.c. (B) in rats. The ordinate represents the percentage change in EEG power. Vertical bars for each Hz show 95% confidence intervals, for the 3 h period of observation. The control experiment is shown in Figure 4A. Panels on the left show data from prefrontal cortex, panels on the right show data from sensorimotor cortex.
Figure 7.
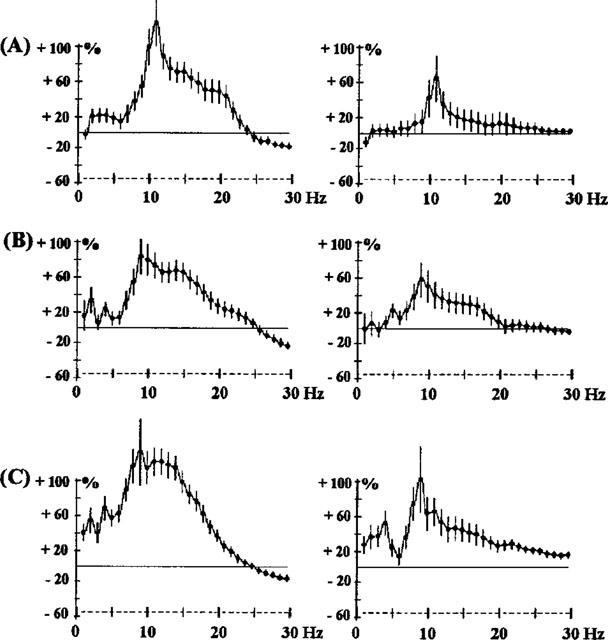
Effects of the co-administration of raclopride (2.5 mg kg−1 s.c.) and modafinil (MOD) 62.5 mg kg−1 i.p. (A), 125 mg kg−1 i.p. (B) or 250 mg kg−1 i.p. (C) in rats. The ordinate represents the percentage change in EEG power. Vertical bars for each Hz show 95% confidence intervals, for the 3 h period of observation. The control experiment is shown in Figure 4A. Panels on the left show data from prefrontal cortex, panels on the right show data from sensorimotor cortex.
Simultaneous administration of apomorphine (0.01, 0.05, 0.1, 0.2 and 0.5 mg kg−1) with the same dose of clozapine (0.2 mg kg−1) resulted in complex interactions (Figure 8). The lowest dose of apomorphine (Figure 8B) provoked a decrease of the effects on the EEG by clozapine. In both cortices, the EEG synchronization associated with 0.2 mg kg−1 of clozapine was significantly reduced by 0.01 mg kg−1 apomorphine, particularly over frequencies 10–30 Hz (Figure 8B). When doses of apomorphine 0.05 mg kg−1 and higher were co-administered with clozapine 0.2 mg kg−1, no significant changes of the synchronization produced by clozapine alone in the prefrontal cortex was observed. In the sensorimotor cortex, increasing the dose of co-administered apomorphine resulted in a decrease of EEG synchronization caused by clozapine alone (Figures 8C–E).
Figure 8.
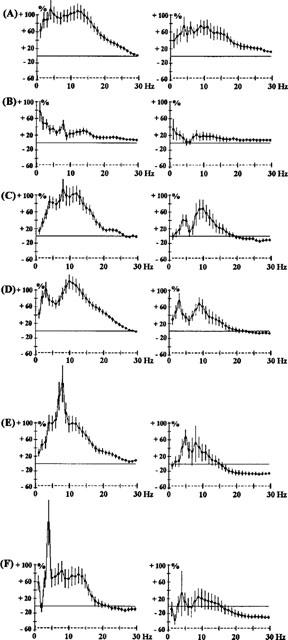
Effects of clozapine (CLZ) 0.2 mg kg−1 s.c. alone (A), effects of the co-administration of clozapine (0.2 mg kg−1) and apomorphine (APO) on 0.01 mg kg−1 s.c. (B), 0.05 mg kg−1 s.c. (C), 0.1 mg kg−1 s.c. (D), 0.2 mg kg−1 s.c. (E) or 0.5 mg kg−1 s.c. (F) in rats. The ordinate represents the percentage change in EEG power. Vertical bars for each Hz show 95% confidence intervals. Panels on the left show data from prefrontal cortex, panels on the right show data from sensorimotor cortex.
When increasing doses of modafinil (62.5, 125 and 250 mg kg−1) were co-administered with clozapine at a fixed dose (0.2 mg kg−1), there was a very significant attenuation of EEG synchronization induced by clozapine in both cortices (Figure 9). Moreover, modafinil 250 mg kg−1 almost completely antagonized the effects of clozapine in both cortices.
Figure 9.
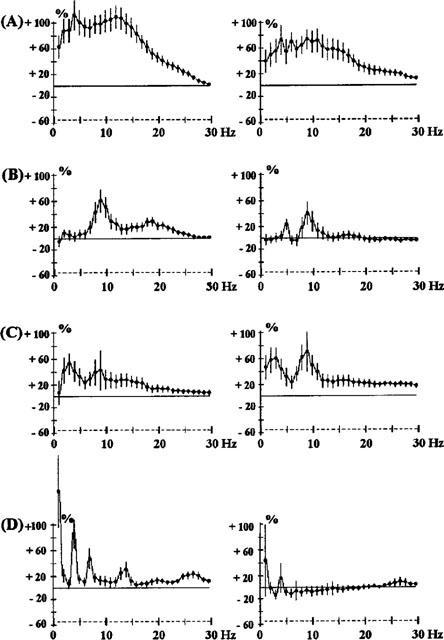
Effects of the co-administration of clozapine (CLZ, A) 0.2 mg kg−1 s.c. and modafinil (MOD) 62.5 mg kg−1 i.p. (B), 125 mg kg−1 i.p. (C) or 250 mg kg−1 i.p. (D) in rats. The ordinate represents the percentage change in EEG power. Vertical bars for each Hz show 95% confidence intervals. Panels on the left show data from prefrontal cortex, panels on the right show data from sensorimotor cortex.
Discussion
The prefrontal cortex has been shown to be critical for cognition and memory with distinct areas being responsible for affective and attentional shifts (see Introduction). In an extensive series of studies, we have shown different effects of antipsychotic agents on dopamine, noradrenaline and 5-hydroxytryptamine release in the prefrontal cortex (Gobert et al., 1998; Millan et al., in preparation).
Thalamic activation of the cortex may be inappropriate in schizophrenia (see Introduction) and the capacity of antipsychotics to synchronize or desynchronize the EEG may be a critical factor for their antipsychotic efficacy, and the mechanism of action will presumably depend on the receptor binding profile for each drug. In this respect, the profiles of EEG spectra are clearly different between the different antipsychotics.
According to the relative affinities at D2, 5HT2 and α1 receptors of these different agents (Table 1), it appeared that: (1) antagonistic effects at D2 receptors (haloperidol and raclopride) were mainly associated with an increase in the 10–15 Hz power band with lesser effects in the 15–20 Hz power band; (2) relatively high affinity at 5HT2 receptors compared with D2 receptors (sertindole and risperidone) is essentially associated with a peak synchronization at 7–10 Hz. However, MDL100907, the most selective 5-HT2 antagonist available, selectively increased low frequency power (2 Hz), which means that mixed 5-HT2/D2 receptor blockade can modify the EEG profile resulting from selective antagonism of either receptor; and (3) the main increase in power after prazosin administration was from 8–10 Hz. This is consistent with the fact that high relative affinity for α1-adrenoceptors as shown by clozapine, levomepromazine and chlorpromazine, is associated with a peak synchronization at frequencies of 8 Hz and higher and a significant increase in power of frequencies 1–5 Hz. Finally, our data are also compatible with a study of receptor occupancy by clozapine, risperidone and haloperidol in the rat (Schotte et al., 1993).
The selective increase in low frequency power (2 Hz), caused by MDL100907, the most selective 5-HT2 antagonist available, was of interest because serotonin has been shown to increase spontaneous excitatory postsynaptic currents induced by glutamate in layer V pyramidal cells of prefrontal cortex (Aghajanian & Marek, 1997; 1999). Excess glutamate stimulation of these cells has been claimed to be one of the causes of the hallucinations induced by 1-2,5,dimethoxy-4-iodophenyl-2-aminopropane (DOI) and to be a contributory factor to the delusions in schizophrenia (Aghajanian & Marek, 1999). Local effects on layer V pyramidal cell firing would be expected to be powerful modulators of the EEG in prefrontal cortex, and thus could explain some changes observed in this report.
As regards the antipsychotic drugs, the benzamide agents produced a distinct EEG profile in the rat, confirming the differences in profile of these drugs compared with classical neuroleptics: differences in evoked EEG profiles have also been observed in man (Saletu et al., 1994). When apomorphine was co-administered with clozapine, there was no significant antagonism of the EEG synchronization compared with those induced by clozapine alone, except at the very lowest dose. When clozapine was associated with a high dose of apomorphine (0.5 mg kg−1) there was a peak synchronization at 4 Hz. This was also observed with the prazosin-apomorphine combination (Sebban et al., 1999), indicating that some of the effects of clozapine on the EEG resembled those of prazosin.
In this respect, in the accompanying study (Sebban et al., 1999), we have shown that a dose-dependent cancellation of EEG changes occurred when an α1-adrenoceptor antagonist (prazosin 0.64 mg kg−1) was co-administered with an agonist of α1-adrenoceptors (cirazoline 0.64, 1.25 or 2.5 mg kg−1). In the present study it was not possible to observe a complete antagonism in the prefrontal cortex when the D2 antagonist, raclopride, was co-administered with apomorphine, which may result from an activation of D1 receptors by apomorphine.
However, a crucial point is the antagonism of the action of clozapine on the EEG by modafinil, but not by apomorphine. Modafinil is a unique agent which is used clinically to increase vigilance and attention for the treatment of narcolepsy (Bastuji & Jouvet, 1988; Billiard et al., 1994; Billiard & Carlander, 1998) and for military operations (Lyons & French, 1991). Modafinil does not bind to α1-adrenoceptors, but its selective effects on vigilance and the EEG are antagonized by prazosin (Mignot et al., 1988; Duteil et al., 1990; Lagarde & Milhaud, 1990; Rambert et al., 1990; Lin et al., 1992; Sebban et al., 1999).
Thus modafinil, which is capable of preventing sleep for several days in clinical practice without rebound and therefore modifies some aspects of attentional processes, is a selective antagonist of the effects of clozapine on the EEG in the prefrontal cortex of the conscious rat. Clozapine has affinity for many receptor subtypes, but has most affinity for α1-adrenoceptors (Table 1). Furthermore, Breier et al. (1994) reported that an increase in circulating noradrenaline was highly correlated with the antipsychotic efficacy of clozapine, implying that postsynaptic α1-adrenoceptor blockade by clozapine treatment occurs at the dose levels which are clinically effective. α1-Adrenoceptor blockade prevents locomotor hyperactivity induced by subcortical injection of amphetamine in rats (Blanc et al., 1994). Thus, the effects of clozapine on EEG synchronization in the prefrontal cortex, involve an α1-adrenoceptor-based mechanism, although the precise α1-adrenoceptor subtype is unknown because modafinil does not bind to the α1-adrenoceptors currently cloned (Pieribone et al., 1994). Nevertheless, centrally-acting agonists at α1-adrenoceptors, such as SDZ NVI-085 (Renaud et al., 1991), have similar effects on sleep as modafinil (Saletu et al., 1989) and thalamocortical activation is directly modulated by noradrenergic transmission (Gaillard, 1990; Funke et al., 1993). Furthermore, activation of α1-adrenoceptors, like activation of 5-HT2 receptors, has been shown to increase spontaneous excitatory postsynaptic curents induced by glutamate in layer V pyramidal cells of prefrontal cortex (Marek & Aghajanian, 1999).
In contrast, the effects of the antipsychotic, raclopride, a selective D2 antagonist, were resistant to modafinil. Modafinil may therefore be critically involved with thalamocortical activation pathways promoting vigilance and attention, and these pathways may be pathologically changed during schizophrenia (see Introduction). It is also clear that noradrenergic and dopaminergic systems are highly interactive in the prefrontal cortex (Tassin et al., 1992). Schizophrenia has been likened to a state of hyperattention processing by Mar et al. (1996), but with some attention deficits (O'Leary et al., 1996), reinforcing the idea that the thalamocortical circuitry mediating selective attention is a prime target for some antipsychotic drugs, and that these pathways are the same as those thought to be involved in aspects of cognitive processes (Posner, 1997; Wharton & Graffman, 1998; Klimesch, 1999; Klimesch et al., 1999).
Acknowledgments
We thank Florence Lacroix for expert secretarial assistance.
Abbreviations
- EEG
electroencephalogram
References
- AGHAJANIAN G.K., MAREK G.J. Serotonin induces excitatory post-synaptic potentials in apical dendrites of neocortical pyramidal cells. Neuropharmacology. 1997;36:589–599. doi: 10.1016/s0028-3908(97)00051-8. [DOI] [PubMed] [Google Scholar]
- AGHAJANIAN G.K., MAREK G.J. Serotonin, via 5-HT2A receptors, increases EPSCs in layer V pyramidal cells of prefrontal cortex by an asynchronous mode of glutamate release. Brain Res. 1999;825:161–171. doi: 10.1016/s0006-8993(99)01224-x. [DOI] [PubMed] [Google Scholar]
- ANDREASEN N.C. The mechanisms of schizophrenia. Curr. Opin. Neurobiol. 1994;4:245–251. doi: 10.1016/0959-4388(94)90080-9. [DOI] [PubMed] [Google Scholar]
- ANDREASEN N.C., REZAI K., ALLIGER R., SWAYZE V.W., II, FLAUM M., KIRCHNER P., COHEN G., O'LEARY D.S. Hypofrontality in neuropleptic-naive patients and in patients with chronic schizophrenia. Arch. Gen. Psych. 1992;49:943–948. doi: 10.1001/archpsyc.1992.01820120031006. [DOI] [PubMed] [Google Scholar]
- BASTUJI H.T., JOUVET M. Successful treatment of idiopathic insomnia and narcolepsy with modafinil. Progr. Neuropsychopharmacol. Biol. Psychiat. 1988;12:695–700. doi: 10.1016/0278-5846(88)90014-0. [DOI] [PubMed] [Google Scholar]
- BILLIARD M., BESSET A., MONTPLAISIR J., LAFFONT F., GOOLDENBERG F., WEIL J.S., LUBIN S. Modafinil: a double blind multicentric study. Sleep. 1994;17:S107–S112. doi: 10.1093/sleep/17.suppl_8.s107. [DOI] [PubMed] [Google Scholar]
- BILLIARD M., CARLANDER B. Troubles de l'éveil: première partie (troubles primaires de l'éveil) Rev. Neurol. 1998;154:111–129. [PubMed] [Google Scholar]
- BLANC G., TROVERO F., VEZINA P., HERVE D., GODEHEU A.M., GLOWINSKI J., TASSIN J.P. Blockade of prefronto-cortical α1-adrenergic receptors prevents locomotor hyperactivity induced by subcortical D-amphetamine injection. Eur. J. Neurosci. 1994;6:293–298. doi: 10.1111/j.1460-9568.1994.tb00272.x. [DOI] [PubMed] [Google Scholar]
- BREIER A., BUCHANAN R.W., WALTRIP R.W., II, LISTWAK S., HOLMES C., GOLDSTEIN D.S. The effect of clozapine on plasma norepinephrine: relationship to clinical efficacy. Neuropsychopharmacology. 1994;10:1–7. doi: 10.1038/npp.1994.1. [DOI] [PubMed] [Google Scholar]
- DUTEIL J., RAMBERT F.A., PESSONNIER J., HERMANT J.F., GOMBERT R., ASSOUS E. Central α1 adrenergic stimulation in relation to behaviour stimulating effect of modafinil; studies with experimental animals. Eur. J. Pharmacol. 1990;180:49–58. doi: 10.1016/0014-2999(90)90591-s. [DOI] [PubMed] [Google Scholar]
- EGAN M.F., DUNCAN C.C., SUDDATH R.L., KIRCH D.G., MIRSKY A.F., WYATT R.J. Event-related potential abnormalities correlate with structural brain alterations ansc linial features in patients with chronic schizophrenia. Schizoph. Res. 1994;11:259–271. doi: 10.1016/0920-9964(94)90020-5. [DOI] [PubMed] [Google Scholar]
- FUNKE K., PAPE H.C., EYSEL U.T. Noradrenergic modulation of retinogeniculate transmission in the cat. J. Physiol. 1993;463:169–191. doi: 10.1113/jphysiol.1993.sp019590. [DOI] [PMC free article] [PubMed] [Google Scholar]
- GAILLARD J.M.Neurotransmitters and sleep pharmacology Handbook of sleep disorders 1990Marcel Dekker: New York; 55–76.In Thorpy M.J. (ed.) [Google Scholar]
- GEVINS A., CUTILLO B., SMITH M.E. Regional modulation of high resolution evoked potentials during verbal and non-verbal matching tasks. Electroenceph. Clin. Neurophysiol. 1995;94:129–147. doi: 10.1016/0013-4694(94)00261-i. [DOI] [PubMed] [Google Scholar]
- GOBERT A., RIVET J.M., AUDINOT V., NEWMAN-TANCREDI A., CISTARELLI L., MILLAN M.J. Simultaneous quantification of serotonin, dopamine and noradrenaline levels in single frontal cortex dialyses of freely-moving rats reveals a complex pattern of reciprocal auto- and heteroreceptor-mediated control of release. Neuroscience. 1998;84:413–429. doi: 10.1016/s0306-4522(97)00565-4. [DOI] [PubMed] [Google Scholar]
- HERMANN W.M., SCHARER E., WENDT G., DELINA-STULA A. Pharmaco-EEG profile of levoprotiline: second example to discuss the predictive value of pharmaco-electroencephalography in early human pharmacological evaluations of psychoactive drugs. Pharmacopsychiatry. 1991;24:214–224. doi: 10.1055/s-2007-1014470. [DOI] [PubMed] [Google Scholar]
- JACOB H., BECKMANN H. Circumscribed malformation and nerve cell alterations in the entorhinal cortex of schizophrenics. J. Neural. Trans. 1994;98:83–106. doi: 10.1007/BF01277013. [DOI] [PubMed] [Google Scholar]
- KLIMESCH W. EEG alpha and theta oscillations reflect cognitive and memory performance: a review and analysis. Brain Res. Rev. 1999;29:169–195. doi: 10.1016/s0165-0173(98)00056-3. [DOI] [PubMed] [Google Scholar]
- KLIMESCH W., DOPPELMAYR M., SCHWAIGER J., AUINGER P., WINKLER T. ‘Paradoxical' alpha synchronisation in a memory task. Cognitive Brain Res. 1999;7:493–501. doi: 10.1016/s0926-6410(98)00056-1. [DOI] [PubMed] [Google Scholar]
- LAGARDE D., MILHAUD C. Electroencephalographic effects of modafinil, an α1 adrenergic psychostimulant, on the sleep of rhesus monkeys. Sleep. 1990;13:441–448. doi: 10.1093/sleep/13.5.441. [DOI] [PubMed] [Google Scholar]
- LIN J.S., ROUSSEL B., AKAOKA H., FORT P., DEBILLY G., JOUVET M. Role of catecholamines in the modafinil and amphetamine induced wakefulness, a comparative pharmacological study in the cat. Brain Res. 1992;591:319–326. doi: 10.1016/0006-8993(92)91713-o. [DOI] [PubMed] [Google Scholar]
- LYONS T.J., FRENCH J. Modafinil: the unique properties of a new stimulant. Aviat. Space Environ. Med. 1991;62:432–435. [PubMed] [Google Scholar]
- MAGISTRETTI P.J., PELLERIN L., MARTIN J.L.Brain energy metabolism: an integrated cellular perspective Psychopharmacology, the Fourth Generation of Progress 1995Raven Press: New York; 657–670.In Bloom, F.E. & Kupfer, D.J. (eds.) [Google Scholar]
- MAR C.M., SMITH D.A., SARTER M. Behavioural vigilance in schizophrenia; evidence for hyperattentional processing. Br. J. Psychiatr. 1996;169:781–789. doi: 10.1192/bjp.169.6.781. [DOI] [PubMed] [Google Scholar]
- MAREK G.J., AGHAJANIAN G.K.5-HT2A receptor or α1-adrenoceptor activation induces spontaneous excitatory postsynaptic currents in layer V pyramidal cells of the medial prefrontal cortex Eur. J. Pharmacol. 1999(in press) [DOI] [PubMed]
- MATSUURA M., YOSHINO M., OHTA K., ONDA H., NAKAJIMA K., KOJIMA T. Clinical significance of diffuse delta EEG activity in chronic schizophrenia. Clin. Electroencephalogr. 1994;25:115–121. doi: 10.1177/155005949402500309. [DOI] [PubMed] [Google Scholar]
- MCCORMICK D.A. Cellular mechanisms underlying cholinergic and noradrenergic modulation of neuronal firing mode in the cat and guinea pig dorsal lateral geniculate nucleus. J. Neurosci. 1992;12:278–289. doi: 10.1523/JNEUROSCI.12-01-00278.1992. [DOI] [PMC free article] [PubMed] [Google Scholar]
- MIGNOT E., GUILLEMINAULT C., BOWERSOX S., RAPPAPORT A., DEMENT W.C. Effect of alpha-1 adrenoreceptor blockade with prazosin in canine narcolepsy. Brain Res. 1988;444:184–188. doi: 10.1016/0006-8993(88)90927-4. [DOI] [PubMed] [Google Scholar]
- MILLAN M.J., SCHREIBER R., DEKEYNE A., RIVET J.M., BERVOETS K., MAVRIDIS M., SEBBAN C., MAUREL-REMY S., NEWMAN-TANCREDI A., SPEDDING M., MULLER O., LAVIELLE G., BROCCO M. S 16924 ((+)-2-{1-[2-(2,3-dihydro-benzo[1,4] dioxin-5-yloxy)-ethyl]-pyrrolidin-3yl}-1-(4-fluoro-phenyl)-ethanone), a novel, potential antipsychotic with marked serotonin (5-HT)1A agonist properties: functional profile in comparison to clozapine and haloperidol. J. Pharmacol. Exp. Ther. 1998;286:1356–1373. [PubMed] [Google Scholar]
- MOLNAR Z., BLAKEMORE C. How do thalamic neurones find their way to the cortex. Trends Neurosci. 1995;18:389–397. doi: 10.1016/0166-2236(95)93935-q. [DOI] [PubMed] [Google Scholar]
- O'LEARY D.S., ANDREASEN N.C., HURTIG R.R., KESLER M.L., ROGERS M., ARNDT S., CIZADLO T., WATKINS G.L., BOLES PONTO L.L., KIRCHNER P.T., HICHWA R.D. Auditory attentional deficits in patients with schizophrenia; a positron emission tomography study. Arch. Gen. Psychiatr. 1996;53:633–641. doi: 10.1001/archpsyc.1996.01830070083013. [DOI] [PubMed] [Google Scholar]
- PIERIBONE V.A., NICHOLAS A.P., DAGERLIND A., HOKFELT T. Distribution of α1 adrenoceptors in rat brain revealed by in situ hybridization experiments utilizing subtype-specific probes. J. Neurosci. 1994;14:4252–4268. doi: 10.1523/JNEUROSCI.14-07-04252.1994. [DOI] [PMC free article] [PubMed] [Google Scholar]
- POSNER M.I. Neuroimaging of cognitive processes. Cognit. Psychol. 1997;33:2–4. [Google Scholar]
- RAMBERT F.A., PESSONNIER J., DUTEIL J. Modafinil-, amphetamine- and methylphenidate-induced hyperactivities in mice involve different mechanisms. Eur. J. Pharmacol. 1990;183:455–456. [Google Scholar]
- RENAUD A., NISHINO S., DEMENT W.C., GUILLEMINAULT C., MIGNOT E. Effects of SDZ NVI-085, a putative subtype-selective α1-agonist, on canine cataplexy, a disorder of rapid eye movement sleep. Eur. J. Pharmacol. 1991;205:11–16. doi: 10.1016/0014-2999(91)90763-g. [DOI] [PubMed] [Google Scholar]
- RUGG M.D., MARK R.E., WALLA P., SCHLOERSCHEIDT A.M. Dissociation of the neural correlates of implicit and explicit memory. Nature. 1998;392:595–598. doi: 10.1038/33396. [DOI] [PubMed] [Google Scholar]
- SALETU B., FREY R., KRUPKA M., ANDERER P., GRUNBERGER J., BARBANOJ M.J. Differential effects of a new central adrenergic agonist – modafinil – and D-amphetamine on sleep and early morning behaviour in young healthy volunteers. Int. J. Clin. Pharmacol. Res. 1989;9:183–195. [PubMed] [Google Scholar]
- SALETU B., KUFFERLE B., GRUNBERGER J., FOLDES P., TOPITZ A., ANDERER P. Clinical, EEG mapping and psychometric studies in negative schizophrenia: comparative trials with amisulpride and fluphenazine. Neuropsychobiology. 1994;29:125–135. doi: 10.1159/000119075. [DOI] [PubMed] [Google Scholar]
- SARNTHEIN J., PETSCHE H., RAPPELSBERGER P., SHAW G.L., VON STEIN A. Synchronization between prefrontal and posterior association cortex during human working memory. Proc. Natl. Acad. Sci. U.S.A. 1998;95:7092–7096. doi: 10.1073/pnas.95.12.7092. [DOI] [PMC free article] [PubMed] [Google Scholar]
- SCHOTTE A., JANSSEN P.F.M., MEGENS A.A.H.P., LEYSEN J.E. Occupancy of central neurotransmitter receptors by risperidone, clozapine and haloperidol, measured ex vivo by quantitative autoradiography. Brain Res. 1993;631:191–202. doi: 10.1016/0006-8993(93)91535-z. [DOI] [PubMed] [Google Scholar]
- SEBBAN C., TESOLIN B., SHVALOFF A., LE ROCH K., BERTHAUX P. Age-related variation of EEG responses to clonidine, prazosin and yohimbine in rats. Med. Biol. 1987;65:255–260. [PubMed] [Google Scholar]
- SEBBAN C., ZHANG X.Q., TESOLIN-DECROS B., MILLAN M.J., SPEDDING M.Changes in EEG spectral power in the prefrontal cortex of conscious rats elicited by drugs interacting with dopaminergic and noradrenergic transmission Br. J. Pharmacol. 1999(in press) [DOI] [PMC free article] [PubMed]
- SHVALOFF A., TESOLIN B., SEBBAN C. Effects of apomorphine in quantified electroencephalography in the frontal cortex: changes with dose and time. Neuropharmacology. 1988;27:1313–1317. doi: 10.1016/0028-3908(88)90036-6. [DOI] [PubMed] [Google Scholar]
- STERIADE M., AMZICA F., NUNEZ A. Cholinergic and noradrenergic modulation of the slow (≈0.3 Hz) oscillation in neocortical cells. J. Neurophysiol. 1993a;70:1385–1400. doi: 10.1152/jn.1993.70.4.1385. [DOI] [PubMed] [Google Scholar]
- STERIADE M., CONTRERAS D. Relations between cortical and thalamic cellular events during transition from sleep patterns to paroxysmal activity. J. Neurosci. 1995;15:623–642. doi: 10.1523/JNEUROSCI.15-01-00623.1995. [DOI] [PMC free article] [PubMed] [Google Scholar]
- STERIADE M., DATTA S., PARE D., OAKSON G., DOSSI R.C. Neuronal activities in brain-stem cholinergic nuclei related to tonic activation processes in thalamocortical systems. J. Neurosci. 1990a;10:2541–2559. doi: 10.1523/JNEUROSCI.10-08-02541.1990. [DOI] [PMC free article] [PubMed] [Google Scholar]
- STERIADE M., DOSSI R.C., PARE D., OAKSON G. Fast oscillation (20–40 Hz) in thalamocortical system and their potentiation by mesopontine cholinergic nuclei in the cat. Neurobiology. 1991;88:4396–4400. doi: 10.1073/pnas.88.10.4396. [DOI] [PMC free article] [PubMed] [Google Scholar]
- STERIADE M., GLOUR P., LLINAS R.R., SILVA F.H.L., MESULAM M.M. Basic mechanism of cerebral rhythmic activities. Electroenephalogr. Clin. Neurophysiol. 1990b;76:481–508. doi: 10.1016/0013-4694(90)90001-z. [DOI] [PubMed] [Google Scholar]
- STERIADE M., MCCORMICK D.A., SEJNOWSKI T.T. Thalamocortical oscillations in the sleeping and arousal brain. Science. 1993b;262:679–685. doi: 10.1126/science.8235588. [DOI] [PubMed] [Google Scholar]
- STERIADE M., NUNEZ A., AMZICA F. Intracellular analysis of relations between the slow (<1 Hz) neocortical oscillation and other sleep rhythms of the electroencephalogram. J. Neurosci. 1993c;13:3266–3283. doi: 10.1523/JNEUROSCI.13-08-03266.1993. [DOI] [PMC free article] [PubMed] [Google Scholar]
- TASSIN J.P., TROVERO F., HERVE D., BLANC G., GLOWINSKI J. Biochemical and behavioural consequences of interactions between dopaminergic and noradrenergic systems in rat prefrontal cortex. Neurochem. Int. 1992;20:225S–230S. doi: 10.1016/0197-0186(92)90243-k. [DOI] [PubMed] [Google Scholar]
- VOLZ H.P., MACKERT A., FRICK K., BUCKER U. Difference in semantic information processing in schizophrenics. Pharmacopsychiatry. 1994;27:59–62. doi: 10.1055/s-2007-1014277. [DOI] [PubMed] [Google Scholar]
- WEINBERGER D.R. Implications of normal brain development for the pathogenesis of schizophrenia. Arch. Gen. Psychiatry. 1987;44:660–669. doi: 10.1001/archpsyc.1987.01800190080012. [DOI] [PubMed] [Google Scholar]
- WEINBERGER D.R. On the plausibility of ‘the neurodevelopment hypothesis' of schizophrenia. Neuropsychopharmacology. 1996;14:1S–11S. doi: 10.1016/0893-133X(95)00199-N. [DOI] [PubMed] [Google Scholar]
- WHARTON C.M., GRAFMAN J. Deductive reasoning and the brain. Trends Cognit. Sci. 1998;2:54–59. doi: 10.1016/s1364-6613(98)01122-x. [DOI] [PubMed] [Google Scholar]
- YAMAMOTO J. Cortical and hippocampal EEG power spectra in animal models of schizophrenia produced with methamphetamine, cocaine, and phencyclidine. Psychopharmacology. 1997;131:379–387. doi: 10.1007/s002130050306. [DOI] [PubMed] [Google Scholar]


