

Abstract
Primary porcine hepatocytes and enterocytes were isolated and cultured in Williams' E medium for up to 10 days to investigate potential organ differences in the metabolism of the immunosuppressive compound tacrolimus (FK 506) and of two investigational drugs (KC11346 and KC12291). Using LC-MS (FK506) and HPLC-FL (KC 11346/12291) a number of metabolites with identical mass and/or identical retention time could be detected.
In the case of tacrolimus hepatocytes and enterocytes produced the same spectrum of metabolites, e.g. bisdemethyl-tacrolimus, demethyl-tacrolimus, demethyl-hydroxy-tacrolimus and hydroxy-tacrolimus, albeit at varying intensities.
Treatment of enterocyte cultures with dexamethasone increased the overall metabolite formation very significantly (up to 36 fold).
The metabolism of tacrolimus was also studied with preparations of insect cells, that express specifically high levels of individual human cytochrome P450 (CYP) isoenzymes. All metabolites could be generated with microsomal preparations specifically expressing CYP3A4, but hydroxy-tacrolimus was exclusively produced by CYP3A5.
In the case of the investigational drugs KC 11346 and KC 12291 only three metabolites were formed by cultured enterocytes whereas hepatocytes produced 10 and 20 metabolites, respectively.
When assessed at the protein level CYP1A and CYP3A were expressed in cultures of porcine enterocytes for up to 10 days but porcine hepatocytes expressed additionally CYP2C9/10.
In conclusion, primary enterocytes and hepatocytes can be successfully cultured for several days while maintaining mono-oxygenase activity and may therefore be used as a tool for studying intestinal and hepatic metabolism.
Keywords: Porcine enterocytes, porcine hepatocytes, isolation and cultivation, CYP mono-oxygenases, immunosuppressive FK 506, metabolism, enzyme induction, dexamethasone, species comparison
Introduction
The immunosuppressive compound tacrolimus (FK506) is subjected to large variations in bioavailability. Drug monitoring is therefore essental for patients receiving immunosuppressive therapy following organ transplantation. One of the reasons for this variability is thought to be intestinal metabolism. The aim of this study was therefore to investigate the biotransformation of tacrolimus in the intestine and to determine potential organ differences (liver versus intestine).
The development of adult primary small intestinal enterocyte cultures for the prediction of intestinal metabolism has been hampered partly due to difficulties in the isolation and subsequent culture procedures. Indeed, it appears almost impossible to develop long term cultures, as differentiated enterocytes have a short life span in vivo of approximately 5 days in humans (Schmidt & Thews, 1995). On the other hand the experimental techniques to culture rat and human hepatocytes are well established and considerable characterization of these cell culture systems has now been achieved. Hepatocyte cultures are also used for enzyme induction, enzyme inhibition and drug-drug interaction studies. A metabolically competent primary intestinal cell culture model could offer considerable advantages in drug development, if enterocytes, as well as hepatocytes, would be used to study the biotransformation of novel compounds in vitro. Comparison of the results obtained with both cell culture models could provide useful information on the relative contribution of the intestine and the liver in drug metabolism and metabolically induced toxicity.
Adult primary rat intestinal cells have been used for in vitro experiments but the viability and metabolic competence was limited to or studied at a very short period after the isolation (Grafstrom et al., 1979; Säfsten & Flemström, 1993). For instance, Hahn et al., (1987) could demonstrate that primary cell colonies isolated from newborn rats were viable for up to 48 h when cultured on fibronectin and up to 4 days when an intestinal biomatrix was used but the drug metabolism capacity of the enterocyte culture was not studied.
Alternatively, immortalized intestinal cell lines have been used for metabolism studies, but results obtained with such cell cultures are not predictive for in vivo small intestinal metabolism as most cell lines are metabolically incompetent or do not express the full panel of drug metabolizing enzymes (Carriere et al., 1994). Although studies are carried out with a variety of systems including intestinal microsomes (Hartmann et al., 1983; Kolars et al., 1992; Lampen et al., 1995; van de Wiel et al., 1992) or explant organ culture (Ince et al., 1991; Kolars et al., 1994), these models are of limited value as microsomal preparations are mainly restricted to phase I drug oxidation reactions and are therefore not suitable to study phase II metabolism (conjugation reactions). Furthermore, enzyme activities in microsomal preparations may be different from the activities found in intact cells (Wortelboer et al., 1990).
Therefore the approach of this study was to isolate and characterize primary intestinal enterocytes and to compare their metabolic capacity with that of cultured hepatocytes. Tacrolimus, a drug given to liver transplant patients was used as a CYP3A substrate (Sattler et al., 1992). Its varying oral bioavailability in patients led to the assumption that intestinal metabolism could account for first pass intestinal biotransformation of this drug. A better understanding of the intestinal biotransformation would therefore aid an understanding of the pharmacokinetics of tacrolimus and by implication patient treatment using a blood monitoring approach during pharmacotherapy.
Methods
Primary porcine enterocyte isolation techniques
Immediately after slaughtering small intestinal tissue was obtained from German landrace pigs weighing 150±20 kg. Thirty centimetres of duodenum were cut out and placed in a precooled beaker containing phosphate buffered saline (PBS). The specimen was transported on ice to the laboratory within 20–30 min. After removal of remnants of fat and pancreatic tissue the specimen was flushed with ice-cold sterile PBS. The intestinal tube was closed at one end and filled with 200 ml of prewarmed (37°C) buffer I (Table 1). Then the other end was closed and the entire specimen was submerged into sterile PBS at 37°C and was gently kneaded for 10 min. Thereafter buffer 1 was discarded and the intestinal tube flushed with PBS at 37°C. In the following, 200 ml of collagenase containing buffer 2 (Table 1) was filled into the intestinal tube and left inside for further 15 min. Kneading of the specimen aided the liberation of the enterocytes. The cells were collected in a precooled beaker (4°C) by shaking the specimen and extensive washing with washing buffer (Table 1). Remaining cell clumps were separated by aspiration using a 10 ml pipette. The cell suspension was filtered through a metal net with a pore size of 500 μm and centrifuged at 900 g at 4°C for 5 min. After removal of the supernatant the pellet was resuspended in PBS and washed three times. The resulting cell pellet was resuspended in Williams E without phenol (Cytogen, Berlin, Germany), supplemented with 5% (v v−1) fotal bovine serum, prednisolone 9.7, 5 μmol l, glucagon 0.014 μg/ml (Novo, Mainz, Germany), insulin 0.16 u ml−1 (Hoechst, Frankfurt, Germany), penicillin 200 u ml−1 and streptomycin 200 μg/ml (Biochrom, Berlin, Germany).
Table 1.
Comparison of isolation protocols for porcine small intestinal enterocytes
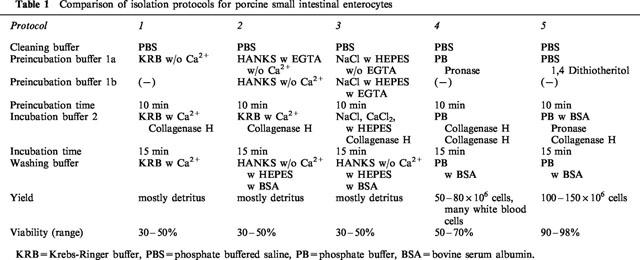
In the following a summary of the various buffer systems is given (see also Table 1). All buffers were saturated with 95% oxygen and 5% CO2 at 37°C.
Protocol 1 (KRB)
Buffer 1 consisted of 200 ml Ca2+ free Krebs-Ringer buffer (KRB) for 10 min followed by perfusion of 200 ml KRB (buffer 2) containing 21.5 U collagenase type IV (Biochrom, Berlin, Germany) and 9 ml of 11 mol l−1 CaCl2. Washing buffer consisted of KRB.
Protocol 2 (Hanks)
This protocol required two subtypes of buffer 1 (1a and 1b) in order to improve cell yield. Buffer 1a consisted of Hanks buffer substituted with EGTA (ethyleneglycol-bis (β-amonoethyl ether)-tetraacetic acid, 0.5 mmol l−1) without Ca2+ and Mg2+. This was followed by a second buffer 1b consisting of Hanks free of EGTA. For cellular isolation Hanks buffer was substituted with collagenase type IV and CaCl2 (4 mmol l−1).
Protocol 3 (NaCl+HEPES+EGTA)
For the same reason as given in protocol 2, two subtypes of buffer 1 (1a and 1b) were used, which are essentially identical, but only the first of which (buffer 1a) contained EGTA. Incubation buffer 1a consisted of 0.14 mol l−1 NaCl, 8 mmol l−1 KCl, 0.01 mol l−1 HEPES (N-2-hydroxyethyl piperazine-N-2-ethanesulphonic acid) and 0.49 mmol l−1 EGTA. Incubation was continued using the same buffer, but without EGTA (buffer 1b). Collagenase digestion was performed using an incubation buffer 2 with 0.067 mol l−1 NaCl, 6.7 mmol l−1 KCl, 0.01 mol l−1 HEPES and 4.7 mmol l−1 CaCl2·2H2O. Washing buffer consisted of Hanks-buffered salt without calcium and magnesium, 0.01 mol l−1 HEPES, 0.05% (w v−1) bovine serum albumin.
Protocol 4 (phosphate buffer+pronase)
This protocol is an adaptation of a previously reported method for the isolation of human gastric cells (Wagner et al., 1994). Incubation buffer 1 consisted of a phosphate buffer (PB), as described below, with the addition of 100 mg pronase. Incubation buffer 2 contained 0.05% collagenase A (Boehringer Mannheim, Type H), 1% albumin. Washing buffer consisted of PB, with 1% bovine albumin (Sigma, Munich, Germany). PB was composed of 0.5 mmol l−1 NaH2PO4+H2O, 1 mol l−1 Na2HPO4+2H2O, 70 mmol l−1 NaCl, 5 mmol l−1 KCl and 20 mmol l−1 NaHCO3, 50 mmol l−1 HEPES (Sigma), 0.5 mmol l−1 CaCl2+2H2O, 0.75 mmol l−1 MgCl2+6 H2O, 11 mmol l−1 glucose (Merck, Darmstadt, Germany) and 0.5 g bovine albumin (Serva, Frankfurt, Germany).
Protocol 5 (PBS+DTT+phosphate buffer)
Incubation buffer 1 consisted of 200 ml PBS with 0.05% (w v)−1 1,4-dithiothreitol (DTT, Bio-Mol), incubation buffer 2 was 200 ml PB, 0.05 % (w v)−1 Pronase (Sigma), 0.075% (w v)−1 Collagenase (Boehringer Mannheim, Type H) and 0.2 % (w v)−1 albumin. Washing buffer 3 consisted of PB.
Cell culture of primary porcine enterocytes
Cells were seeded on polystyrene Petri dishes. Viability was assessed by the trypan blue exclusion of cells at 0, 1, 2, 4, 24, 48 and 72 h and at 7 and 10 days in culture. Approximately 2×10⁶ cells were seeded in Petri dishes with a diameter of 6 cm.
Staining for marker proteins of enterocytes
Alkaline phosphatase was used as a marker for intestinal cells and staining was done with freshly isolated cells (day 0) and with cells from day 1, 3, 7 and 10 in culture. For this purpose cells were aspirated from the dishes and centrifuged onto cover slips at 1000×g for 30 s (cytospins). Staining was performed using 2 mg naphthol-AS-MX-phosphate (Sigma), 200 μl N,N-dimethylformamide (DMF, Merck, Darmstadt, Germany), 9.8 ml 0.1 m Tris HCl-buffer pH 8.2, 10 μl 1 mol l−1 levamisole (Sigma) and 10 mg fast-red salt (Sigma). Naphthol-AS-MX-phosphate was dissolved in DMF and mixed with Tris HCl to a total volume of 10 ml. Thereafter 10 μl levamisole was added. Fast-red was dissolved in naphthol-Tris HCl immediately before use.
Tacrolimus biotransformation studies with porcine enterocytes
Four hours following seeding the incubation experiments (n=3) were started by addition of 1.2 3.7 and 7.5 μmol l−1 of tacrolimus. Incubations were terminated 2 h later and the cell culture supernatants (2 ml) were stored at −20°C until further analysis. The kinetics of tacrolimus metabolism in enterocytes were also studied at a substrate concentration of 3.7 μmol l−1 tacrolimus at 0, 1, 2, 4 and 24 h. For each time point at least two dishes were used and the experiments were repeated twice. Controls consisted of two dishes not exposed to tacrolimus.
Induction experiments with dexamethasone
Primary enterocyte cultures were treated with 50 μmol l−1 dexamethasone (Sigma). Forty-eight hours later cells were incubated with 3.7 μmol l−1 tacrolimus for 2 h. Controls consisted of dishes not previously exposed to dexamethasone. Experiments were repeated twice (e.g. from two different isolations). The metabolism experiments were stopped by removal of the cell culture supernatant (2 ml) and subsequent storage at −20°C. Tacrolimus and its metabolites were analysed using a LC/particle beam MS method as detailed in this report.
Isolation of primary porcine hepatocytes
Porcine hepatocytes were isolated following in situ perfusion of the liver with KRB (Krebs Ringer buffer) at 4°C. The liver was dissected into pieces immediately after removal. Single liver lobes were transferred into the laboratory in ice cold KRB. Blood vessels visible on the cut surface were cannulated and the liver specimen was perfused with 200 ml buffer 1 containing 8.3 g l−1 NaCl, 0.5 g l−1 KCl, 2.4 g l−1 HEPES and 0.19 g l−1 EGTA at pH 7.4 and 37°C. This was followed by perfusion with 200 ml of buffer 2 at pH 7.4 and 37°C. Buffer 2 consisted of 8.3 g l−1 NaCl, 0.5 g l−1 KCl, and 2.4 g l−1 HEPES. Thereafter collagenase perfusion was performed with 200 ml of buffer 3 containing 100 μg collagenase type IV, 3.9 g l−1 NaCl, 0.5 g l−1 KCl, 2.4 g l−1 HEPES and 0.7 g l−1 CaCl2×2H2O at 37°C. The collagenase perfusate was recirculated. Flow rates ranged between 20–50 ml according to the size of the specimen. Following perfusion, the liver capsule was carefully removed and the dissolved cells were liberated by gentle shaking of the liver specimen in ice cold buffer 4. Buffer 4 contained 9.91 g l−1 Hanks buffered salt without calcium and magnesium, 2.4 g l−1 HEPES and 2.0 g l−1 bovine serum albumin. The resulting cell suspension was filtered through a nylon mesh with 100 μm pore size and washed three times with buffer 4 at 4°C. Viability of the hepatocytes ranged between 90 and 99% as assessed by trypan blue exclusion. On average, 3×10⁹ cells were obtained from one isolation procedure.
Cell culture of primary porcine hepatocytes
Rat tail collagen type I was prepared according to the method of Elsdale & Bard (1972). A final concentration of 1.5 mg ml−1 collagen was used for the coating of Petri dishes (Greiner, Frickenhausen, Germany). The pH of the collagen was adjusted to 7.4 using a 10×DMEM (Dulbeccos modified Eagle medium) concentrate (Biochrom, Berlin, Germany), which was diluted with the collagen containing solution at a ratio of 1 : 10. A volume of 1 ml was used for preparation of the collagen layer.
Approximately 2×10⁶ hepatocytes were seeded with 2 ml (Williams E. Biochrom, Berlin, Germany) on collagen coated Petri dishes (60 mm diameter, Greiner, Frickenhausen, Germany). Four hours following seeding and attachment of the cells, culture medium was removed along with nonadherent cells and finally 2 ml of fresh medium was added. A second layer of liquid and ice-cold collagen was pipetted on top of the hepatocytes following removal of the culture medium at 48 h in culture. Thirty minutes following gelation of this second layer of matrix additional culture medium was added on top of the collagen layer.
Culture media were supplemented with 10% (v v−1) foetal bovine serum (Williams E. Biochrom, Berlin, Germany) prednisolone 9.75 μmol l−1, glucagon 0.014 μg ml−1 (Novo, Mainz, Germany) and insulin 0.16 u ml−1 (Hoechst, Frankfurt, Germany). Penicillin 200 u ml−1 and streptomycin 200 μg ml−1 (Biochrom, Berlin, Germany) were also added. The culture medium was replaced with fresh medium every 24 h. Hepatocytes were maintained in culture for 72 h prior to the addition of tacrolimus.
Tacrolimus biotransformation studies with porcine hepatocytes
Primary porcine hepatocyte were incubated with 3.7 μmol l−1 tacrolimus for periods of 0, 1, 2, 4, 8 and 24 h as described above for the enterocyte cultures. For each time point triplicate samples were obtained. Supernatants (=3) from cultures not exposed to tacrolimus served as controls. The incubations were stopped by removal of the cell culture supernatant (2 ml) and subsequent storage at −20°C. The supernatants were then used for LC/ESI-MS analysis.
Tacrolimus biotransformation studies with supersomes
Human CYP 450 proteins expressed in an insect cell line were obtained from Gentest corporation. The cells were transfected with the baculovirus (Autographa californica) vector (BTI-TN-5B1-4) to express individual human CYP 450 proteins. The CYP proteins are expressed at high levels (2000 pmol ml−1 microsomal suspension) and the panel used in this study included CYP2C8, CYP2C9-CYS144 mutant, CYP2C9-Arg144 mutant, CYP 2C19, CYP 3A4, CYP3A4 and cytochrome b5, CYP3A5. All preparations contained cytochrome P450 reductase. Microsome preparations from wild type cells were used as controls (Gentest). Microsomes were incubated with tacrolimus at concentration of 20 μmol l−1 for 20 min at 37°C and 1 mmol NADPH. Fifty pmol CYP 450 was used for each individual assay (n=3 for each CYP isoenzyme). Detection of tacrolimus and its metabolites generated by recombinant CYP proteins was done using the LC/ESI-MS method.
Identification and quantification of tacrolimus (parent drug) and metabolites using LC/particle beam MS
Tacrolimus was the kind gift of Fujisawa Pharmaceuticals (Osaka, Japan). Samples were extracted as described previously (Christians et al., 1991; Gonschior et al., 1994). Twenty-five μl of the resulting extract was injected onto a SphericalR C18 column. 32-di-acetyl-tacrolimus was used as internal standard. Tacrolimus and its metabolites were eluted isocratically with methanol/water (90/10 v v−1) at a flow rate of 0.4 ml min−1. The HPLC-MS system consisted of a Merck-Hitachi system with L-6000 and L-6200 pumps, a 655A-40 autosampler connected through a particle-beam interface to a 5989A mass spectrometer (Hewlett-Packard, Waldbronn, Germany). Further details of the method are given in (Christians et al., 1991; Gonschior et al., 1994). Methane with a purity of >99.5% (Messer, Griesheim, Germany) was used as reagent gas. Detection was done in the selected ion mode (SIM) and focused on the following mass-to-charge ratios (m z−1): 775.5 amu=atomic mass unit (bisdemethyl-hydroxy-tacrolimus), 789.5 amu (demethyl-tacrolimus), 791.5 amu (bisdemethyl-hydroxy-tacrolimus), 805.5 amu (demethyl-hydroxyl-tacrolimus), 807.5 amu (bisdemethyl-di-hydroxy-tacrolimus), 819.5 amu (hydroxy-tacrolimus), 821.5 amu (di-hydroxy-demethyl-tacrolimus), 835.5 amu (di-hydroxy-tacrolimus), 761.5 amu (tri-demethyl-tacrolimus), 887.5 amu (di-acetyl-tacrolimus, internal standard).
During the study period a new electrospray-MS system was purchased and a new LC/ESI-MS method for the detection of tacrolimus and its metabolites was developed. Comparison of both methods produced comparable results, as detailed below.
Identification of tacrolimus and metabolites using LC/electrospray MS
Tacrolimus and its metabolites were detected by electrospray mass spectrometry (ESI-MS) as described by Vidal et al., (1997). Briefly, samples were deproteinized by addition of a methanol/zinc sulphate (80/20%, v v−1) solution and subsequent centrifugation (4900 r.p.m., 6 min). The supernatants were placed into autosampler vials, 400 μl were injected into a HPLC system (HP 1090 II liquid chromatograph, Hewlett-Packard, Waldbronn, Germany) and extracted on a guard column (10×2 mm, Nucleosil 100 C-18, 10 μm). In a backflush mode using an additional HPLC-pump (WellChrom Micro-star K-100, Knauer GmbH, Berlin, Germany) the analyte was eluted with methanol/water 90 : 10 (v v−1) at a flow rate of 0.2 ml min−1. The same isocratic conditions were used to transfer the analyte onto an analytical column (250×2 mm, Hypersil ODS, 5 μm). After separation the elute was injected into the ESI-MS (HP 5989 B MS-engine equipped with an API-electrospray cabinet HP 59987 A, Hewlett-Packard, Waldbronn, Germany). The MS was run in the selected ion mode (SIM) and the Na+-adducts of the mass-to-charge ratios given in the description of the LC/particle beam MS analysis were used.
Western blotting of CYP proteins in porcine enterocytes and hepatocytes
Primary small intestinal enterocytes were harvested following their isolation and on day 3, 7 and 10 in culture. Porcine hepatocytes were maintained in culture for 72 h prior to Western blot analysis. Rat liver microsomes from methylcholanthrene- or dexamethasone-induced rat livers were used as positive controls. Blotting was done with rabbit antibodies against human CYP 1A, CYP 2C 9/10 and CYP 3A4. Antibodies were the kind gift of F.P. Guengerich, U.S.A. The protein expression was studied in pooled samples of three different isolations.
Approximately 4×10⁶ cells were used for microsomal preparations. The culture medium was removed and the cells were washed twice with sterile PBS. Thereafter the cells were centrifuged at 500×g for 5 min. Microsomes were isolated by differential centrifugation according to Hayes (1982) with the following modifications: 0.1 mol l−1 phosphate buffer (pH 7.4) was used instead of Tris buffer and that the times of the centrifugation steps (100,000×g) were reduced to 45 min. Protein concentrations were determined by the bicinchoninic acid method using bovine serum albumin as standard (Smith et al., 1985). Final protein concentration of the microsomal suspension was adjusted to 3 g l−1 with 0.1 mol l−1 phosphate buffer pH 7.4. Electrophoretic separation of proteins was done on a 7.5% polyacrylamide stacking gel and a 10% SDS-polyacrylamide resolving gel, according to the method of Laemmli et al., 1970). A polyvinylidene difluoride membrane (Millipore, Bedford, U.S.A.) and a semidry blotter (Biometra, Göttingen, Germany) were used for electroblotting of proteins. Blots were stained with a 5-bromo-4-chloro-3-indolyl phosphate/nitro blue tetrazolium solution (Sigma, Weinheim, Germany).
Results
Primary enterocyte isolation technique
Protocols 1–3, are adaptations of techniques used for the isolation of hepatocytes (for further details see section on Methods and Table 1) but provided only few viable cells post isolation. In contrast, protocol 4, which was previously reported for the isolation of primary human gastric cells produced an improved cell yield corresponding to 63±12×106 viable cells with 61±10% viability. However the cell population was heterogeneous containing a large proportion of white blood cells representing mainly lymphocytes. In culture, these cells proliferated rapidly and dominated the culture thereafter (days 2–10).
The best results were obtained with protocol 5, which yielded 100–150×106 viable cells from a single isolation procedure. Viability of freshly isolated cells ranged between 90–98% as judged by the trypan blue exclusion test. Viability of cells in culture was assessed by trypan blue exclusion up to 10 days. Viability was 75% within the first 24 h in culture (Figure 1b). A 50% level of viability could be maintained up to 72 h. Thereafter cellular viability declined to 10% at day 7 and 10 in culture.
Figure 1.
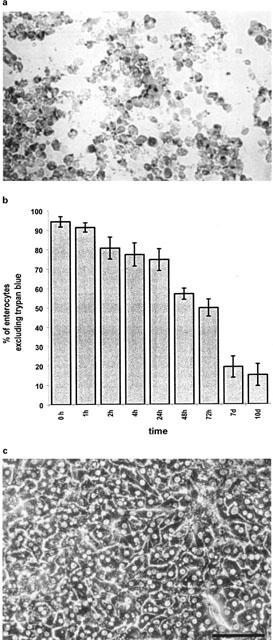
(a) shows a cytospin preparation of aspirated primary porcine enterocytes following 72 h in culture. Staining with Fast red shows polarized apical location of alkaline phosphatase of cells mutually attached with lateral surfaces. Proceeding culture time induces loss of cell polarity and circumferential staining for alkaline phosphatase. (b) records viability of duodenal enterocytes isolated according to protocol 5. Viable cells were found up to 10 days in culture. Viability was assessed by trypan blue exclusion. Data is shown as mean±s.d. of three dishes from three different isolations. (c) shows primary porcine sandwich hepatocytes at 96 h in culture by inverse light microscopy (bar=100 μm).
Staining of cells isolated according to protocol 5 at 0, 1, 3, 7 and 10 days in culture for alkaline phosphatase confirmed the apical location of this enzyme especially during the first 3 days in culture. Columnar appearing cells were laterally attached among each other (Figure 1a). With time in culture polarization of the cells was gradually lost and the cells assumed a more round shape with circumferential staining of alkaline phosphatase. Staining for alkaline phosphatase was positive in 60–80%. Protocol 5 was therefore the only isolation technique subsequently used for the isolation of cells.
Protein expression of CYP isoenzymes in porcine enterocytes
Primary porcine enterocytes expressed CYP 1A1 and CYP 3A up to 10 days in culture as judged by Western blot analysis (Figure 2a,b). As shown in Figure 2a,b CYP1A1 and CYP3A expression was similar up to 3 days in culture, but declined thereafter and was only viable as a faint band at day 10 (Figure 2b). CYP 2C 9/10 was not detected in porcine enterocytes but in porcine hepatocytes.
Figure 2.
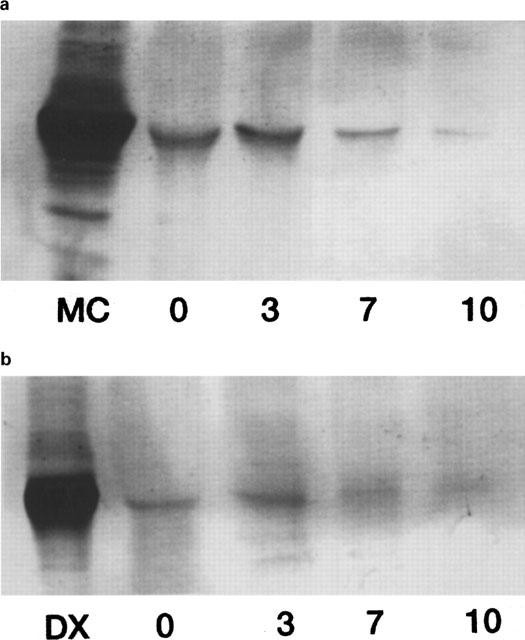
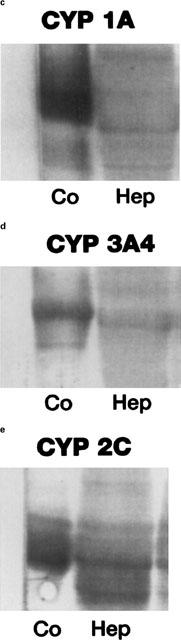
Western blot analysis of microsomes prepared from primary porcine enterocytes and hepatocytes in culture. The expression of CYP 1A, CYP 2C9/10 and CYP 3A4 protein was studied using rabbit antibodies. Rat liver microsomes (10 μg) from methylcholanthrene- (MC) or dexamethasone- (Dx) induced rat livers were used as positive controls. Western blots were carried out by loading 10 μg of cell homogenates on the gel. Primary small intestinal enterocytes were obtained immediately following their isolation (0) and at day 3 (3), day 7 (7) and day 10 (10) in culture. Porcine enterocytes expressed CYP 1A (a) and CYP 3A (b) up to 10 days in culture. Porcine hepatocytes were maintained in culture for 72 h prior to Western blot analysis. Primary porcine hepatocytes cultured in a collagen sandwich configuration expressed CYP 1A (c), CYP 2C9/10 (d) and CYP 3A (e).
Biotransformation of tacrolimus by porcine enterocytes
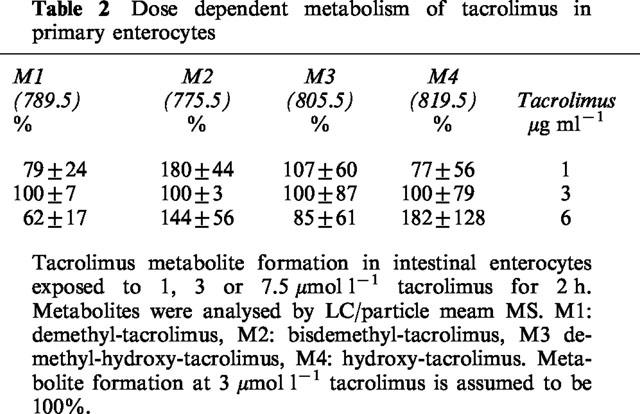
A concentration-dependent production of four metabolites in primary enterocyte cultures was observed with a reduction in the metabolite formation at the highest dose. Metabolites detected by mass spectrometry included M1 (demethyl-tacrolimus, 789.5, Figure 3), M2 (bisdemethyl-tacrolimus, 775.5), M3 (demethyl-hydroxy-tacrolimus, 805.5) and M4 (hydroxy-tacrolimus, 819.5, Figure 3). The relative change in metabolite formation is summed up in Table 2. Metabolite M1 was preferentially generated at the substrate concentration of 3.7 μmol l−1, while M2 and M3 were predominantly generated at 1.2 μmol l−1 and M4 at 7.5 μmol l−1. It must be noted that M1 was quantitatively the most important metabolite, and changes in its production were more extensive than those for M2–M4 concentrations.
Figure 3.
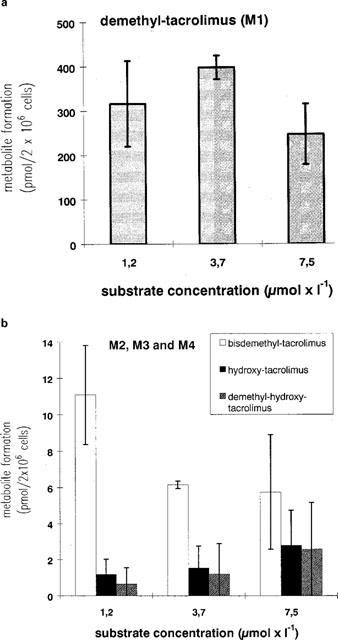
Tacrolimus metabolite formation in intestinal enterocytes exposed to 1, 3, or 7, 5 μmol l−1 tacrolimus for 2 h. Metabolites were analysed by LC/particle beam-MS. Data is shown as mean±s.d. of at least four dishes (2×10⁶ cells). Tacrolimus was added to the culture medium 4 h post isolation. (a) demethyl-tacrolimus (M1), (b) bisdemethyl-tacrolimus (M2), demethyl-hydroxy-tacrolimus (M3) and hydroxy-tacrolimus (M4).
Table 2.
Dose dependent metabolism of tacrolimus in primary enterocytes
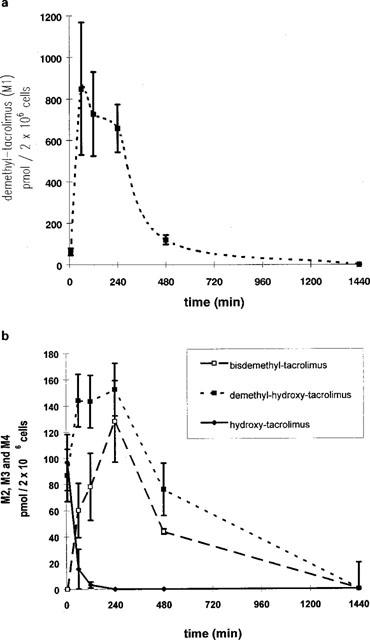
Kinetics of tacrolimus metabolite formation in porcine enterocytes
Tacrolimus at a substrate concentration of 3.7 μmol l−1 was incubated for 0, 1, 2, 4, 8 and 24 h. Demethyl-tacrolimus (M1, 789.5) was quantitatively the most important metabolite accounting for about 95% of the detected metabolites (Figure 4a). The amount of M1 produced by 2×10⁶ cells was 348±65 pmol at the end of the first hour of incubation thus indicating rapid production of this metabolite. The level of demethyl-hydroxy-tacrolimus (M3, 805.5) and hydroxy-tacrolimus (M4, 819.5) was highest during the first 2–4 h and declined thereafter (Figure 4b). Within the first 2 h incubation period the production of M3 and M4 was higher than that of M2, but in 24 h incubation experiments M2 was quantitatively the most important metabolite followed by M4 and M3 (Figure 4b).
Figure 4.
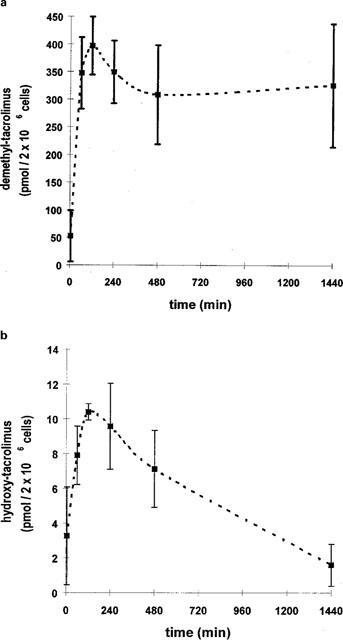
Kinetics of tacrolimus metabolite formation in intestinal enterocytes exposed to 3, 7 μmol l−1 tacrolimus for 0, 1, 2, 4 or 24 h. Tacrolimus was added to the cell cultures 4 h following isolation. Metabolites were analyzed by LC/particle beam-MS. Data is shown as mean±s.d. of at least three dishes (2×10⁶ cells). (a) demethyl-tacrolimus (M1); (b) bisdemethyl-tacrolimus (M2), demethyl-hydroxy-tacrolimus (M3) and hydroxy-tacrolimus (M4).
Induction of tacrolimus biotransformation in porcine enterocytes
Treatment of enterocyte cultures with dexamethasone for 48 h at a concentration of 50 μmol l−1 led to a 6–36 fold increase in the production of bisdemethyl-tacrolimus (M2, 775.5), demethyl-tacrolimus (M1, 789.5), demethyl-hydroxy-tacrolimus (M3, 805.5) and hydroxy-tacrolimus (M4, 819.5) generation relative to the controls (Figure 5a). The expression of CYP 3A protein increased in dexamethasone treated duodenal enterocytes (Figure 5b). Good agreement was obtained when the increased metabolite production was compared with the increased expression of the CYP3A protein.
Figure 5.
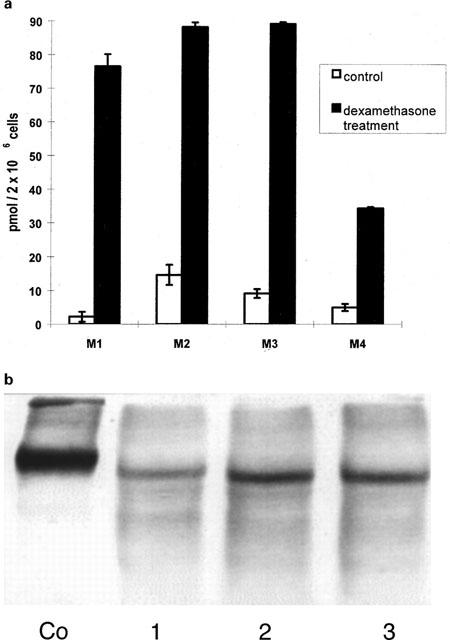
(a) Tacrolimus metabolite formation by intestinal enterocytes. Enterocyte cultures were exposed to 50 μmol l−1 dexamethasone for 48 h. Controls consisted of dishes not exposed to dexamethasone. Thereafter the enterocyte cultures were exposed to 3, 7 μmol l−1 tacrolimus for 2 h. Metabolites were identified by LC/particle beam-MS: demethyl-tacrolimus (M1), bisdemethyl-tacrolimus (M2), demethyl-hydroxy-tacrolimus (M3) and hydroxy-tacrolimus (M4). Data is shown as mean±s.d. of four dishes (2×10⁶ cells). (b) Western blot analysis of enterocytes (10 μg microsomes) at 2 days in culture (i.e. 48 h induction period). Following isolation and cell seeding enterocytes were cultured in the presence of 50 μmol l−1 dexamethasone for 48 h. Thereafter cells were harvested and frozen at −20°C until further preparation. Microsomes were produced and subjected to Western blot analysis as detailed in the Methods section. Cells not exposed to dexamethasone were used as controls (Co).
Metabolism studies with porcine hepatocytes
Porcine sandwiched hepatocyte cultures reestablished a polyhedric appearance and distinct pericellular biliary zones indicating reestablishment of cell polarity as shown in Figure 1c. When incubated on day 3 in culture with tacrolimus for periods ranging between 0–24 h (Figure 6) porcine hepatocytes formed the same group of metabolites as observed with enterocytes including demethyl-tacrolimus (M1), bisdemethyl-tacrolimus (M2), demethyl-hydroxy-tacrolimus (M3) and hydroxy-tacrolimus (M4). Formation of tacrolimus metabolites peaked within the first hour. The amount of demethyl-tacrolimus produced by 2×10⁶ cells was 335±130 ng at the end of the first hour of incubation. The level of M2–M4 was highest during the first 2–4 h and declined thereafter (Figure 6). In contrast to enterocyte cultures, formation of demethyl-hydroxy-tacrolimus (M3, 805.5) was higher than that of bisdemethyl-tacrolimus (M2, 775.5). Hydroxy-tacrolimus (M4) was only detected during the first 2 h of incubation with tacrolimus. Western blot analysis of porcine hepatocytes was positive for CYP 1A, CYP 2C9/10 and CYP 3A on day 3 in culture (Figure 2c–e).
Figure 6.
Kinetics of tacrolimus metabolite formation in primary porcine hepatocytes exposed to 3, 7 μmol l−1 tacrolimus for 0, 1, 2, 4 or 24 h starting on day 3 in culture. Metabolites were analysed by LC/electrospray-MS. Data is shown as mean±s.d. of at least three dishes (2×10⁶ cells). (a) demethyl-tacrolimus (M1); (b) bisdemethyl-tacrolimus (M2), demethyl-hydroxy-tacrolimus (M3) and hydroxy-tacrolimus (M4).
Tacrolimus metabolite formation with insect cell microsomes expressing human CYPs
All four metabolites (bisdemethyl-tacrolimus (M2, 775.5), demethyl-tacrolimus (M1, 789.5), demethyl-hydroxy-tacrolimus (M3, 805.5) and hydroxy-tacrolimus (M4, 819.5) were produced by the CYP3A protein family (Figure 7) with M1–M3 being generated by CYP 3A5, CYP 3A4b5 and CYP 3A4. Small quantities of M1 were also formed by CYP2C8 and CYP2C19. Bisdemethyl-tacrolimus (M2) was preferentially but not exclusively produced by CYP3A4b5, while hydroxy-tacrolimus (M4, 819.5) was exclusively generated by CYP 3A5. The amount of demethyl-tacrolimus production was 10–20 times higher than the formation of the other three metabolites.
Figure 7.
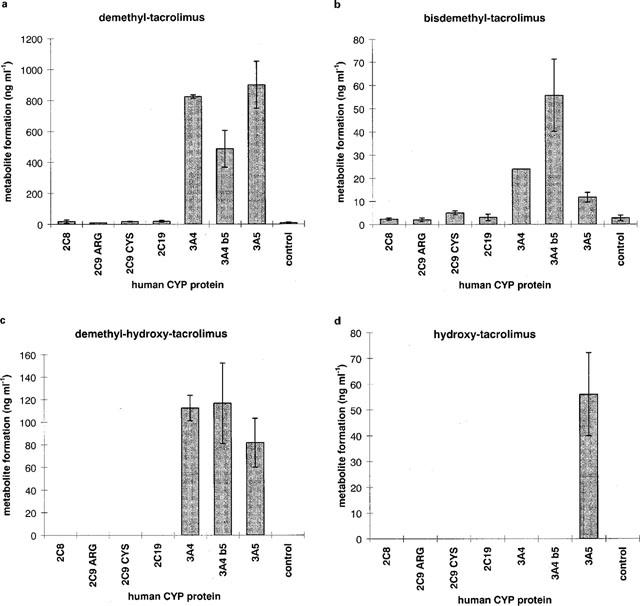
Tacrolimus metabolite formation with insect cell microsomes overexpressing either human CYP2C8, CYP2C9-CYS144 CYP2C9-Arg144, CYP 2C19, CYP 3A4, CYP3A4 with cytochrome b5 or CYP3A5 proteins. All microsomal preparations contained cytochrome P450 reductase. (a) demethyl-tacrolimus (M1), (b) bisdemethyl-tacrolimus (M2), (c) demethyl-hydroxy-tacrolimus (M3),: (d) hydroxy-tacrolimus (M4). Microsomes were incubated with tacrolimus at a substrate concentration of 17.5 μmol l−1 (20 μmol l−1) for 20 min at 37°C. Data is shown as mean±s.d. of triplicate assays. Metabolites were analysed by LC/electrospray-MS.
Comparative metabolism studies with enterocytes and hepatocytes using KC11346 and KC12291 as substrates
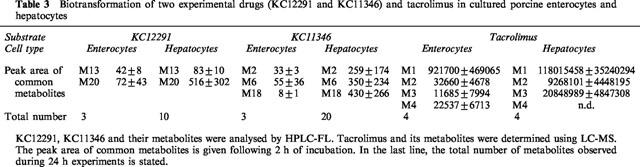
To obtain additional data on the metabolic competence of enterocytes and hepatocytes two further cardiovascular experimental drugs termed KC12291 and KC11346 were examined. As shown in Table 3 enterocytes produced only three metabolites as compared to ten (KC12291) and 20 (KC11346) metabolites produced by hepatocytes. This shows that for KC11346 and KC12291 enterocytes may be less important in the overall biotransformation of the latter drugs when compared to the pronounced hepatic first pass effect predicted with hepatocyte cultures. In contrast, enterocytes appear to be of importance in the metabolism of tacrolimus, albeit its quantitative contribution to the overall biotransformation of this immunosuppressive drug should not be over rated. It is also of great importance that the metabolism of tacrolimus could be increased upon treatment of enterocytes with dexamethasone thus indicating the potential of drug-drug interaction at the intestinal barrier.
Table 3.
Biotransformation of two experimental drugs (KC12291 and KC11346) and tacrolimus in cultured porcine enterocytes and hepatocytes
Discussion
It was shown that primary porcine small intestinal cells as well as hepatocytes can successfully be cultured for the study of drug oxidation reactions and as shown in this study the metabolism of tacrolimus in cultured primary enterocytes is qualitatively similar to that of primary hepatocytes. Furthermore metabolites of tacrolimus were primarily produced in both cultures by members of the CYP3A protein family. As shown with the panel of insect cell microsomes hydroxy-tacrolimus was exclusively generated by human CYP 3A5. The addition of 1,4-DTT to remove mucous and the use of pronase in the isolation buffer during the enzymatic digestion led to high yields and viability. We also showed that primary enterocytes can be kept in culture for time periods comparable to their in vivo life span of approximately 4–7 days. In vivo, small intestinal enterocytes migrate from the crypt of the mucosa to the top of the small intestinal villi within 24–36 h (Schmidt & Thews, 1995). From this position they are discarded into the gut lumen within 3–6 days (Schmidt & Thews, 1995). As shown for the cells isolated according to protocol 5, the majority (90%) expressed alkaline phosphatase in an apical position, which is typical for mature small intestinal enterocytes. CYP 3A is the major intestinal cytochrome accounting for more than 70% of intestinal CYPs in pigs and humans (Watkins et al., 1987). The concentration of CYP3A is highest in the duodenum followed by the jejunum and is lowest in ileum and colon (Lampen et al., 1996). CYP1A was also detected in the small intestine of the rat (Traber et al., 1992), which is in good agreement with the CYP 1A protein expression in primary enterocytes as shown in this study. CYP2C9/10 was not expressed in primary porcine enterocytes which agrees well with the previous finding of Lampen et al., 1995) using microsomal preparations of porcine duodenum. In contrast, porcine hepatocytes expressed 2C9/10 as well as CYP1A and CYP3A proteins, albeit at varying intensities. The production of demethyl-tacrolimus in porcine enterocytes was strikingly similar to that in porcine hepatocytes. Insect microsomal preparations expressing human CYP3A5, 3A4 b5 and 3A4 proteins also produced predominantly demethyl-tacrolimus, which confirms the importance of CYP3A proteins in the metabolism of tacrolimus. The exclusive generation of hydroxy-tacrolimus by CYP3A5 clarifies earlier work as CYP3A4 antibodies did not fully abolish the production of tacrolimus metabolites in microsomes (Sattler et al., 1992).
It is of considerable interest that the tacrolimus metabolites produced by primary enterocytes were essentially similar to that of porcine sandwiched hepatocytes. This provides further evidence for enterocytes being metabolically competent and the results of this study exemplify the importance of the intestine for the biotransformation of tacrolimus. This result also reflect the utility and versatility of the primary enterocyte model developed in this study. In a previous study with porcine small intestinal microsomes (Lampen et al., 1995) the tacrolimus metabolite bisdemethyl-hydroxy-tacrolimus was produced, but this metabolite was not identified with porcine duodenal tissue in an Ussing chamber experiment (Lampen et al., 1996). It is reasonable to suggest significant differences in metabolic pathways of drugs and xenobiotics when intact cells and microsomal preparations are compared.
The decline in the formation of phase I metabolites during longer incubation times with porcine sandwiched hepatocytes indicates further metabolism, e.g. phase II metabolism of tacrolimus. Unfortunately, within this study the influence of phase II metabolism on the biotransformation of tacrolimus was not studied. It is, however, not easy to measure intact glucuronides in the LC-MS system. One of the reasons for not obtaining this information lies within the difficulties of generating appropriate ions after ionization. Indeed, we have employed two ionization methods for the identification of biotransformation products and were unable to detect by particle beam and electrospray any of the potential glucuronides. It is certainly not a trivial issue to detect intact glucuronides in body fluids or culture media. As pointed out by Firdaous et al., (1997) some of the tacrolimus-glucuronides in human bile are pH-sensitive and can only be detected under strong acidic conditions, but not at pH≈5, which is commonly adjusted for in bioanalytical assays for blood and urine samples. As our study focused on the identification of metabolites commonly observed in transplant patients no attempt was made to identify other metabolites. In the case of enterocytes the production of glucuronides and of other phase II metabolites of tacrolimus is not considered to be of great importance in view of the marginal decline in parent drug levels and the plateau-like production of demethyl-tacrolimus (see Figure 4). Although the formation of hydroxy-tacrolimus declined over time the overall production of this metabolite is 1/40 of that of demethyl-tacrolimus. In strong contrast, a significant decline in the production of phase I metabolites was seen over time with hepatocytes. Whether or not phase II metabolites are stable in the cell culture medium is not known, but it is unfortunate that no detailed assessment of the production of phase II metabolites could be carried out. Given the fact that no synthetic standards are available no detailed information can be obtained on the precise molecular structures of putative phase II metabolites, even when using the LC-MS analytical system. These thoughts should be taken into consideration when phase II metabolism is being considered. Using porcine hepatocytes and enterocytes the metabolism of tacrolimus was compared to that patient data and it is evident that the porcine model would have predicted human tacrolimus metabolites as seen in patient blood and urine samples.
The ability of dexamethasone to induce CYP3A in enterocytes is novel but confirms previous findings with hepatocytes where the transcriptional activation of the CYP3A gene is reported for dexamethasone treatment. This treatment is also causally related to the very significant increase in the production of tacrolimus metabolites. Whether dexamethasone merely aids the maintenance of the CYP3A gene activity at levels similar to those observed in the control enterocyte cultures shortly after isolation (2 h) or whether the induction seen at 48 h post isolation awaits further experimentation. Nonetheless these data reflect, at least in part, the importance of this glucocorticoid in the transcriptional activation of the CYP3A gene.
The biotransformation of two experimental drugs termed KC12291 and KC11346 was additional investigated to provide further data on the metabolic competence of enterocytes and to compare its metabolism with that of hepatocytes. Both drugs were considered for the development in cardiovascular disease and as shown in our study (see Table 3) do undergo significant biotransformation in hepatocyte culture, whereas enterocytes were less metabolically competent. This data was simply included to provide further examples of drug biotransformation ractions and to demonstrate the utility of our in vitro system.
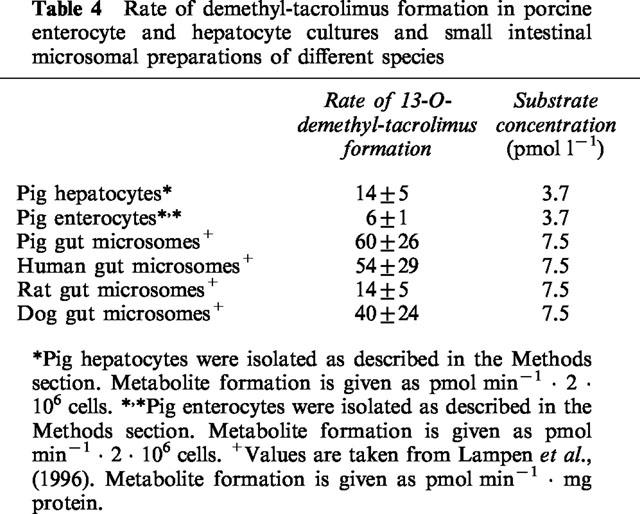
Using pig hepatocytes and enterocytes and microsomes from the intestine of pig, rat, dog and human it becomes clear that pig enterocytes were about 10 fold less metabolically competent when compared with pig or human intestinal microsomal preparations. On the other hand the relative and absolute protein expression of the CYP3A gene is likely to differ significantly between both in vitro systems, as microsomal fractions are enriched with drug metabolizing proteins from the endoplasmic reticulum, whereas in the case of intact enterocytes this enrichment with microsomal enzymes can not be obtained. Furthermore, precise protein determinations in cell culture is difficult to obtain due to a variety of contaminants such as collagen used in the hepatocyte culture. Due to technical difficulties a precise comparison on a protein basis is difficult to achieve (microsomal protein on the one hand against number of intact and viable cells on the other hand).
Our study predicts in the case of tacrolimus significant intestinal metabolism in vivo, and its large scatter in bioavailability may be linked to individual variations in the expression of CYP3A proteins in the intestine. Further studies with human material are needed to ascertain this assumption. It is of considerable importance that dexamethasone enhances enterocyte metabolism of tacrolimus and this should be taken into consideration when dexamethasone is used in combination with immunosuppressive pharmacotherapy. Whether dexamethasone treatment produces intestinal CYP3A4/5 induction remains to be determined as it is unknown to what extent such induction would contribute to variations in the bioavailability of tacrolimus. Although the findings with dexamethasone are unclear CYP3A is known to be inducible by dexamethasone and other glucocorticoids in primary hepatocytes and drug interactions at the level of the intestine are possible and thus warrant further studies. Therefore, a cautious approach may be advisable when ‘cocktails of drugs' are used during pharmacotherapy.
In conclusion, the culture of primary small enterocytes in combination with primary hepatocytes are valuable in clarifying the relative contribution of the intestine and the liver for predicting their contribution to the overall in vivo drug biotransformation.
Table 4.
Rate of demethyl-tacrolimus formation in porcine enterocyte and hepatocyte cultures and small intestinal microsomal preparations of different species
Acknowledgments
We are grateful to DFG, SFB 280 for providing funding to this project (A8). We are thankful to U. Christians for providing technical support for the LC/MS analysis of tacrolimus and its metabolites. The project was funded by BMBF BEO/31 0311263 and DLR 50TK9802.
Abbreviations
- amu
atomic mass unit
- CYP
cytochrome P450
- DMEM
Dulbeccos modified Eagle medium
- DMF
N,N-dimethylformamide
- DTT
1,4-dithiothreitol
- EGTA
ethyleneglycol-bis (β-amonoethyl ether)-tetraacetic acid
- ESI
electrospray
- HEPES
N-2-hydroxyethyl piperazine-N-2-ethanesulphonic acid
- HPLC
high performance liquid chromatography
- KRB
Krebs-Ringer buffer
- M1
demethyl-tacrolimus
- M2
bisdemethyl-tacrolimus
- M3
demethyl-hydroxy-acrolimus
- M4
hydroxy-tacrolimus
- MS
mass spectroscopy
- PB
phosphate buffer
- PBS
phosphate buffered saline
- sim
selected ion mode
References
- CARRIERE V., LESUFFLEUR T., BARBAT A., ROUSSET M., DUSSAULX E., COSTET P., DE W.I., BEAUNE P., ZWEIBAUM A. Expression of cytochrome P-450 3A in HT29-MTX cells and Caco-2 clone TC7. FEBS Lett. 1994;355:247–250. doi: 10.1016/0014-5793(94)01199-0. [DOI] [PubMed] [Google Scholar]
- CHRISTIANS U., KRUSE C., KOWNATZKI R., SCHIEBEL H.M., SCHWINZER R., SATTLER M., SCHOTTMANN R., LINCK A., ALMEIDA V.M., BRAUN F.Measurement of FK 506 by HPLC and isolation and characterization of its metabolites Transplant Proc. 199123940–941.et al [PubMed] [Google Scholar]
- ELSDALE T., BARD J. Collagen substrata for studies on cell behavior. J. Cell Biol. 1972;54:626–637. doi: 10.1083/jcb.54.3.626. [DOI] [PMC free article] [PubMed] [Google Scholar]
- FIRDAOUS I., VIRBEECK R.K., HASSOUN A., LANGREHR J.M., WALLEMACQ P.E. Excretion of tacrolimus glucuronides in human bile. Eur. J. Drug Metab. Pharmacokinet. 1997;22:217–221. doi: 10.1007/BF03189810. [DOI] [PubMed] [Google Scholar]
- GONSCHIOR A.K., CHRISTIANS U., BRAUN F., WINKLER M., LINCK A., BAUMANN J., SEWING K.F. Measurement of blood concentrations of FK 506 (tacrolimus) and its metabolites in seven liver graft patients after the first dose h.p.l.c. and microparticle enzyme immunoassay (MEIA) Brit. J. Clin. Pharm. 1994;38:567–671. doi: 10.1111/j.1365-2125.1994.tb04398.x. [DOI] [PMC free article] [PubMed] [Google Scholar]
- GRAFSTROM R., MOLDEUS P., ANDERSSON B., ORRENIUS S. Xenobiotic metabolism by isolated rat small intestinal cells. Med. Biol. 1979;57:287–293. [PubMed] [Google Scholar]
- HAHN U., CHO A., SCHUPPAN D., HAHN E.G., MERKER H.J., RIECKEN E.O. Intestinal epithelial cells preferentially attach to a biomatrix derived from human intestinal mucosa. Gut Suppl. 1987;28:153–158. doi: 10.1136/gut.28.suppl.153. [DOI] [PMC free article] [PubMed] [Google Scholar]
- HARTMANN F., GRUENKE L.D., CRAIG J.C., BISSELL D.M. Chlorpromazine metabolism in extracts of liver and small intestine from guinea pig and from man. Drug Metab. Dispos. 1983;11:244–248. [PubMed] [Google Scholar]
- HAYES A.W. Principles and methods of toxicology. Raven Press: New York; 1982. [Google Scholar]
- INCE P., ELLIOTT K., APPLETON D.R., MOORGHEN M., FINNEY K.J., SUNTER J.P., HARRIS A.L., WATSON A.J. Modulation by verapamil of vincristine pharmacokinetics and sensitivity to metaphase arrest of the normal rat colon in organ culture. Biochem. Pharmacol. 1991;41:1217–1225. doi: 10.1016/0006-2952(91)90661-n. [DOI] [PubMed] [Google Scholar]
- KOLARS J.C., BENEDICT P., SCHMIEDLIN R.P., WATKINS P.B. Aflatoxin B1-adduct formation in rat and human small bowel enterocytes. Gastroenterology. 1994;106:433–439. doi: 10.1016/0016-5085(94)90602-5. [DOI] [PubMed] [Google Scholar]
- KOLARS J.C., SCHMIEDLIN R.P., SCHUETZ J.D., FANG C., WATKINS P.B. Identification of rifampin-inducible P450IIIA4 (CYP3A4) in human small bowel enterocytes. J. Clin. Invest. 1992;90:1871–1878. doi: 10.1172/JCI116064. [DOI] [PMC free article] [PubMed] [Google Scholar]
- LAEMMLI U.K. Cleavage of structural proteins during the assembly of the head of bacteriophage T4. Nature. 1970;227:680–685. doi: 10.1038/227680a0. [DOI] [PubMed] [Google Scholar]
- LAMPEN A., CHRISTIANS U., GONSCHIOR A.K., BADER A., HACKBARTH I., ENGELHARDT W., SEWING K.-F. Metabolism of the macrolide immunosuppressant tacrolimus in the pig gut mucosa in the ussing chamber. Br. J. Pharmacol. 1996;117:1730–1734. doi: 10.1111/j.1476-5381.1996.tb15346.x. [DOI] [PMC free article] [PubMed] [Google Scholar]
- LAMPEN A., CHRISTIANS U., GUENGERICH F.P., WATKINS P.B., KOLARS J.C., BADER A., GONSCHIOR A.K., DRALLE H., HACKBARTH I., SEWING K.F. Metabolism of the immunosuppressant tacrolimus in the small intestine: cytochrome P450, drug interactions, and interindividual variability. Drug Metab. Dispos. 1995;23:1315–1324. [PubMed] [Google Scholar]
- SÄFSTEN B., FLEMSTRÖM G. Dopamine and vasoactive intestinal peptide stimulate cyclic adenosine-3′,5′-monophosphate formation in isolated rat villus and crypt duodenocytes. Acta Physiol. Scand. 1993;149:67–75. doi: 10.1111/j.1748-1716.1993.tb09593.x. [DOI] [PubMed] [Google Scholar]
- SATTLER M., GUENGERICH F.P., YUN C.H., CHRISTIANS U., SEWING K.F. Cytochrome P-450 3A enzymes are responsible for biotransformation of FK506 and rapamycin in man and rat. Drug Metab. Dispos. Biol. Fate Chem. 1992;20:753–761. [PubMed] [Google Scholar]
- SCHMIDT R.F., THEWS G. Physiologie des Menschen. Springer Verlag: Berlin, Heidelberg, New York; 1995. [Google Scholar]
- SMITH P.K., KROHN R.J., HERMANSON G.T., MALLIA A.K., GARTNER F.K., PROVENZANO M.D., FUJIMOTO E.K., GOEKE N.M., OLSON B.J., KLENK D.C. Measurement of protein using bicinchoninic acid. Anal. Biochem. 1985;150:76–85. doi: 10.1016/0003-2697(85)90442-7. [DOI] [PubMed] [Google Scholar]
- TRABER P.G., WANG W., YU L.Differential regulation of cytochrome P-450 genes along rat intestinal crypt-villus axis Am. J. Physiol. 1992263215–223.(2 Pt 1), G [DOI] [PubMed] [Google Scholar]
- VAN DE WIEL J.A., MEUWISSEN M., KOOY H., FIJNEMAN P.H., NOORDHOEK J., BOS R.P. Influence of long-term ethanol treatment on in vitro biotransformation of benzo(a)pyrene in microsomes of the liver, lung and small intestine from male and female rats. Biochem. Pharmacol. 1992;44:1977–1984. doi: 10.1016/0006-2952(92)90100-w. [DOI] [PubMed] [Google Scholar]
- VIDAL C., KIRCHNER G., SEWING K.F. Proc. 14th IMSC. August, Tampere, Finnland; 1997. Fully automated analysis of tacrolimus from blood using online-SPE followed by HPLC/ESI-MS; pp. 25–29. [Google Scholar]
- WAGNER S., BEIL W., MAI U.E.H., BOKEMEYER C., MEYER H.J., MANNS M.P. Interaction between helicobacter pylori and human gastric eptithelial cells in culture: effect of antiulcer drugs. Pharmacology. 1994;49:226–237. doi: 10.1159/000139238. [DOI] [PubMed] [Google Scholar]
- WATKINS P.B., WRIGHTON S.A., SCHUETZ E.G., MOLOWA D.T., GUZELIAN P.S. Identification of glucocortioid-inducible cytochrome P-450 in intestinal mucosa of rats and man. J. Clin. Invest. 1987;80:1029–1036. doi: 10.1172/JCI113156. [DOI] [PMC free article] [PubMed] [Google Scholar]
- WORTELBOER H.M., DE K.C., VAN I.A., FALKE H.E., NOORDHOEK J., BLAAUBOER B.J. The isoenzyme pattern of cytochrome P450 in rat hepatocytes in primary culture, comparing different enzyme activities in microsomal incubations and in intact monolayers. Biochem. Pharmacol. 1990;40:2525–2534. doi: 10.1016/0006-2952(90)90095-3. [DOI] [PubMed] [Google Scholar]