

Abstract
Specific inhibitors of serine/threonine phosphatases like okadaic acid can induce apoptotic cell death in the pancreatic beta cell line HIT. Cultivation in stepwise increased concentrations of okadaic acid enabled the isolation of HIT100R cells which proliferate at 100 nM okadaic acid (8–10 times the initially lethal concentration).
These two cell lines were used to characterize the events triggered by okadaic acid that led to apoptosis. Biochemical markers, e.g. cytochrome c release from mitochondria and increase of caspase-3-like activity, revealed that induction of apoptosis by 100 nM okadaic acid in parental HIT cells started with the release of cytochrome c. In HIT100R cells 500 nM okadaic acid were necessary to induce alterations comparable to those observed with 100 nM okadaic acid in non-resistant HIT cells.
In contrast to okadaic acid, the potency of the structurally different phosphatase inhibitor cantharidic acid to induce cytochrome c release, increase of caspase-3-like activity and DNA fragmentation was comparable in HIT and HIT100R cells. Thus, no cross-resistance between these phosphatase inhibitors seemed to exist.
Phosphatase activity in extracts from HIT and HIT100R cells did not differ in its total amount or in its sensitivity for okadaic acid.
Since higher concentrations of okadaic acid were needed to induce apoptosis in HIT100R cells, a compromised intracellular accumulation of the toxin appeared likely. Functional and structural analysis revealed that this was achieved by the development of the multidrug resistance phenotype in HIT100R cells. The underlying mechanism appeared to be the enhanced expression of the pgp1 but not the pgp2 gene.
Keywords: Serine/threonine phosphatase inhibitors, okadaic acid, cantharidic acid, HIT cells, apoptosis, phosphatase activity, multidrug resistance phenotype
Introduction
Okadaic acid (OA) is a selective inhibitor of serine/threonine phosphatases (PP). OA inhibits PP1 and PP2A with IC50 values of 15–50 nM and 0.5–1 nM, respectively. Micromolar concentrations might also inhibit other PPs (Ishihara et al., 1989; Honkanen et al., 1994). This compound has been widely used to elucidate the role of phosphorylation reactions in a variety of cells and cell lines (Cohen et al., 1990; Ämmälä et al., 1994). During long-term exposure to OA the occurrence of apoptotic cell death became obvious (Bøe et al., 1991; Tergau et al., 1997). This was also observed in insulin-secreting HIT T15 cells, a SV40-transformed hamster pancreatic beta cell line (Santerre et al., 1981), where OA was used to elucidate the role of phosphorylation in the regulation of insulin synthesis and secretion (Krautheim et al., 1999).
Apoptosis is a highly conserved form of cell death, which is important for normal tissue turn over, embryonic development and regulation of the immune system, but can also be the consequence of chemically-induced cell death. Apoptotic cell death is characterized by typical morphological and biochemical features like cell shrinkage, chromatin condensation, activation of caspases and internucleosomal DNA fragmentation. This process eventually leads to the disassembly of the affected cells into membrane enclosed apoptotic bodies. These apoptotic bodies get phagocytosed without causing an immune response (Kerr et al., 1972; Wyllie et al., 1980; Kroemer et al., 1998). The initiation of apoptosis seems to depend on the stimulus and the cell type, but then merges into a common effector pathway (Thornberry, 1998). Apoptotic beta cell death is supposed to be of importance in the development of insulin dependent diabetes mellitus (Mauricio & Mandrup-Poulsen, 1998).
In this study we characterized the events triggered by OA leading to apoptosis. In doing so we took advantage of HIT cells which were partially resistant against OA-induced cell death. These cells had been generated by cultivating HIT cells in stepwise increased concentrations of OA over a period of 8 months. Thereby cells were selected which grew and proliferated at 100 nM OA which is about 8–10 times the initially lethal concentration (HIT100R cells).
As potential mechanisms of OA-resistance in these HIT100R cells, we tested for changes in phosphatase activity and sensitivity to inhibitors as well as the development of the multidrug resistance (MDR1) phenotype as a cause for a compromised intracellular accumulation of the toxin. Furthermore, the potencies of the structurally different phosphatase inhibitors cantharidic acid and calyculin A to induce apoptosis were studied in both cell lines.
Methods
Chemicals
Okadaic acid (ammonium salt) and calyculin A were obtained from RBI (Cologne, Germany), cantharidic acid was from Biomol (Hamburg, Germany) and okadaic acid anthrylmethyl ester from Alexis (Grünberg, Germany). Reagents for MTT test, ammonium molybdate, malachite green and rhodamine 123 were from Sigma (Deisenhofen, Germany), reserpine was from Boehringer Mannheim (Mannheim, Germany), verapamil was a gift from Knoll (Ludwigshafen, Germany), RPMI 1640 cell culture medium (10 mM glucose) and PBS from Biochrom (Berlin, Germany) and foetal calf serum (FCS) from Gibco BRL (Eggenstein, Germany). All other reagents of analytical degree were purchased from E. Merck (Darmstadt, Germany).
Cell culture
HIT and HIT100R cells were cultured in RPMI 1640 cell culture medium with 10% FCS at 37°C in a humidified atmosphere of 95% air and 5% CO2. HIT100R cells were treated with 100 nM OA once a week.
Viability assay
Viability of cultured cells was assessed by MTT test (Janjic & Wollheim, 1992). Cells were seeded in 96-well-plates and the different treatments were started the following day. After 48 h 10 μl MTT solution (5 mg ml−1 PBS, final concentration 0.5 mg ml−1) was added and cells further incubated for 60 min at 37°C. Then cells were lysed by SDS and the metabolism-dependent conversion of the tetrazolium salt MTT into magenta-coloured formazan was measured at 550 nm against a background of 650 nm in a microplate photometer (Molecular Devices, U.S.A.).
Caspase-3-like proteolytic activity
After indicated times of treatment cells were trypsinized, centrifuged (100×g, 4°C, 5 min), washed with PBS/2 mM PMSF and taken up in caspase buffer (HEPES 10 mM, NP-40 1%, aprotinin 0.01 mg ml−1, EDTA 4 mM, PMSF 2 mM, DTT 15 mM, pH 7.4). Cells were lysed by three freeze/thaw cycles, centrifuged (5200×g, 4°C, 10 min) and 200 μl cell lysate incubated at 37°C with the substrate DEVD-pNA (25 μM) either with or without the inhibitor DEVD-CHO (100 nM). Every 10 min colour development was measured at 405 nm in a microplate photometer. Caspase activity was determined as the difference of optical density between inhibited and uninhibited samples according to protein content. 1 Unit (u)=1 pmol substrate conversion per minute under the assay conditions.
Western blotting of cytochrome c
After indicated times of treatment cells were trypsinized, centrifuged (300×g, 25°C, 3 min) and washed twice with PBS. After complete removal of the supernatant, extraction buffer (PBS, EDTA 2 mM, PMSF 2 mM, DTT 1 mM) was added to the cell pellet at a 1 : 4 ratio (vol extraction buffer/fresh weight of pellet) and cells were disrupted by centrifugation (3500×g, 25°C, 6 min) with the mitochondria remaining intact (no cytochrome c was detectable in supernatant of untreated controls). Supernatant was carefully removed and stored at −70°C until analysis by gel electrophoresis. Aliquots of 15 μl supernatant were loaded onto each lane of a polyacrylamide gradient (12–20%) gel, separated through electrophoresis (Laemmli, 1970) and electrotransferred onto a PVDF membrane (Millipore, U.S.A.). Blots were probed with cytochrome c antibody (Pharmingen, U.S.A.) and signals detected using the enhanced chemiluminescence system (Amersham, U.K.).
Internucleosomal DNA fragmentation
DNA fragmentation was studied according to Darzynkiewicz et al. (1994). Cells were scraped off the culture dishes and stored in 70% ethanol/PBS (1.5 : 0.1, by vol) at −20°C. Low molecular weight DNA was extracted by incubation of the cell pellet in a citric acid phosphate buffer for 30 min at room temperature and subsequent centrifugation at 14,000×g. DNA in the supernatant was treated with RNase and proteinase K and separated by electrophoresis at 80 V for 65 min in a 0.8% agarose TBE gel.
Phosphatase activity
Casein dephosphorylation activity was determined by a modified colorimetric assay based on Geladopoulos et al. (1991). Cells were scraped off the cell culture dishes in icecold phosphatase buffer (Tris-HCl pH 7.0 50 mM, EDTA 0.1 mM), sonicated, centrifuged (14,000×g, 4°C, 10 min) and separated by a Sephadex G-25 column (Pharmacia Biotech, Sweden). These cell extracts (10 μg protein) and the substrate casein (20 μg) were incubated for 1 h at 37°C in phosphatase buffer with or without inhibitors or activators (final volume 70 μl). Directly afterwards malachite green dye solution (4.2% ammonium molybdate in 4 M HCl and 0.045% malachite green in H2O; 1 : 3 by vol) was added. After 15 min free inorganic phosphate was measured by the formation of a coloured complex between acidified phosphomolybdate and the malachite green by absorption at 650 nm in a microplate photometer (Molecular Devices, U.S.A.) with reference to a standard phosphate curve.
Intracellular rhodamine 123 and okadaic acid anthrylmethyl ester accumulation
HIT cells were incubated at 37°C in RPMI 1640 medium+10% FCS containing either 2.5 μg ml−1 rhodamine 123 for 3 h or 500 nM okadaic acid anthrylmethyl ester for 4 h. Then the cells were washed with PBS and lysed with n-butanol. After centrifugation the rhodamine 123 fluorescence (excitation 510 nm, emission 530 nm; Altenberg et al., 1994) or okadaic acid anthrylmethyl ester fluorescence (excitation 365 nm, emission 410 nm; Lee et al., 1987) in the supernatant was measured in a spectrofluorophotometer (Shimadzu, Japan) with reference to the respective standard curve. DNA was determined according to Labarca & Paigen (1980).
Northern blotting of pgp1 and pgp2
RNA of 5×10⁶ cells was isolated by guanidinium thiocyanate-phenol extraction (Chomczynski & Sacchi, 1987) and separated by electrophoresis through formaldehyde/agarose gels (20 μg RNA/lane). Subsequently RNA was transferred to a nylon membrane and hybridized with oligonucleotide probes labelled with 32P by incubating them with [γ-32P]-ATP (NEN, Köln, Germany) and T4 kinase (Gibco BRL, Eggenstein, Germany) for 1 h at 37°C. The oligonucleotide probes were either made to our specifications by Biometra (Göttingen, Germany) against hamster pgp1 (CCACTCCTGCTATTGCAATG), hamster pgp2 (TCAGAGGCAATGGTGTCACTCTG) or purchased from Oncogene (Schwalbach, Germany) against rat β-actin.
Statistical analysis
Values are given as mean±s.e.mean of the indicated number of independent experiments. Significance was assumed when P<0.05 in Student's unpaired t-test.
Results
To characterize the resistance against OA induced apoptosis in HIT100R cells, these and the parental HIT cells were incubated with different OA concentrations. In a viability assay the LC50 after 48 h increased from about 35 nM in HIT cells to about 250 nM in HIT100R cells (Figure 1A). As apoptotic markers cytochrome c release from mitochondria and caspase-3-like proteolytic activity were determined after incubation with OA for 12 or 24 h. Cytochrome c appeared in the cytosol of HIT cells already after a 12 h treatment with 100 nM OA. In HIT100R cells 100 nM OA did not induce a release of cytochrome c, neither after 12 h nor after 24 h. Increasing the concentration of OA to 500 nM resulted in a release of cytochrome c after 12 h (Figure 1B). With 100 nM OA the activation of caspase-3-like proteolytic activity could be shown to increase from 4±2 u mg−1 protein at 12 h to 95±22 u mg−1 protein at 24 h in HIT cells, while in accordance with the cytochrome c data no activation was detectable in HIT100R cells. With the 5 fold higher concentration of OA an activation of the caspase comparable to that observed with 100 nM OA in HIT cells could be shown in HIT100R cells (14±5 u mg−1 protein at 12 h to 76±16 u mg−1 protein at 24 h; Figure 1C).
Figure 1.

Apoptosis induction by OA in HIT and OA-resistant HIT100R cells. (A) Viability assay after treatment with 25–500 nM OA for 48 h relative to control (=100%). *P<0.05 in comparison with HIT cells; n=8. (B) Western blotting of cytochrome c (Cyt c) release into the cytosol from mitochondria in controls or after 12 and 24 h treatment with 100 nM and 500 nM OA. Representative of three experiments. (C) DEVD-pNA cleaving caspase activity in controls or after 12 and 24 treatment with 100 and 500 nM OA. *P<0.05 in comparison with respective controls; n=4–6.
In order to test whether more general mechanisms, e.g. changes in phosphatase activity or inhibition characteristics, might account for OA resistance, HIT and HIT100R cells were incubated with the structurally different phosphatase inhibitors calyculin A and cantharidic acid for 48 h and viability was determined. Calyculin A inhibits PP1 and PP2A with a similar IC50 of about 1 nM (Ishihara et al., 1989; Honkanen et al., 1994). In comparison to HIT cells, HIT100R cells showed a significantly increased survival rate in the concentration range from about 2–5 nM calyculin A (Figure 2A). Cantharidic acid (CA) is a phosphatase inhibitor that like OA displays a much lower IC50 for PP2A (about 50 nM) than for PP1 (about 500 nM; Li et al., 1993). Unexpectedly HIT100R cells appeared to be even slightly more affected than HIT cells in the viability assay (Figure 2B).
Figure 2.

Viability assay of HIT and OA-resistant HIT100R cells after 48 h treatment with the two structurally different phosphatase inhibitors (A) calyculin A (1.25–10 nM; n=8) and (B) CA (0.1–100 μM; n=6) relative to control (=100 %). *P<0.05 in comparison with HIT cells.
The results of the viability assay suggesting a missing cross-resistance to CA were confirmed by measuring the more specific parameters of apoptosis: cytochrome c release, caspase-3-like proteolytic activity and internucleosomal DNA fragmentation. After 12 h of incubation with 10 μM CA as well as after 24 h the signal for the released cytochrome c appeared more intense in HIT100R cells than in HIT cells (Figure 3A). In accordance with this observation a significant increase in caspase-3-like activity was already detectable after 12 h (59±17 u mg−1 protein; Figure 3B) in HIT100R cells which only slightly increased further after 24 h (80±22 u mg−1 protein; Figure 3B). In HIT cells a small, but significant increase of activation was detectable after 12 h (17±2 u mg−1 protein; Figure 3B) which increased further after 24 h (81±15 u mg−1 protein; Figure 3B) to about the same level as in HIT100R cells. In both cell lines internucleosomal DNA fragmentation was observed after 12 h and increased further after 24 h (Figure 3C).
Figure 3.

Apoptosis induction by CA in HIT and OA-resistant HIT100R cells. (A) Western blotting of cytochrome c (Cyt c) release into the cytosol from mitochondria in controls or after 12 and 24 h treatment with 10 μM CA. Representative of three experiments. (B) DEVD-pNA cleaving caspase activity in controls or after 12 and 24 h treatment with 10 μM CA. *P<0.05 in comparison with respective controls; n=6. (C) DNA fragmentation in controls or after 12 and 24 treatment with 10 μM CA. One kb is marked according to a 1 kb DNA ladder (Gibco BRL, Karlsruhe, Germany). Representative of two experiments.
Even though CA induced apoptotic cell death even faster in the OA resistant HIT100R cells than in HIT cells, the cross-resistance against calyculin A might still be due to changes in phosphatase activity as a possible mechanism of resistance of HIT100R cells.
To determine the actual activity of phosphatases in HIT cells we developed a colorimetric assay using casein as a substrate. PP2A has a high activity towards casein, while PP1 has only a low affinity to casein (MacKintosh, 1993). The overall activity in both cell lines was not significantly different (HIT: 1237.6±37.6 pmol released phosphate 10 μg−1 protein and HIT100R: 1082.3±66.7 pmol released phosphate 10 μg−1 protein; n=4). The inhibition characteristics for OA in both extracts were almost identical (Figure 4). Casein is also a substrate for PP2C. This phosphatase requires activation by Mg2+ and cannot be inhibited by OA (Cohen et al., 1989). The assay was accordingly carried out in the presence of 50 mM Mg2+ and 1000 nM OA to inhibit other phosphatases. The activity of PP2C was similar in both cell lines (data not shown).
Figure 4.

Inhibition of phosphatase activity by 0.1–1000 nM OA in HIT and OA-resistant HIT100R cells relative to control (=100%). Dephosphorylation of the substrate casein was quantified in a colorimetric malachite green assay; n=4.
Since differences in phosphatase activity did not seem to be responsible for the observed resistance, other mechanisms appeared to mediate OA-resistance in HIT100R cells. Because a 5 fold higher OA concentration was necessary, but also sufficient, to induce apoptosis in HIT100R cells, the intracellular accumulation of the compound might be compromised by enhanced drug extrusion in the resistant cells. A well known mechanism of reduced drug accumulation is the development of the multidrug resistance (MDR1) phenotype. The involved 170 kD P-glycoprotein is a member of the family of the ATP-binding cassette (ABC) plasma membrane transporters which can mediate an energy-dependent drug extrusion (Gottesman & Pastan, 1993).
To evaluate the functional relevance of the MDR1 phenotype HIT and HIT100R cells were incubated with the cytotoxic drugs vinblastine and cytosine arabinoside for 48 h and viability was determined. MDR cells are supposed to be resistant to vinblastine, but sensitive to cytosine arabinoside (Chin et al., 1993). Indeed the LC50 for vinblastine increased from about 60 nM in HIT cells to about 600 nM in HIT100R cells (Figure 5A). With cytosine arabinoside the survival rate of HIT100R cells was even slightly lower than that of HIT cells (Figure 5B). Such a cross-resistance against vinblastine but not cytosine arabinoside suggested a functional overexpression of the P-glycoprotein in HIT100R cells.
Figure 5.
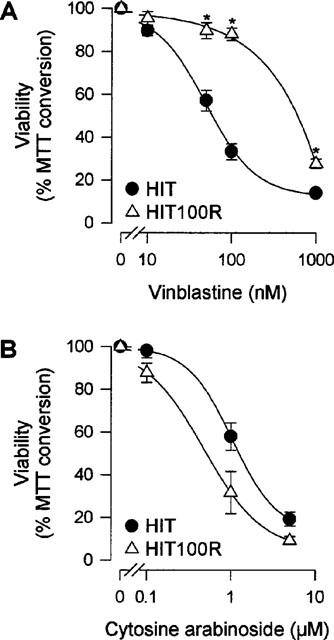
Viability assay of HIT and OA-resistant HIT100R cells after 48 h treatment with the cytotoxic drugs (A) vinblastine (10–1000 nM; n=6) and (B) cytosine arabinoside (0.1–5 μM; n=6) relative to control (=100%). *P<0.05 in comparison with HIT cells.
Next, the fluorescent dye and well established MDR substrate rhodamine 123 was used to quantify P-glycoprotein mediated efflux. In HIT100R cells intracellular accumulation of rhodamine 123 was reduced to about 60% of that in HIT cells (Figure 6A). The difference in accumulation between the two cell lines was even more pronounced when the fluorescent OA derivative okadaic acid anthrylmethyl ester was used. The intracellular accumulation of this compound was reduced to about 35% in HIT100R cells (Figure 6B) which supports our hypothesis that OA is a substrate of the P-glycoprotein.
Figure 6.

Characterization of the MDR phenotype in OA-resistant HIT100R cells. (A) Quantification of drug extrusion capacity by determining intracellular accumulation of the fluorescent MDR substrate rhodamine 123 (2.5 μg ml−1; n=3) after 3 h incubation or (B) the fluorescent OA derivative okadaic acid anthrylmethyl ester (Okadaic acid AME; 500 nM; n=4) after 4 h incubation. *P<0.05 in comparison with HIT cells. (C) Northern blotting of the MDR-conferring pgp1 gene.
In hamsters, two genes, pgp1 and pgp2, encode for a functional P-glycoprotein (Bellamy, 1996). The expression of both genes was studied in Northern blot analysis with both cell lines. A marked increase for the pgp1 signal could be shown in HIT100R cells when compared to the parental HIT cells (Figure 6C), while no pgp2 signal was detectable in HIT or in HIT100R cells (data not shown).
The functional importance of the P-glycoprotein for OA-induced apoptosis was further tested in viability assays with the MDR modulators verapamil and reserpine. MDR modulators are compounds that by interaction with the P-glycoprotein can reverse resistance towards cytotoxic drugs (Gottesman & Pastan, 1993). When 100 nM OA were added to HIT and HIT100R cells together with verapamil (10 μM) or reserpine (5 μM) toxicity was completely restored in the resistant cells. Both cell lines showed almost identical death rates of about 90% after 48 h (Figure 7).
Figure 7.

Viability assay of HIT and OA-resistant HIT100R cells after 48 h treatment with two MDR modulators, either verapamil (10 μM) or reserpine (5 μM), or with 100 nM OA or either modulator added together with 100 nM OA relative to control (=100%); n=8.
Discussion
In this study we compared the response of HIT cells and a 100 nM OA-resistant HIT cell line, HIT100R, to the apoptotic signalling by different serine/threonine phosphatase inhibitors. In addition, mechanisms of resistance against the apoptosis inducing action of OA in pancreatic beta cells were studied. The resistant cells were also tested for a potential cross-resistance towards the apoptosis inducing potency of the structurally different phosphatase inhibitors CA and calyculin A.
We have previously demonstrated by measuring morphological changes and DNA fragmentation that OA time- and concentration-dependently induced apoptotic cell death in HIT cells (Krautheim et al., 1999). In the present study we were able to show that cytochrome c release from mitochondria into the cytosol is an early event of OA-induced apoptosis. When HIT cells were treated with 100 nM OA for 12 h, cytochrome c release became detectable before any activation of caspase activity, measured by DEVD-pNA cleavage, could be observed. Comparable results were observed when HIT100R cells were treated with 500 nM OA for 12 h. Even though different OA concentrations are required for apoptosis induction, in both HIT cell lines the apoptotic signalling by OA appears to occur via cytochrome c release from mitochondria into the cytosol and subsequent activation of downstream-caspases like caspase-3.
Cytochrome c is known to be released in response to a variety of apoptotic stimuli (Mignotte & Vayssiere, 1998) and this was found to be an early event in u.v.b. irradiation- or staurosporine-induced apoptosis (Bossy-Wetzel et al., 1998). Based on these observations Sun et al. (1999) proposed a model for chemically-induced versus receptor-mediated apoptosis: undefined signals lead to perturbation of mitochondria with loss of cytochrome c which then initiates the caspase cascade by binding to the cytosolic protein Apaf-1 (Zou et al., 1997). In the presence of dATP this complex can bind and thus activate caspase-9 (Li et al., 1997), a member of the group of activator caspases (Thornberry, 1998). Active caspase-9 in turn is supposed to activate the effector caspase-3, -2 and/or -7 leading to DNA fragmentation and organised cell death. The finding that depletion of caspase-9 completely abrogated cytochrome c inducible activation of caspase-2, -3, -6, -7, -8 and -10 supports this model (Slee et al., 1999). Our results indicate that the mechanism of OA-induced apoptosis would fit into this scheme.
In HIT100R cells an about 5 fold higher OA concentration was necessary to induce similar apoptotic effects as 100 nM OA in HIT cells. A possible explanation for this observation could have been changes in overall serine/threonine phosphatase activity or a change in its sensitivity towards OA. Such alterations were shown for OA-resistant GH3 cells (Ritz et al., 1997), OA-resistant H69 cells (Takeda et al., 1994) and OA-resistant CHO cells, where a mutation in the PP2A catalytic subunit PP2Aα with a pronounced reduction of OA sensitivity was demonstrated (Shima et al., 1994). The cross-resistance of HIT100R cells against calyculin A, but not CA did not completely exclude such a possibility. Since the IC50 of OA is much lower for PP2A than for PP1 we would have primarily expected changes in PP2A activity. However, in the colorimetric phosphatase assay with the preferential PP2A substrate casein, we were unable to show differences in the amount of PP2A or PP2C activity or the sensitivity of PP2A activity towards inhibition by OA. Thus, such a mechanism which additionally would be controversial to the observed missing cross-resistance towards cantharidic acid did not seem to be involved in OA resistance in HIT100R cells.
HIT100R cells displayed a slightly increased sensitivity towards the apoptosis-inducing action of CA compared to parental HIT cells. In HIT100R cells 10 μM CA led to cytochrome c release after 12 h which went along with a rapid and pronounced DEVD-pNA cleaving caspase activity with no further prominent increase after 24 h. In HIT cells cytochrome c release after 12 h in the presence of cantharidic acid was accompanied by a small but more prominent increase in caspase activity than with 100 nM OA. After 24 h with both treatments caspase (DEVDase) activity reached comparable levels of about 80–90 u mg−1 protein. Thus, the onset of the downstream events of apoptosis by CA at this concentration appeared to occur faster than with OA. This observation was even more pronounced in the HIT100R cells where the maximal activation of DEVDase seemed to be reached already after 12 h. Despite these discrepancies the presented data support the conclusion that the apoptotic signalling of both phosphatase inhibitors appears to occur via the same effector pathway.
Another explanation for OA-resistance in HIT100R cells could be the development of a functional state that results in a compromised accumulation of the respective drugs. In case OA is a substrate of the P-glycoprotein a potential mechanism would be the MDR1 phenotype mediated by the P-glycoprotein (Gottesman & Pastan, 1993). OA has already been shown to enhance the activity of the human mdr-1 promoter (Uchiumi et al., 1993). The amplification of MDR conferring genes after continuous treatment with OA has also been described (Wang et al., 1995). The development of the MDR phenotype has been demonstrated to contribute to OA-resistance of other cell lines (Ritz et al., 1997; Tohda et al., 1994; Zheng et al., 1994) yet the reduced accumulation of the agent had not been demonstrated. An increased survival of HIT100R cells after treatment with the MDR substrate vinblastine strongly suggested the presence of a functional MDR phenotype. This hypothesis was further supported by the preserved, even slightly increased, sensitivity of HIT100R cells towards cytosine arabinoside, which cannot be extruded by the P-glycoprotein (Aran et al., 1999). This functional MDR1 phenotype coincides with an increased pgp1 expression in HIT100R cells. The cross-resistance towards the phosphatase inhibitor calyculin A might thus also be mediated by the MDR phenotype, while CA did not behave as a substrate. HIT100R cells appeared to display a slightly increased sensitivity towards the known non-MDR substrate cytosine arabinoside and according to the presented data the apparently non-substrate CA.
The extrusion capacity of the overexpressed P-glycoprotein can be quantitated by measuring the intracellular accumulation of known fluorescent MDR substrates, e.g. rhodamine 123. Data obtained with this agent seemed to underestimate the extent of the MDR phenotype since in HIT100R cells the accumulation of this dye was only about 40% less than in parental HIT cells. On the other hand the compromised accumulation of OA would be most convincingly measured by a labelled derivative of this toxin. Now, the fluorescent OA derivative okadaic acid anthrylmethyl ester is commercially available and was successfully used to compare its intracellular accumulation in parental HIT and HIT100R cells. The intracellular level of this derivative was strongly and more prominently reduced in HIT100R cells than that of rhodamine 123 indicating that OA is a MDR substrate. This conclusion is supported by the fact that the accumulation of this derivative was reduced by about 65% which correlates much better with the extent of resistance concluded from the functional data suggesting a 5–7 fold reduced sensitivity towards OA in HIT100R cells.
The observation that the addition of the MDR modulators verapamil or reserpine together with OA restored sensitivity and resulted in identical death rates in both cell lines provided further evidence for our conclusion that the expression of the P-glycoprotein appears to be the main factor for resistance of HIT100R cells against the apoptosis inducing action of OA and presumably calyculin A.
In summary, our results reveal that besides OA the structurally different phosphatase inhibitor CA can also induce apoptotic cell death in the pancreatic beta cell line HIT via caspase activation triggered by cytochrome c release. Resistance of HIT100R cells against apoptosis induction by 100 nM OA can be overcome by increasing the concentration of OA by about 5 fold. This altered response apparently is not the consequence of changes in phosphatase activity, but appears to be due to a deficiency in intracellular accumulation of OA and presumably calyculin A but not CA which is conferred by the MDR1 phenotype.
Acknowledgments
This work was supported by a grant from the Deutsche Forschungsgemeinschaft (Ste 422/4-2) to H.J. Steinfelder. We thank Dr I. Rustenbeck for critical reading of the manuscript, Dr K. Hirsch-Ernst for help with construction of the oligonucleotide probes and S. Blume for technical assistance with Northern blotting.
Abbreviations
- CA
cantharidic acid
- MDR
multidrug resistance
- OA
okadaic acid
References
- ALTENBERG G.A., VANOYE C.G., HORTON J.K., REUSS L. Unidirectional fluxes of rhodamine 123 in multidrug-resistant cells: evidence against direct drug extrusion from the plasma membrane. Proc. Natl. Acad. Sci. U.S.A. 1994;91:4654–4657. doi: 10.1073/pnas.91.11.4654. [DOI] [PMC free article] [PubMed] [Google Scholar]
- ÄMMÄLÄ C., ELIASSON L., BOKVIST K., BERGGREN P.O., HONKANEN R.E., SJÖHOLM A., RORSMAN P. Activation of protein kinases and inhibition of protein phosphatases play a central role in the regulation of exocytosis in mouse pancreatic beta cells. Proc. Natl. Acad. Sci. U.S.A. 1994;91:4343–4347. doi: 10.1073/pnas.91.10.4343. [DOI] [PMC free article] [PubMed] [Google Scholar]
- ARAN J.M., PASTAN I., GOTTESMAN M.M. Therapeutic strategies involving the multidrug resistance phenotype: the MDR1 gene as target, chemoprotectant, and selectable marker in gene therapy. Adv. Pharmacol. 1999;46:1–42. doi: 10.1016/s1054-3589(08)60468-8. [DOI] [PubMed] [Google Scholar]
- BELLAMY W.T. P-glycoproteins and multidrug resistance. Annu. Rev. Pharmacol. Toxicol. 1996;36:161–183. doi: 10.1146/annurev.pa.36.040196.001113. [DOI] [PubMed] [Google Scholar]
- BØE R., GJERTSEN B.T., VINTERMYR O.K., HOUGE G., LANOTTE M., DOSKELAND S.O. The protein phosphatase inhibitor okadaic acid induces morphological changes typical of apoptosis in mammalian cells. Exp. Cell. Res. 1991;195:237–246. doi: 10.1016/0014-4827(91)90523-w. [DOI] [PubMed] [Google Scholar]
- BOSSY-WETZEL E., NEWMEYER D.D., GREEN D.R. Mitochondrial cytochrome c release in apoptosis occurs upstream of DEVD-specific caspase activation and independently of mitochondrial transmembrane depolarization. EMBO J. 1998;17:37–49. doi: 10.1093/emboj/17.1.37. [DOI] [PMC free article] [PubMed] [Google Scholar]
- CHIN K.-V., PASTAN I., GOTTESMAN M.M. Function and regulation of the human multidrug resistance gene. Adv. Cancer Res. 1993;60:157–180. doi: 10.1016/s0065-230x(08)60825-8. [DOI] [PubMed] [Google Scholar]
- CHOMCZYNSKI P., SACCHI N. Single-step method for RNA isolation by guanidinium thiocyanate-phenol-chloroform extraction. Anal. Biochem. 1987;162:156–159. doi: 10.1006/abio.1987.9999. [DOI] [PubMed] [Google Scholar]
- COHEN P., HOLMES C.F.B., TSUKITANI Y. Okadaic acid: a new probe for the study of cellular regulation. Trends Biochem. Sci. 1990;15:98–102. doi: 10.1016/0968-0004(90)90192-e. [DOI] [PubMed] [Google Scholar]
- COHEN P., KLUMPP S., SCHELLING D.L. An improved procedure for identifying and quantitating protein phosphatases in mammalian tissues. FEBS Lett. 1989;250:596–600. doi: 10.1016/0014-5793(89)80803-8. [DOI] [PubMed] [Google Scholar]
- DARZYNKIEWICZ Z., LI X., GONG J. Controlled extraction of low molecular weight DNA from apoptotic cells. Methods Cell. Biol. 1994;41:26–27. [Google Scholar]
- GELADOPOULOS T.P., SOTIROUDIS T.G., EVANGELOPOULOS A.E. A malachite green colorimetric assay for protein phosphatase activity. Anal. Biochem. 1991;192:112–116. doi: 10.1016/0003-2697(91)90194-x. [DOI] [PubMed] [Google Scholar]
- GOTTESMAN M.M., PASTAN I. Biochemistry of multidrug resistance mediated by the multidrug transporter. Annu. Rev. Biochem. 1993;62:385–427. doi: 10.1146/annurev.bi.62.070193.002125. [DOI] [PubMed] [Google Scholar]
- HONKANEN R.E., CODISPOTI B.A., TSE K., BOYNTON A.L. Characterization of natural toxins with inhibitory activity against serine/threonine protein phosphatases. Toxicon. 1994;32:339–350. doi: 10.1016/0041-0101(94)90086-8. [DOI] [PubMed] [Google Scholar]
- ISHIHARA H., MARTIN B.L., BRAUTIGAN D.L., KARAKI H., OZAKI H., KATO Y., FUSETANI N., WATABE S., HASHIMOTO K., UEMURA D. Calyculin A and okadaic acid: inhibitors of protein phosphatase activity. Biochem. Biophys. Res. Commun. 1989;159:871–877. doi: 10.1016/0006-291x(89)92189-x. [DOI] [PubMed] [Google Scholar]
- JANJIC D., WOLLHEIM C.B. Islet cell metabolism is reflected by the MTT (tetrazolium) colorimetric assay. Diabetologia. 1992;35:482–485. doi: 10.1007/BF02342448. [DOI] [PubMed] [Google Scholar]
- KERR J.F., WYLLIE A.H., CURRIE A.R. Apoptosis: a basic biological phenomenon with wide-ranging implications in tissue kinetics. Br. J. Cancer. 1972;26:239–257. doi: 10.1038/bjc.1972.33. [DOI] [PMC free article] [PubMed] [Google Scholar]
- KRAUTHEIM A., RUSTENBECK I., STEINFELDER H.J. Phosphatase inhibitors induce defective hormone secretion in insulin-secreting cells and entry into apoptosis. Exp. Clin. Endocrinol. Diabetes. 1999;107:29–34. doi: 10.1055/s-0029-1212069. [DOI] [PubMed] [Google Scholar]
- KROEMER G., DALLAPORTA B., RESCHE-RIGON M. The mitochondrial death/life regulator in apoptosis and necrosis. Annu. Rev. Physiol. 1998;60:619–642. doi: 10.1146/annurev.physiol.60.1.619. [DOI] [PubMed] [Google Scholar]
- LABARCA C., PAIGEN K. A simple, rapid, and sensitive DNA assay procedure. Anal. Biochem. 1980;102:344–352. doi: 10.1016/0003-2697(80)90165-7. [DOI] [PubMed] [Google Scholar]
- LAEMMLI U.K. Cleavage of structural proteins during the assembly of the head of bacteriophage T4. Nature. 1970;227:680–685. doi: 10.1038/227680a0. [DOI] [PubMed] [Google Scholar]
- LEE J.S., YANAGI T., KENMA R., YASUMOTO T. Fluorometric determination of diarrhetic shellfish toxins by high-performance liquid chromatography. Agric. Biol. Chem. 1987;51:877–881. [Google Scholar]
- LI P., NIJHAWAN D., BUDIHARDJO I., SRINIVASULA S.M., AHMAD M., ALNEMRI E.S., WANG X. Cytochrome c and dATP-dependent formation of Apaf-1/caspase-9 complex initiates an apoptotic protease cascade. Cell. 1997;91:479–489. doi: 10.1016/s0092-8674(00)80434-1. [DOI] [PubMed] [Google Scholar]
- LI Y.-M., MACKINTOSH C., CASIDA J.E. Protein phosphatase 2A and its [3H]cantharidin/[3H]endothall thioanhydride binding site. Biochem. Pharmacol. 1993;46:1435–1443. doi: 10.1016/0006-2952(93)90109-a. [DOI] [PubMed] [Google Scholar]
- MACKINTOSH C.Assay and purification of (serine/threonine) phosphatases Protein phosphorylation. A practical approach 1993Oxford University Press: Oxford; 197–230.In: Hardie, D.G. (ed) [Google Scholar]
- MAURICIO D., MANDRUP-POULSEN T. Apoptosis and the pathogenesis of IDDM. A question of life and death. Diabetes. 1998;17:1537–1543. doi: 10.2337/diabetes.47.10.1537. [DOI] [PubMed] [Google Scholar]
- MIGNOTTE B., VAYSSIERE J.-L. Mitochondria and apoptosis. Eur. J. Biochem. 1998;252:1–15. doi: 10.1046/j.1432-1327.1998.2520001.x. [DOI] [PubMed] [Google Scholar]
- RITZ V., MARWITZ J., RICHTER E., ZIEMANN C., QUENTIN I., STEINFELDER H.J. Characterization of two pituitary GH3 cell sublines partially resistant to apoptosis induction by okadaic acid. Biochem. Pharmacol. 1997;54:967–971. doi: 10.1016/s0006-2952(97)00397-3. [DOI] [PubMed] [Google Scholar]
- SANTERRE R.F., COOK R.A., CRISEL R.M., SHARP J.D., SCHMIDT R.J., WILLIAMS D.C., WILSON C.P. Insulin synthesis in a clonal cell line of simian virus 40-transformed hamster pancreatic beta cells. Proc. Natl. Acad. Sci. U.S.A. 1981;78:4339–4343. doi: 10.1073/pnas.78.7.4339. [DOI] [PMC free article] [PubMed] [Google Scholar]
- SHIMA H., TOHDA H., AONUMA S., NAKAYASU M., DEPAOLI ROACH A.A., SUGIMURA T., NAGAO M. Characterization of the PP2Aα gene mutation in okadaic acid-resistant variants of CHO-K1 cells. Proc. Natl. Acad. Sci. U.S.A. 1994;91:9267–9271. doi: 10.1073/pnas.91.20.9267. [DOI] [PMC free article] [PubMed] [Google Scholar]
- SLEE E.A., HARTE M.T., KLUCK R.M., WOLF B.B., CASIANO C.A., NEWMEYER D.D., WANG H.-G., REED J.C., NICHOLSON D.W., ALNEMRI E.S., GREEN D.R., MARTIN S.J. Ordering the cytochrome c-initiated caspase cascade: hierarchical activation of caspases-2, -3, -6, -7, -8, and -10 in a caspase-9-dependent manner. J. Cell. Biol. 1999;144:281–292. doi: 10.1083/jcb.144.2.281. [DOI] [PMC free article] [PubMed] [Google Scholar]
- SUN X.-M., MACFARLANE M., ZHUANG J., WOLF B.B., GREEN D.R., COHEN G.M. Distinct caspase cascades are initiated in receptor-mediated and chemical induced apoptosis. J. Biol. Chem. 1999;274:5053–5060. doi: 10.1074/jbc.274.8.5053. [DOI] [PubMed] [Google Scholar]
- TAKEDA Y., NISHIO K., KUBOTA N., MIURA K., MORIKAGE T., OHMORI T., KUDOH S., NIITANI H., SAIJO N. Establishment of a human small-cell lung-cancer subline resistant to okadaic acid. Int. J. Cancer. 1994;58:882–890. doi: 10.1002/ijc.2910580623. [DOI] [PubMed] [Google Scholar]
- TERGAU F., WEICHERT J., QUENTIN I., OPITZ R., VON ZEZSCHWITZ C., MARWITZ J., RITZ V., STEINFELDER H.J. Inhibitors of ser/thr phosphatases 1 and 2A induce apoptosis in pituitary GH3 cells. Naunyn-Schmiedeberg's Arch. Pharmacol. 1997;356:8–16. doi: 10.1007/pl00005032. [DOI] [PubMed] [Google Scholar]
- THORNBERRY N.A. Caspases: key mediators of apoptosis. Chem. Biol. 1998;5:R97–R103. doi: 10.1016/s1074-5521(98)90615-9. [DOI] [PubMed] [Google Scholar]
- TOHDA H., YASUI A., YASUMOTO T., NAKAYASU M., SHIMA H., NAGAO M., SUGIMURA T. Chinese hamster ovary cells resistant to okadaic acid express a multidrug resistant phenotype. Biochem. Biophys. Res. Commun. 1994;203:1210–1216. doi: 10.1006/bbrc.1994.2311. [DOI] [PubMed] [Google Scholar]
- UCHIUMI T., KOHNO K., TANIMURA H., HIDAKA K., ASAKUNO K., ABE H., UCHIDA Y., KUWANO M. Involvement of protein kinase in environmental stress-induced activation of human multidrug resistance 1 (MDR1) gene promoter. FEBS Lett. 1993;326:11–16. doi: 10.1016/0014-5793(93)81750-t. [DOI] [PubMed] [Google Scholar]
- WANG S.-J., SCARVETTA R., LENZ H.-J., DANENBERG K., DANENBERG P.V., SCHÖNTHAL A.H. Gene amplification and multidrug resistance induced by the phosphatase-inhibitory tumor promoter, okadaic acid. Carcinogenesis. 1995;16:637–641. doi: 10.1093/carcin/16.3.637. [DOI] [PubMed] [Google Scholar]
- WYLLIE A.H., KERR J.F., CURRIE A.R. Cell death: the significance of apoptosis. Int. Rev. Cytol. 1980;68:251–306. doi: 10.1016/s0074-7696(08)62312-8. [DOI] [PubMed] [Google Scholar]
- ZHENG B., CHAMBERS T.C., RAYNOR R.L., MARKHAM P.N., GEBEL H.M., VOGLER W.R., KUO J.F. Human leukemia K562 cell mutant (K562/OA200) selected for resistance to okadaic acid (protein phosphatase inhibitor) lacks protein kinase C-epsilon, exhibits multidrug resistance phenotype, and expresses drug pump P-glycoprotein. J. Biol. Chem. 1994;269:12332–12338. [PubMed] [Google Scholar]
- ZOU H., HENZEL W.J., LIU X., LUTSCHG A., WANG X. Apaf-1, a human protein homologous to c. elegans CED-4, participates in cytochrome c-dependent activation of caspase-3. Cell. 1997;90:405–413. doi: 10.1016/s0092-8674(00)80501-2. [DOI] [PubMed] [Google Scholar]