

Abstract
Two splice isoforms of rabbit α1a-adrenergic receptor (AR), (named α1a-OCU.2-AR and α1a-OCU.3-AR) have been isolated from the liver cDNA library in addition to the previously reported isoform (α1a-OCU.1-AR). Although they have the identical splice position with human α1a-AR isoforms, the C-terminal sequences are distinct from those of human isoforms.
Among these rabbit α1a-AR isoforms, there are no significant differences in pharmacological properties: high affinity for prazosin, WB4101, KMD-3213 and YM617 and low affinity for BMY7378, using COS-7 cells expressing each isoform by radioligand binding assay.
Competitive reverse transcription-polymerase chain reaction (RT–PCR) analysis revealed that mRNA of α1a-ARs was expressed in liver, thoracic aorta, brain stem and thalamus of rabbit. The splice isoforms exhibited a distinct distribution pattern in rabbit; α1a-OCU.1-AR was expressed most abundantly in those tissues.
CHO clones, stably expressing each isoforms with receptor density 740 fmol mg−1 protein in α1a-OCU.1-AR, 1200 fmol mg−1 in α1a-OCU.2-AR and 570 fmol mg−1 in α1a-OCU.3-AR, respectively, showed a noradrenaline-induced increase in inositol trisphosphate which was suppressed by prazosin.
Noradrenaline elicited a concentration-dependent increase in extracellular acidification rate (EAR) in the CHO clones with pEC50 values of 6.19 for α1a-OCU.1-AR, 6.49 for α1a-OCU.2-AR and 6.58 for α1a-OCU.3-AR, respectively.
Noradrenaline caused a concentration-dependent increase in intracellular Ca2+ concentration ([Ca2+]i) in the CHO clones with pEC50 values of 6.14 for α1a-OCU.1-AR, 7.25 for α1a-OCU.2-AR and 7.70 for α1a-OCU.3-AR, respectively.
In conclusion, the present study shows the occurrence of three splice isoforms of rabbit α1a-AR, which are unique in C-terminal sequence and in tissue distribution. They show similar pharmacological profiles in binding studies but α1a-OCU.3-AR had the highest potency of noradrenaline in functional studies in spite of the lowest receptor density. These findings suggest that the structure of C-terminus of α1a-ARs may give the characteristic functional profile.
Keywords: α1a-Adrenoceptor, splice isoform, cDNA cloning, rabbit
Introduction
α1-ARs play critical roles in the regulation of the sympathetic system. Pharmacological studies initially suggested the existence of two distinct subtypes, α1A- and α1B-AR (Morrow & Creese, 1986; Han et al., 1987; Minneman et al., 1988). Using molecular cloning techniques, the existence of at least three receptor subtypes; α1a-, α1b- and α1d-AR have been revealed (Cotecchia et al., 1988; Schwinn et al., 1990; Lomansney et al., 1991; Perez et al., 1991), and pharmacological studies indicated that these cloned subtypes correspond to native α1A-, α1B- and α1D-AR subtypes, respectively (Ford et al., 1994; Hieble et al., 1995).
On the other hand, four isoforms of the human α1a-AR (α1a-HSA.1, 2, 3 and 4-AR) have been identified and are shown to be derived from alternative splicing with specific C-terminal domain (Hirasawa et al., 1995; Chang et al., 1998). Tissue distribution of mRNA of these isoforms in human showed that α1a-HSA.1-AR was expressed most abundantly in heart, liver and brain but α1a-HSA.4-AR was dominant in prostate. There are no significant differences in their pharmacological properties in binding, [Ca2+]i mobilization and inositol phosphate accumulation. The physiological significance of these human isoforms and those of other species remain to be determined.
Here we report the cloning, tissue distribution and characterization of rabbit α1a-AR splice isoforms.
Methods
cDNA library screening and DNA sequencing
cDNA clones were isolated as described previously (Miyamoto et al., 1997). Rabbit liver cDNA library in λZAPII (Stratagene) was screened with a 333 bp bovine α1a-AR fragment as a probe. The clones were reconstructed in mammalian expression vector pCR3 (Invitrogen). The nucleotide sequences were determined using overlapping templates by the dideoxy chain termination method using the ABI 373A DNA sequencer.
Cell culture and transfection
COS-7 cells were grown in Dulbecco's modified Eagle's medium supplemented with 10% foetal bovine serum (FBS). Transient transfection was carried out with Lipofectamine. (Gibco BRL), and the cells were harvested 72 h after transfection and stored at −80°C.
CHO cells (dhfr−) were grown in alpha minimum essential medium supplemented with 10% FBS. Transfection was carried out using lipofectamine (Gibco BRL) and stable transfectants were selected by G418 resistance (500 μg ml−1). Clonal cell lines were obtained by screening with [3H]-prazosin binding assays. The clones expressing the receptor isoforms with 740, 1200 and 570 fmol mg−1 protein for α1a-OCU.1-, 2- and 3-AR, respectively, were employed in this study.
Membrane preparation and binding experiment
The harvested cells were resuspended with ice-cold assay buffer (50 mM Tris-HCl, 1 mM EDTA, pH 7.4), sonicated and centrifuged at 3000×g for 10 min at 4°C. The supernatants were further centrifuged at 80,000×g for 30 min at 4°C and resulting pellets were resuspended in the assay buffer for the binding experiment.
Saturation was carried out in the range of 10–2000 pM of [3H]-prazosin (NEN). Displacement was carried out in the presence of 200 pM of [3H]-prazosin with various concentrations of the unlabelled drugs. Assays were performed in duplicate, and nonspecific binding was defined under the presence of 1 μM YM617. Membranes were incubated for 45 min at 30°C in a final 1 ml volume and then filtered onto Whatmann GF/C glass filters presoaked with 0.3% polyethyleneimine. The filters were washed three times with ice-cold wash buffer (50 mM Tris-HCl, pH 7.4) and the bound radioactivities were determined in a liquid scintillation counter. Nonlinear regression data analysis of saturation and competition binding assay was performed with Prism 2.0b (GraphPAD Software, San Diego, CA, U.S.A.). Protein concentrations were quantified by the method of Bradford using bovine serum albumin as standard (Bradford, 1976).
Total RNA preparation
Male Japanese white rabbits were anaesthetized with sodium pentobarbitone and were sacrificed by exsanguination. Tissues were rapidly removed, dissected and frozen in liquid nitrogen and then stored at −80°C. Total cellular RNA was isolated according to the procedure of Chomczynski & Sacchi (1987).
Construction and RNA synthesis of competitor
Tissue distribution of the three isoforms were examined by RT–PCR assays using a competitive internal standard. At first, a competitor DNA was constructed by inserting 72 bp Sau3AI fragment of pBluescript II into BglII site of rabbit α1a-OCU.1-AR. Next, we performed PCR with a pair of primer F and a megaprimer, the latter accommodates sequence of three isoform-specific primers in direct tandem alignment (Figure 1), resulting in an artificial chimeric DNA as competitor. The competitor DNA fragment was then subcloned into pBluescript to be transcribed with T7 RNA polymerase (Gibco BRL) to isolate competitor RNA. The following primers are used for α1a-ARs; 5′-CAT CGT GGT CGG CTG CTT CGT C-3′ as common forward primer (F) and 5′-GGC TGT AGT GCA GGC TGA TT-3′ as common reverse primer (R), and 5′-CCT TCT TTC TTT GCC CTT TCC TGT CCT CTA-3′ as isoform specific reverse primer for α1a-OCU.1-AR (SR1), 5′-ATT CTG AGC CCA CCC CCT TGA CAT T-3′ for α1a-OCU. 3-AR (SR3) and 5′-AGG GAG GGT GAG TGG GCT GTG-3′ for α1a-OCU.2-AR (SR2).
Figure 1.
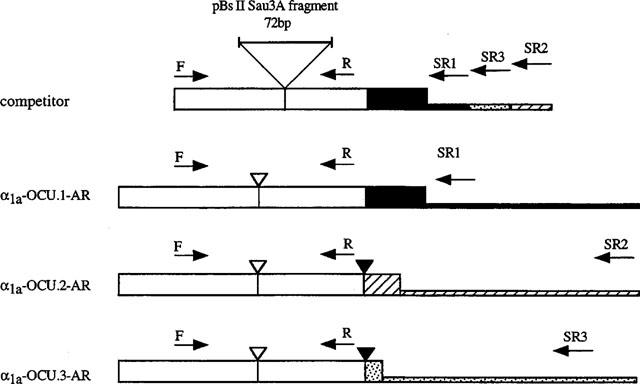
Schematic structure of competitor and cDNA of rabbit α1a-AR splice isoforms. The oligonucleotide primers (F: forward primer, R: reverse primer, SR: isoform specific reverse primer) are indicated by arrows. The competitor DNA was constructed by inserting 72 bp Sau3AI fragment of pBluescript II into BglII site of rabbit α1a-OCU.1-AR (large triangle). The tall boxes indicate the coding region and the short boxes at the 3′ end indicate the non-coding region. The common sequence among the rabbit α1a-AR isoforms is indicated by the open box and the isoform specific sequences are indicated by the closed box (α1a-OCU.1-AR), the hatched box (α1a-OCU.2-AR) and the dotted box (α1a-OCU.3-AR), respectively. In three isoforms, the open inverse triangles indicate the splice site that is common in α1-ARs, and the closed inverse triangles indicate alternative splice sites in α1a-ARs.
Relative competitive RT–PCR assay
To examine the relative mRNA level of total α1a-ARs in various tissues of rabbit, tissue RNA and competitor RNA was cotranscribed and coamplified by RT–PCR assay. Briefly, total RNA (250 ng) from each tissue was mixed with 1 pg of the competitor RNA (Figure 1) and then transcribed with M-MLV RT, Moloney Murine Leukaemia virus reverse transcriptase (Gibco BRL) using a random primer (dN6) at 37°C for 1 h. The resulting cDNA was amplified with Pwo polymerase (Boehringer Mannheim) using a pair of common primers (F and R) under the following conditions; 95°C for 2 min, and 30 cycles of three steps; at 95°C for 30 s, at 64°C for 10 s, at 72°C for 30 s. The PCR products were electrophoresed in 3.5% polyacrylamide gel and were stained with ethidium bromide. The intensity of bands was quantified with ATTO Densitograph System and the relative mRNA levels of total α1a-ARs in various tissues against that of cerebellum were calculated.
Quantitative competitive RT–PCR assay
To quantify the mRNA level of each α1a-AR isoform in some tissues of rabbit, a trace of competitor RNA was used in the RT–PCR assay. Briefly, the tissue RNA (250 ng) was premixed with increasing amounts of competitor RNA (0.3, 1, 3 and 10 pg) and was transcribed with M-MLV RT using a random primer. The resulting cDNA was amplified with Pwo polymerase using a pair of primers (F and either SR1, SR2 or SR3 in Figure 1) under the same conditions described above.
The PCR products were electrophoresed and the intensity of bands was quantified. The ratios of competing products to target products was plotted against the amount of the competing template added to each sample in logarithmic scale, and tissue mRNA content was calculated by interpolation of the resultant linear regression to the equivalent point, where the ratio of the competitor and native product was 1.
Inositol trisphosphate assay
Inositol trisphosphate accumulation was determined using inositol-1,4,5-trisphosphate [3H] radioreceptor assay kit (NEN). Briefly, CHO cells stably expressing each rabbit α1a-AR isoform were washed twice with FBS(−) medium, and incubated with the medium for 60 min. The cells were then stimulated by 10 μM noradrenaline for 30 s. Prazosin treatment (1 μM) was carried out 30 min before noradrenaline stimulation. The reaction was terminated by the immediate replacement of the medium with 4% perchloric acid. Samples were neutralized with 2 M KOH/10 mM HEPES buffer and used for inositol phosphate assay.
Microphysiometry
The method of microphysiometric assay is essentially described in the previous report (Taniguchi et al., 1999). Briefly, CHO cells expressing each isoform were seeded into microphysiometer cups at 200,000 cells per cup, 18–24 h prior to the experiment. Changes in extracellular pH were monitored in low buffering bicarbonate-free RPMI 1640 medium (Molecular Devices Corp.). The extracellular acidification rates (EARs) were measured in each 90 s pump cycle; flow on at 100 μl min−1 for 60 s, flow off for 30 s and the rates were recorded between 68 s and 88 s in the 90 s cycle. After equilibration for 90 min, 10 μM noradrenaline was applied twice and the second response was taken as control (100%). Then, the concentration-response curve for noradrenaline was obtained by noradrenaline application at 21 min intervals (three pump cycles to obtain response to a single concentration of noradrenaline and for washout with running medium). Curve fitting was performed by the sigmoidal concentration-response equation implemented with Prism software.
Intracellular Ca2+ response
Fifty per cent confluent CHO cells stably expressing each isoform in 100-mm culture dishes were trypsinized, suspended with the buffered salt solution (in mM): NaCl 137, KCl 5.4, MgCl2 1, CaCl2 1.5, glucose 10 and HEPES 10, pH 7.4, and incubated with 2 μM fura-2/AM (Wako) for 30 min at 37°C. The cells were then washed twice and resuspended in the buffered salt solution without the dye. Mobilizations of [Ca2+]i evoked by various concentrations of noradrenaline were monitored by a CAF-110 fluorescence spectrophotometer (Nihon Bunkoh, Tokyo, Japan) with dual excitation at 340 nm/380 nm and emission at 500 nm. Noradrenaline induced a rapid increase of [Ca2+]i in the transfected cells with a peak at around 20 s which was followed by plateau [Ca2+]i levels. Values at 20 s after stimulation were used to generate concentration-response curves. [Ca2+]i was calculated based on the formula described previously (Grynkiewicz et al., 1985).
Materials
The following drugs were used: [3H]-prazosin (77.2 Ci mmol), (NEN, Boston, U.S.A.); prazosin-hydrochloride, (−)-noradrenaline hydrochloride, adrenaline hydrochloride, methoxamine hydrochloride, and oxymetazoline hydrochloride (Sigma, St. Louis, U.S.A.); 2-(2,6-dimethoxy-phenoxyethyl)-aminomethyl-1,4-benzodioxane hydrochloride (WB4101) and 8-[2-[4-(2-methoxy-phenyl)-L-piperazinyl]-8-azaspiro [4,5] decane-7,9-dione dihydrochloride (BMY7378) (Research Biochemicals Inc., Natick, U.S.A.); tamsulosin HCl (YM617), (−) -(R)- 1-(3-hydroxypropyl)-5- [2- [[2- [2- (2,2,2-trifluoroethoxy)phenoxy]ethyl]amino]propyl]indoline-7-carboxamide (KMD-3213) (Kissei Pharmaceutical Co. Ltd., Matsumoto, Japan); α-ethyl-3, 4, 5-trimethoxy-α-(3-((2- (2-methoxyphenoxy) ethyl) amino)propyl) benzeneacetonitrile fumarate (HV-723) (Hokuriku Seiyaku, Katsuyama, Japan), and Fura-2/AM (Wako Pure Chemical Industries, Ltd. Osaka, Japan).
[3H]-prazosin was diluted in assay buffer. Prazosin was dissolved in 50% ethanol and diluted in distilled water. KMD-3213 was dissolved in dimethylsulphoxide and diluted in assay buffer. Noradrenaline and adrenaline were dissolved in distilled water and diluted in 0.1% ascorbic acid just before use. Other drugs were dissolved and diluted in distilled water.
Results
Screening the cDNA library
Screening of the cDNA library of rabbit liver with a DNA fragment of bovine α1a-AR identified two clones in addition to the previously reported rabbit α1a-AR (Miyamoto et al., 1997). The sequence of three clones revealed that most parts were identical except the 3′ region. Their deduced peptide sequences also showed a common part which included the N-terminal and seven transmembrane domains and had specific C-terminal domains (Figure 2A). Alternative splicing is likely to explain this, since human α1a-AR has also been shown to have four splice isoforms (Hirasawa et al., 1995; Chang et al., 1998). In fact, the position of tentative alternative splicing was identical to that of human and the C-terminal sequence of the longest one of rabbit had high homology with that of the α1a-HSA.1-AR (Figure 2B). Furthermore, in the case of α1a-OCU.1-AR, genomic PCR gave a product of identical size as that amplified in RT–PCR using a pair of primers, a forward primer designed in the second exon and SR1 (data not shown), indicating that there is no intron/alternative splicing for this isoform at the tentative splicing position. We thus concluded that these three were splice isoforms of rabbit α1a-AR and named them α1a-OCU.1-AR (466 aa), α1a-OCU.2-AR (429 aa) and α1a-OCU.3-AR (425 aa) respectively (Figure 2A). Although the C-terminal sequence of α1a-OCU.1-AR had high homology with the α1a-HSA.1-AR, those of α1a-OCU.2- and 3-AR were different to those of any human isoform (Figure 2B).
Figure 2.

(A) Nucleotide and amino acid sequences of the rabbit α1a-AR splice isoforms. The deduced amino acids sequence is shown under the nucleotide sequence and the termination codons are indicated by dots. The open arrow indicates the intron position (883–884 bp) and the closed arrow indicates the alternative splice site (1269–1270 bp). (B) Comparison of the amino acid sequences of the C-terminal region between rabbit and human α1a-AR isoforms. Identical amino acids are indicated by asterisks between α1a-OCU.1-AR and α1a-HSA.1-AR.
Radioligand binding assay
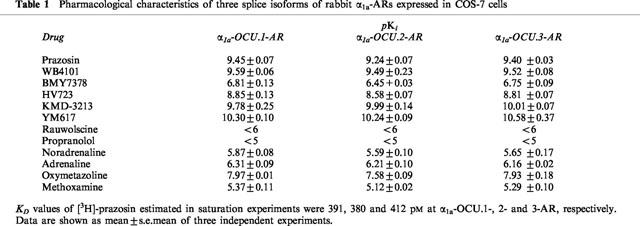
The pharmacological properties of the recombinant rabbit α1a-OCU.1-, 2- and 3-ARs, expressed in COS-7 cells, were compared in [3H]-prazosin binding experiments. As shown in Table 1, displacement binding studies showed that all three isoforms display the classical α1a-AR property, i.e. high affinity for prazosin (pKi=9.45, 9.24 and 9.40 at α1a-OCU.1-, 2- and 3-AR, respectively), WB4101 (pKi=9.59, 9.49 and 9.52), KMD-3213 (pKi=9,78, 9.99 and 10.01), YM617 (pKi=10.30, 10.24 and 10.58) and low affinity for BMY7378 (pKi=6.81, 6.45 and 6.75). There was no significant difference between the isoforms.
Table 1.
Pharmacological characteristics of three splice isoforms of rabbit α1a-ARs expressed in COS-7 cells
Tissue distribution of total α1a-ARs
Relative competitive RT–PCR assay using the primer pair (F and R) which were common for three α1a-AR isoforms showed relatively high expression of α1a-ARs in liver, thoracic aorta, brain stem and thalamus of rabbit (Table 2 and Figure 3). Although this distribution pattern is basically similar to other species, several tissues showed a difference. For example, mRNA of α1a-ARs was not detected in rabbit heart in contrast to human heart (Hirasawa et al., 1993; Graham et al., 1996) and rat heart (Rokosh et al., 1994; Graham et al., 1996). Additionally, rabbit submaxillary showed a very low mRNA level of α1a-ARs in contrast to rat submaxillary gland, which was pharmacologically defined as the α1a-AR predominant tissue (Michel et al., 1989) and confirmed a high expression level α1a-ARs in mRNA (Rokosh et al., 1994; Price et al., 1994; Graham et al., 1996).
Table 2.
Tissue distribution of mRNA of total α1a-AR isoforms in rabbit
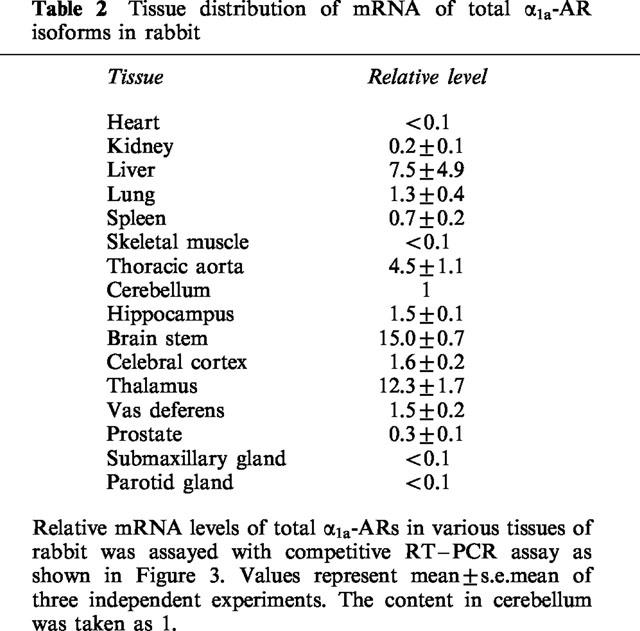
Figure 3.
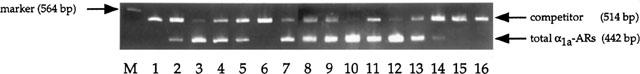
Relative competitive RT–PCR analysis of total α1a-ARs mRNA from various rabbit tissues. The products from tissue RNA (442 bp) and from competitor RNA (514 bp) are indicated by arrows on the right. Analysed rabbit tissues are heart, kidney, liver, lung, spleen, skeletal muscle, thoracic aorta, cerebellum, hippocampus, brain stem, cerebral cortex, thalamus, vas deferens, prostate, submaxillary gland, parotid gland from lanes 1–16, respectively. The λ/HindIII marker was run in lane M.
Quantitative competitive RT–PCR analysis
Isoform-specific competitive RT–PCR using isoform specific primer pairs (F and SR1 for α1a-OCU.1-AR, F and SR2 for α1a-OCU.2-AR, and F and SR3 for α1a-OCU.3-AR in Figure 1) revealed heterogeneous distribution of the three isoforms in liver, aorta, cerebellum, brain stem and prostate of rabbit (Figure 4). The relative expression levels of mRNA of α1a-OCU.1-, 2- and 3-AR in each tissue were as follows; 45, 28 and 27% in liver, 42, 47 and 11% in thoracic aorta, 62, 12 and 26% in cerebellum, 61, 22 and 17% in brain stem, 76, 10 and 14% in prostate, respectively. The α1a-OCU.1-AR was expressed abundantly in many tissues (Figure 5).
Figure 4.
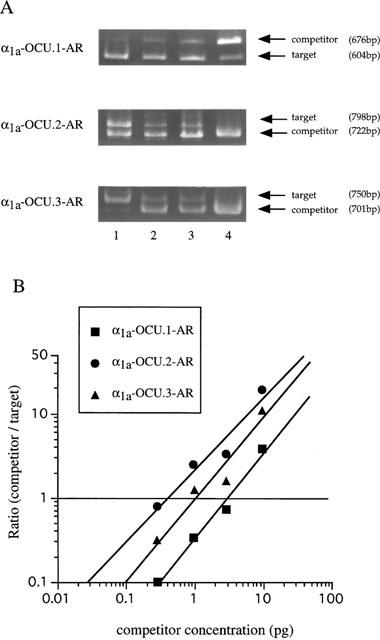
Quantitative competitive RT–PCR analysis of α1a-AR splice isoforms mRNA from rabbit cerebellum. (A) Lanes 1–4 represent α1a-AR RT–PCR products from 250 ng of cerebellum total RNA in the presence of 0.3, 1, 3 and 10 pg of competitor RNA. The sizes of PCR-amplified DNA fragment deduced from the sequence (see Figures 1 and 2) are as follows; 676 bp/604 bp in α1a-OCU.1-AR, 722 bp/798 bp in α1a-OCU.2-AR, 701 bp/750 bp in α1a-OCU.3-AR for competitor fragment/target fragment, respectively. (B) Estimation of mRNA level of α1a-AR isoforms in rabbit cerebellum. The ordinate represents the ratio of the intensity of PCR products and the abscissa represents the concentration of the competitor RNA in the reaction. Equivalent point where the ratio equals 1 means the same amount of α1a-AR mRNA as that of the added competitor.
Figure 5.
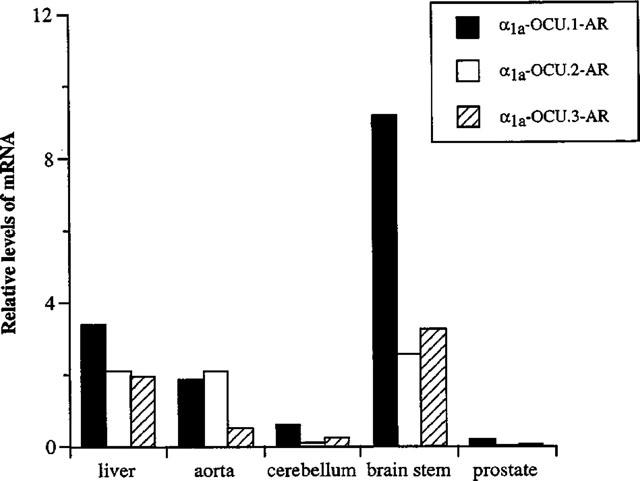
Relative mRNA levels of three α1a-AR splice isoforms in rabbit tissues. The results were obtained with quantitative competitive RT–PCR analysis as shown in Figure 4. Relative mRNA level means the relative amount of each splice isoform, in which the sum of three isoforms in the cerebellum was taken as 1. Values represent the mean of two independent experiments.
Inositol trisphosphate assay
In preliminary experiments, we examined the time course of noradrenaline-induced inositol trisphosphate accumulation in CHO cells expressing the rabbit α1a-AR isoforms and found that the maximum responses were usually observed at 20–30 s after stimulation (data not shown). Noradrenaline (10 μM) increased inositol trisphosphate accumulation in CHO cells expressing each isoform (158±14%, 213±45% and 220±37% for α1a-OCU.1-, 2- and 3-AR, respectively, compared with the basal level) and prazosin (1 μM) suppressed the accumulation induced by noradrenaline (Figure 6).
Figure 6.
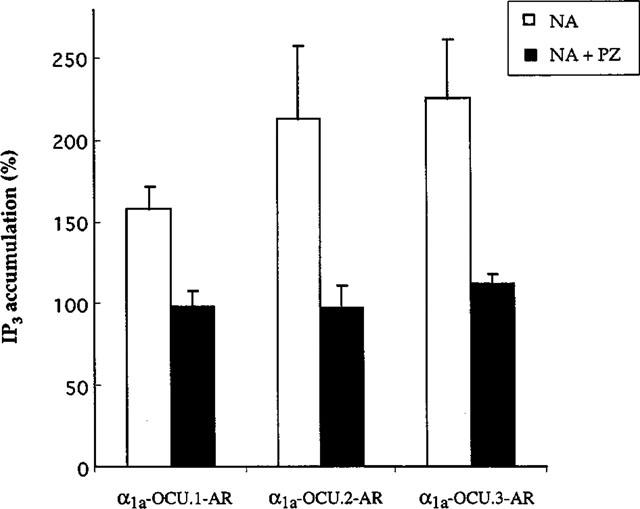
Inositol trisphosphate accumulation by noradrenaline in CHO clones expressing each rabbit α1a-AR isoform. The CHO cells were stimulated with 10 μM noradrenaline for 30 s. The level of IP3 is expressed as a percentage compared to the basal level. Prazosin at 1 μM inhibited the increase of IP3 (black column). The data represents mean±s.e.mean from three independent experiments.
Microphysiometry
As shown in Figure 7, the three isoforms that are stably expressed in CHO cells produced an increase in EAR in a concentration-dependent manner for noradrenaline. The pEC50 values for noradrenaline were 6.19±0.04, 6.49±0.08 and 6.58±0.07 for α1a-OCU.1-, 2- and 3-AR, respectively.
Figure 7.
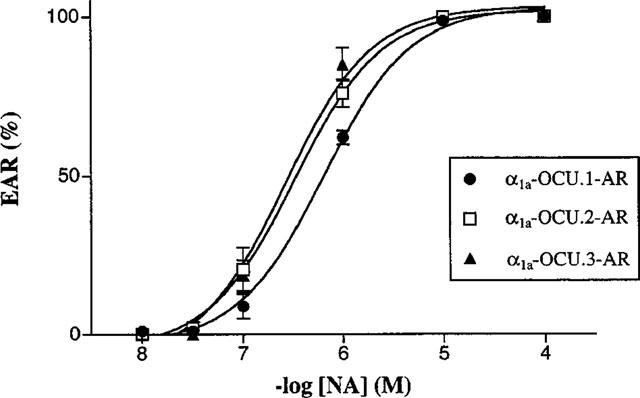
Concentration-dependent extracellular acidification rate (EAR) for noradrenaline. CHO clones expressing each rabbit α1a-AR isoform were prepared as described in Methods and EAR was measured using a microphysiometer. Results are expressed as relative values against the maximal response (100%) to preexposure of 10 μM noradrenaline in the same experiments. Each point represents mean±s.e.mean of 6–7 independent experiments.
Intracellular Ca2+ response
Noradrenaline caused a rapid increase in [Ca2+]i within 20 s after stimulation, followed by plateau levels (data not shown). The pEC50 values to noradrenaline were 6.14±0.06, 7.25±0.07 and 7.70±0.04 for α1a-OCU.1-, 2- and 3-AR, respectively (Figure 8).
Figure 8.
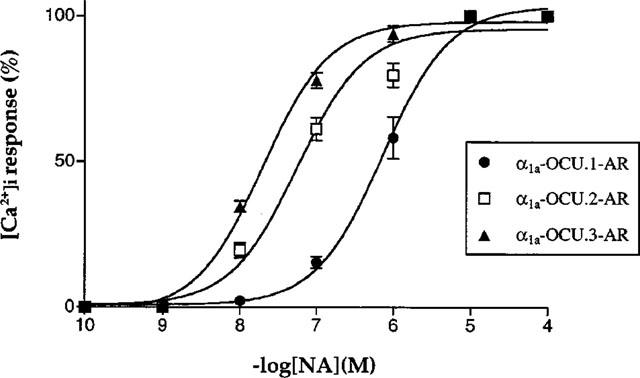
Concentration-dependent response of [Ca2+]i for noradrenaline. The CHO clones expressing each rabbit α1a-AR isoform were exposed with the indicated concentrations of noradrenaline (1 nM–100 μM), and [Ca2+]i was measured as described in Methods. Values are expressed as a percentage of the maximal response to 100 μM noradrenaline in each series of experiments. Each point represents mean±s.e.mean of 4–6 series of experiments.
Discussion
In the present study, we identified three α1a-AR isoforms from the rabbit liver cDNA library. They were derived from single gene by alternative splicing and consist of a common part, which includes the N-terminus and seven transmembrane domains, and an isoform-specific C-terminal part.
Total amino acid and nucleotide sequences of α1a-OCU.1-AR show high homology with those of α1a-ARs identified in other species (Schwinn et al., 1995; Laz et al., 1994; Xiao et al., 1998). On the other hand, C-terminal sequences of α1a-OCU.2- and 3-ARs were completely different from those of human α1a-AR isoforms, suggesting that the isoforms are species specific in structure.
It is pointed out that there is no expression of any α1a-AR isoforms in rabbit heart, whereas the presence of α1a-AR has been demonstrated in the hearts of other species (Graham et al., 1996; Rokosh et al., 1994; Hirasawa et al., 1993). Recently we confirmed a lack of α1a-AR in rabbit heart in binding experiments, i.e. a non-selective radioligand [3H]-prazosin showed a significant binding but an α1a-AR selective ligand [3H]-KMD-3213 (Murata et al., 1999) did not (unpublished observations).
Three isoforms are expressed widely in rabbit tissues showing different patterns of distribution. This implicates that some functional differences may exist in these isoforms though their pharmacological profiles are similar. To investigate the possibility that the differences in the C-terminus of rabbit α1a-AR isoforms produces distinct functional properties, we tested their functional ability in cytosolic inositol trisphosphate production, extracellular acidification and intracellular Ca2+ recruitment employing CHO cells expressing rabbit α1a-AR isoforms. First, cytosolic inositol trisphosphate was increased in response to noradrenaline which was suppressed by prazosin (Figure 6). Second, the CHO cells showed increases in EAR in a concentration-dependent manner for noradrenaline with pEC50 values of 6.19, 6.49 and 6.58 for α1a-OCU.1-, 2- and 3-AR, respectively (Figure 7). Third, the CHO cells exhibited increases in [Ca2+]i in a concentration-dependent manner for noradrenaline with pEC50 values of 6.14, 7.25 and 7.70 for α1a-OCU.1-, 2- and 3-AR, respectively (Figure 8). Further, we could not detect any significant accumulation of cyclic AMP in response to noradrenaline in any rabbit α1a-AR isoforms (data not shown). These results suggest that all these isoforms of rabbit α1a-AR also couple with Gq/11 protein to transduce noradrenaline signals into the cells as reported in α1a-ARs of other species (Minneman et al., 1988; Graham et al., 1996).
However, it is interesting to note that rank order of potency for noradrenaline differs among the isoforms; α1a-OCU.3-AR=α1a-OCU.2-AR>α1a-OCU.1-AR in EAR response and α1a-OCU.3-AR>α1a-OCU.2-AR>α1a-OCU.1-AR in [Ca2+]i response. This order is not in parallel with expressed receptor density (740, 1200 and 570 fmol mg−1 protein for α1a-OCU.1-, 2- and 3-AR, respectively). These results strongly suggest that the variation of the C-terminus in α1a-AR may give distinct functional characters, although this point should be explored in further experiments.
In conclusion, the present study showed the occurrence of three splice isoforms of rabbit α1a-AR, which are unique in C-terminal sequence and in tissue distribution. They showed similar pharmacological profiles in binding studies but α1a-OCU.3-AR has the highest potency for noradrenaline in functional studies in spite of having the lowest receptor density. These results suggest that the structure of the C-terminus of α1a-AR may supply the characteristic functional profile. However, physiological, functional and developmental significance of the α1a-AR isoforms remains to be clarified.
Acknowledgments
The authors would like to thank Ms N. Aoki for secretarial assistance and Ms N. Saitoh for technical assistance. This work is supported in part by grant from the Smoking Research Foundation of Japan and by Grant-in-Aid for Scientific Research from the Ministry of Education, Science, Sports and Culture of Japan. GenBank accession numbers are as follows: U81982 for α1a-OCU.1-AR, AF157505 for α1a-OCU.2-AR and AF157506 for α1a-OCU.3-AR, respectively.
Abbreviations
- AR
adrenoceptor
- [Ca2+]i
intracellular Ca2+ concentration
- CHO cells
Chinese hamster ovary cells
- EAR
extracellular acidification rate
- FBS
foetal bovine serum
- RT–PCR
reverse transcriptase-polymerase chain reaction
References
- BRADFORD M.M. A rapid and sensitive method for the quantitation of microgram quantities of protein utilizing the principle of protein-dye binding. Anal. Biochem. 1976;72:248–254. doi: 10.1016/0003-2697(76)90527-3. [DOI] [PubMed] [Google Scholar]
- CHANG D.J., CHANG T.K., YAMANISHI S.S., SALAZAR F.H.R., KOSAKA A.H., KHARE R., BHAKTA S., JASPER J.R., SHIEH ING-SHIN., LESNICK J.D., FORD A.P.D.W., DANIELS D.V., EGLE R.M., CLARKE D.E., BACH C., CHAN H.W. Molecular cloning, genomic characterization and expression of novel human α1A-adrenoceptor isoforms. FEBS Lett. 1998;422:279–283. doi: 10.1016/s0014-5793(98)00024-6. [DOI] [PubMed] [Google Scholar]
- CHOMCZYNSKI P., SACCHI N. Single-step method of RNA isolation by acid guanidinium thiocyanate-phenol-chloroform extraction. Anal. Biochem. 1987;162:156–159. doi: 10.1006/abio.1987.9999. [DOI] [PubMed] [Google Scholar]
- COTECCHIA S., SCHWINN D.A., RANDALL R.R., LEFKOWITZ R.J., CARON M.G., KOBILKA B.K. Molecular cloning and expression of cDNA for the hamster α1-adrenergic receptor. Proc. Natl. Acad. Sci. U.S.A. 1988;85:7159–7163. doi: 10.1073/pnas.85.19.7159. [DOI] [PMC free article] [PubMed] [Google Scholar]
- FORD A.P., WILLIAMS T.J., BLUE D.R., CLARKE D.E. Alpha 1-adrenoceptor classification: sharpening Occam's razor. Trends Pharmacol. Sci. 1994;15:167–170. doi: 10.1016/0165-6147(94)90136-8. [DOI] [PubMed] [Google Scholar]
- GRAHAM R.M., PEREZ D.M., HWA J., PIASCIK M.T. α1-Adrenergic receptor subtypes. Circ. Res. 1996;78:737–749. doi: 10.1161/01.res.78.5.737. [DOI] [PubMed] [Google Scholar]
- GRYNKIEWICZ G., POENIE M., TSIEN R.T. A new generation of Ca2+ indicators with greatly improved fluorescence properties. J. Biol. Chem. 1985;260:3440–3450. [PubMed] [Google Scholar]
- HAN C., ABEL P.W., MINNEMAN K.P. Alpha 1-adrenoceptor subtypes linked to different mechanisms for increasing intracellular Ca2+ in smooth muscle. Nature. 1987;329:333–335. doi: 10.1038/329333a0. [DOI] [PubMed] [Google Scholar]
- HIEBLE J.P., BYLUND D.B., CLARKE D.E., EIKENBURG D.C., LANGER S.Z., LEFKOWITZ R.J., MINNEMAN K.P., RUFFOLO R.J. Recommendation for nomenclature of α1-adrenoceptors: consensus update. Pharmacol. Rev. 1995;47:267–270. [PubMed] [Google Scholar]
- HIRASAWA A., HORIE K., TANAKA T., TAKAGAKI K., MURAI M., YANO J., TSUJIMOTO G. Cloning, functional expression and tissue distribution of human cDNA for the α1c-adrenergic receptor. Biochem. Biophys. Res. Commun. 1993;195:902–909. doi: 10.1006/bbrc.1993.2130. [DOI] [PubMed] [Google Scholar]
- HIRASAWA A., SHIBATA K., HORIE K., TAKEI Y., OBIKA K., TANAKA T., MURAMOTO N., TAKAGAKI K., YANA J., TSUJIMOTO G. Cloning, functional expression and tissue distribution of human α1c-adrenoceptor splice variants. FEBS Lett. 1995;363:256–260. doi: 10.1016/0014-5793(95)00330-c. [DOI] [PubMed] [Google Scholar]
- LAZ T.M., FORRAY C., SMITH K.E., BARD J.A., VAYSSE P.J. The rat homologue of the bovine α1c-adrenergic receptor shows the pharmacological properties of the classical α1A subtype. Mol. Pharmacol. 1994;46:414–422. [PubMed] [Google Scholar]
- LOMANSNEY J.W., COTTECHIA S., LORENZ W., LEUNG W.-Y., SCHWINN D.A., YANG-FENG T.L., BROWNSTEIN M., LEFKOWITZ R. J., CARON M.G. Molecular cloning and expression of cDNA for the α1A-adrenergic receptor. J. Biol. Chem. 1991;266:6365–6369. [PubMed] [Google Scholar]
- MICHEL A.D., LOURY D.N., WHITING R.L. Identification of a single alpha 1-adrenoceptor corresponding to the alpha 1A-subtype in rat submaxillary gland. Br. J. Pharmacol. 1989;98:883–889. doi: 10.1111/j.1476-5381.1989.tb14617.x. [DOI] [PMC free article] [PubMed] [Google Scholar]
- MINNEMAN K.P. Alpha 1-adrenergic receptor subtypes, inositol phosphates, and sources of cell calcium. Pharmacol. Rev. 1988;40:87–119. [PubMed] [Google Scholar]
- MIYAMOTO S., TANIGUCHI T., SUZUKI F., TAKITA M., KOSAKA N., NEGORO E., OKUDA T., KOSAKA H., MURATA S., NAKAMURA S., AKAGI Y., OSHITA M., WATANABE Y., MURAMATSU I. Cloning, functional expression and tissue distribution of rabbit α1a-adrenoceptor. Life Sciences. 1997;60:2069–2074. doi: 10.1016/s0024-3205(97)00194-x. [DOI] [PubMed] [Google Scholar]
- MORROW A.L., CREESE I. Characterization of alpha 1-adrenergic receptor subtypes in rat brain: A reevaluation of [3H] WB4101 and [3H] prazosin binding. Mol. Pharmacol. 1986;29:321–330. [PubMed] [Google Scholar]
- MURATA S., TANIGUCHI T., MURAMATSU I. Pharmacological analysis of the novel, selective α1-adrenoceptor antagonist, KMD-3213 and its suitability as a tritiated radioligand. Br. J. Pharmacol. 1999;127:19–26. doi: 10.1038/sj.bjp.0702489. [DOI] [PMC free article] [PubMed] [Google Scholar]
- PEREZ D.M., PIASIK M.T., GRAHAM R.M. Solution-phase library screening for the identification of rare clones: Isolation of an α1D-adrenergic receptor cDNA. Mol. Pharmacol. 1991;40:876–883. [PubMed] [Google Scholar]
- PRICE D.T., CHARI R.S., BERKOWITZ D.E., MEYERS W., SCHWINN D.A. Expression of α1-adrenergic receptor subtype mRNA in rat tissues and human SK-N-MC neuronal cells: implications of α1-adrenergic receptor subtype classification. Mol. Pharmacol. 1994;46:221–226. [PubMed] [Google Scholar]
- ROKOSH D.G., BAILEY B.A., STEWART A.F.R., KARNS L.R., LONG C.S., SIMPSON P.C. Distribution of α1C-adrenergic receptor mRNA in adult rat tissue by RNase protection assay and comparison with α1B and α1D. Biophys. Res. Commun. 1994;200:1177–1184. doi: 10.1006/bbrc.1994.1575. [DOI] [PubMed] [Google Scholar]
- SCHWINN D.A., JHONSTON G.I., PAGE S.O., MOSLEY M.J., WILSON K.H., WORMAN N.P., CAMPBELL S., FIDOCK M.D., FURNESS L.M., PARRY-SMITH D.J., PETER B., BAILEY D.S. Cloning and pharmacological characterization of human alpha-1 adrenergic receptors: Sequence corrections and direct comparison with other species homologues. J. Pharmacol. Exp. Ther. 1995;272:134–142. [PubMed] [Google Scholar]
- SCHWINN D.A., LOMANSNEY J.W., LORENZ W., SZKLUT P.J., FREMEAU R.T., YANG-FENG T.L., CARON M.G., LEFKOWITZ R.J., COTECCHIA S. Molecular cloning and expression of the cDNA for a novel α1-adrenergic receptor subtype. J. Biol. Chem. 1990;265:8183–8189. [PubMed] [Google Scholar]
- TANIGUCHI T., INAGAKI R., MURATA S., AKIBA I., MURAMATSU I. Microphysiometric analysis of human α1a-adrenoceptor expressed in Chinese hamster ovary cells. Br. J. Pharmacol. 1999;127:962–968. doi: 10.1038/sj.bjp.0702609. [DOI] [PMC free article] [PubMed] [Google Scholar]
- XIAO L., SCOFIELD M.A., JEFFRIES W.B. Molecular cloning, expression and characterization of cDNA encoding a mouse α1a-adrenoceptor. Br. J. Pharmacol. 1998;124:213–221. doi: 10.1038/sj.bjp.0701812. [DOI] [PMC free article] [PubMed] [Google Scholar]