Abstract
The effects of bile acids on intracellular Ca2+ concentration [Ca2+]i and nitric oxide production were investigated in vascular endothelial cells.
Whole-cell patch clamp techniques and fluorescence measurements of [Ca2+]i were applied in vascular endothelial cells obtained from human umbilical and calf aortic endothelial cells. Nitric oxide released was determined by measuring the concentration of NO2−.
Deoxycholic acid, chenodeoxycholic acid and the taurine conjugates increased [Ca2+]i concentration-dependently, while cholic acid showed no significant effect. These effects resulted from the first mobilization of Ca2+ from an inositol 1,4,5-triphosphate (IP3)-sensitive store, which was released by ATP, then followed by Ca2+ influx.
Both bile acids and ATP induced the activation of Ca2+-dependent K+ current. Oscillations of [Ca2+]i were occasionally monitored with the Ca2+-dependent K+ current in voltage-clamped cells and Ca2+ measurements of single cells.
The intracellular perfusion of heparin completely abolished the ATP effect, but failed to inhibit the bile acid effect.
Deoxycholic acid and chenodeoxycholic acid enhanced NO2− production concentration-dependently, while cholic acid did not enhance it.
The bile acids-induced nitric oxide production was suppressed by NG-nitro-L-arginine methyl ester, exclusion of extracellular Ca2+ or N-(6-aminohexyl)-5-chloro-l-naphthalenesulphonamide hydrochloride (W-7) and calmidazolium, calmodulin inhibitors.
These results provide novel evidence showing that bile acids increase [Ca2+]i and subsequently nitric oxide production in vascular endothelial cells. The nitric oxide production induced by bile acids may be involved in the pathogenesis of circulatory abnormalities in liver diseases including cirrhosis.
Keywords: Bile acids, vascular endothelial cells, intracellular calcium, nitric oxide, whole-cell clamp techniques
Introduction
Cirrhosis is associated with marked abnormalities in the systemic circulation. The most common haemodynamic changes in patients with cirrhosis are an increase in cardiac output, a decrease in total systemic vascular resistance and a decrease in arterial pressure (Bosch et al., 1988; Schrier et al., 1988; Groszmann, 1994; Bernardi et al., 1995; Bernardi & Trevisani, 1997; Moller et al., 1997). A reduced presser effect of vasoconstrictor substrates is also a well-documented phenomenon in both humans and animals with cirrhosis (MacGilchrist et al., 1991; Hartleb et al., 1994). Aortic rings from rats with cirrhosis contracted less response to angiotensin II or phenylephrine than aortic rings from normal rats (Castro et al., 1993; Weigert et al., 1995). The basic mechanisms have not yet been clearly elucidated, but, recently, studies in animals and humans have provided evidence suggesting that nitric oxide has an important role in the haemodynamic abnormalities that characterize cirrhosis (Vallance & Moncada, 1991; Niederberger et al., 1995a,1995b; Ros et al., 1995;Martin et al., 1998). Patients with cirrhosis have higher plasma and exhaled air concentration of nitric oxide than normal subjects (Guarner et al., 1993; Matsumoto et al., 1995; Sogni et al., 1995; Battista et al., 1997). The inhibition of nitric oxide synthase such as NG-nitro-L-arginine methyl ester not only restores vascular nitric oxide production but also systemic haemodynamics to normal (Pizcueta et al., 1992; Claria et al., 1992; Weigert et al., 1995; Niederberger et al., 1995a,1995b). The vascular response to vasoconstrictors is also restored by endothelial denudation (Weigert et al., 1995). Thus, these observations implicated increased nitric oxide synthesis of endothelial origin in the haemodynamic changes of cirrhosis. However, the initial cause of overproduction of nitric oxide in vascular endothelial cells has not yet been known.
Bile acids are actively secreted and extracted by the liver. Plasma concentrations of bile acids are usually elevated in patients with cirrhosis (Carey, 1958; Makino et al., 1969; 1975; LaRusso et al., 1975; Clain et al., 1977; Pennington et al., 1977), and they have physiological vasoactive properties. Studies on animals show that obstructive jaundice or isolated cholaemia produced by choleductocaval anastomoses induces arterial hypotension due to peripheral vasodilation (Alon et al., 1982; Bomzon et al., 1984; Pak & Lee, 1993), and blunted peripheral presser responses to contractile substrates (noradrenaline and angiotensin) (Finberg et al., 1981; 1982), which are quite similar to haemodynamic changes observed in cirrhosis. Thus, it is most likely that bile acids are implicated as responsible for the haemodynamic changes in cirrhosis, and may act on vascular endothelial cells, then enhancing nitric oxide production. However, until now, the effects of bile acids on vascular endothelial cells have not been investigated.
Therefore, the purpose of the present study was to clarify the effects of bile acids on intracellular Ca2+ concentration and nitric oxide production in vascular endothelial cells. Here, we have provided novel evidence showing that bile acids increase [Ca2+]i and then enhance nitric oxide production in vascular endothelial cells.
Methods
Solutions and drugs
The composition of the standard Tyrode solution was as follows (in mM): NaCl 136.5, KCl 5.4, CaCl2 1.8, MgCl2 0.53, glucose 5.5, HEPES-NaOH buffer 5 (pH 7.4). The Ca2+-free bathing solution was the same as the normal Tyrode solution except that CaCl2 was omitted and 0.1 mM EGTA was added to the solution (pH 7.4). In whole-cell recordings, the patch pipette contained (in mM): KCl 140, EGTA 0.01, MgCl2 2, Na2ATP 3, guanosine-5′-triphosphate (GTP, sodium salt, Sigma) 0.1 and HEPES-KOH buffer 5 (pH 7.2). In some experiments, EGTA (10 mM), inositol 1,4,5-triphosphate (100 μM) or heparin (1 mg ml−1, Sigma) was included in the patch pipette. Deoxycholic acid (Na salt), chenodeoxycholic acid (Na salt), cholic acid (Na salt), taurodeoxycholic acid (Na salt), taurochenodeoxycholic acid (Na salt), taurocholic acid (Na salt), ATP (Na salt) and calmidazolium, a calmodulin inhibitor, were purchased from Sigma (St. Louis, MO, U.S.A.). N-(6-aminohexyl)-5-chloro-l-naphthalenesulphonamide hydrochloride (W-7), a calmodulin inhibitor, was obtained from Seikagaku Corporation (Tokyo, Japan), NG-nitro-L-arginine methyl ester (L-NAME), and inositol 1,4,5-triphosphate was purchased from Sigma.
Cell preparation
Endothelial cells were enzymatically isolated from bovine aorta and from human umbilical veins obtained from umbilical cords at delivery as previously described (Wang et al., 1996; Okuda et al., 1997), and then cultured. Fresh human umbilical cords were kindly supplied from the Department of Obstetrics and Gynecology, Tsukuba University Hospital. The cells were identified as endothelial cells both morphologically and biochemically. The expression of factor VIII antigen on the cell surface was confirmed by immunostaining with fluorescin-conjugated antibody and cell production of prostacyclin was also examined by radioimmunoassay. Cultured cells were maintained in MCDB-107 medium supplemented with 15% foetal calf serum, HEPES (7.15 mg ml−1), endothelial mitogen (50 μg ml−1), heparin (5 μg ml−1), penicillin (50 units ml−1) and streptomycin (50 μg ml−1) in an atmosphere of 5% CO2 and 95% air at 37°C in 25-cm2 flasks. At confluence, cells were split 1 : 3 after they were detached using 0.25% trypsin in 0.02% EDTA. Media were changed twice weekly. All cultures were used within 3 weeks of establishing primary cultures and at the third to fifth passage. The cell viability determined by trypan blue exclusion in control and 24 h after the application of deoxycholic acid (300 and 750 μM) was approximately 91% in control, 90% (300 μM) and 87% (750 μM), respectively.
Determination of cytosolic free Ca2+ concentration from the cell suspension
Cytosolic free Ca2+ concentration ([Ca2+]i) of cell suspensions was determined using the fluorescence method as described previously (Grynkiewcz et al., 1985; Asano et al., 1998). Fura-2 acetoxymethyl ester (fura-2 AM) was obtained from Dojin Chemicals (Japan). Endothelial cells were trypsinized, washed twice in the standard solution, adjusted to a cell density of 106 cells ml−1 and loaded with 1 μM fura-2 AM for 60 min in a 20°C-shaking water bath. After incubation, the medium containing fura-2 AM was removed, and fluorescent cells in suspensions were measured at 37°C while stirred continuously in a cuvette placed by a spectrofluorometer (CAF-100, JASCO Co, Ltd., Tokyo, Japan). The excitation wavelengths were 340 and 380 nm, and emission was 500 nm. In the evaluation of Ca2+ responses, the amplitude of Ca2+ elevation in response to each stimulant was calculated by using the percentage of increase of F340/F380 with reference to the value at the resting state.
Measurements of [Ca2+]i by two-dimensional image analysis in individual cells
[Ca2+]i within individual cells was analysed as previously described with modification (Shin et al., 1992; Wang et al., 1996). The fura-2-loaded cells in a glass dish were placed on an inverted fluoromicroscope (Olympus, Japan) with a UV-fluor objective lens (×20) for epifluorescence measurement and a 175-W xenon lamp. Cells were excited at 340 or 380 nm u.v. wave using interference filters for 2 s and an emission spectrum of fura-2 above 400 nm (by a dichroic mirror) was focused on a CCD camera (FE 250, Olympus, Japan). The digitized fura-2 images were recorded and the 2-D ratio image (340/380 nm) was reconstructed after background subtraction (Merlin®, Olympus, Japan). Significant leaking of fura-2 did not occur during each experiment, evidenced by the increment of autofluorescence in the incubation medium. All procedures including the addition of drugs to the medium were performed under dark conditions, and illumination time was minimized to prevent the photobleaching of fura-2.
Determination of nitric oxide (NO)
NO released from endothelial cells was determined by measuring the concentration of [NO2−] in cultured medium using the Griess test (Wood et al., 1990; Okuda et al., 1997). Confluent monolayers cultured in 35 mm dishes were washed twice with phosphate buffered saline (pH 7.4) and then, 2 ml of the above mentioned MCDB-107 medium supplemented with various kinds of bile acids (0–750 μM). Zero-24 h after the addition of chenodeoxycholic acid and 24 h after the addition of bile acids, 90 μl aliquots of cultured medium were collected, incubated for 30 min at 0°C and then centrifuged for 20 min at 12,000×g. Ten μl of Griess reagent (0.5% naphthylethylenediamine dihydrochloride and 5% sulphanilamide in 25% H3PO4) was added to the supernatants and the mixture was incubated at 60°C for 15 min. The absorbance at 540 nm was measured in a Beckman DU-70 spectrophotometer (Fullerton, CA, U.S.A.). The concentration of [NO2−] was calculated by comparison with the absorbance at 540 nm of standard solutions of 0–150 M NaNO2 prepared in the mentioned MCDB-107 medium.
Recording technique and data analysis
Membrane potentials and currents were recorded with glass pipettes under whole-cell clamp conditions (Hamill et al., 1981; Nakajima et al., 1992), using a patch-clamp amplifier (EPC-7, List Electronics, Darmstadt, Germany). The heat-polished patch electrode, filled with the artificial internal solution (for composition, see above), had the tip resistance of 3–5 MΩ. The series resistance was compensated. Membrane potentials and currents were continuously monitored with a high-gain storage oscilloscope (COS 5020-ST, Kikusui Electronic, Tokyo, Japan). The data were stored on a video-tape using the PCM converter system (RP-890, NF Electronic circuit design, Tokyo, Japan).
Statistical analysis
The data were expressed as a mean±s.d. Statistical analysis was performed using Duncan' multiple range test, and P<0.05 or less was considered significant.
Results
Bile acids increase intracellular Ca2+ concentration [Ca2+]i in vascular endothelial cells
The effects of bile acids on [Ca2+]i were investigated, by using Ca2+-sensitive dye fura 2-AM in human vascular endothelial cell suspensions. To avoid the detergent effects of high concentrations of bile acids, we used the concentrations of bile acids lower than 0.75 mM as previously reported (Dharmsathaphorn et al., 1989; Devor et al., 1993; Pak & Lee, 1993). In the presence of extracellular Ca2+, deoxycholic acid (750 μM), a secondary bile acid, induced a biphasic increase of [Ca2+]i (Figure 1A). In a cell bathed into the Ca2+-free standard solution for approximately 10 min, only a transient increase of [Ca2+]i was observed, the additional application of Ca2+ into the bath solution induced a rapid increase in [Ca2+]i (Figure 1B). Thus, the first transient increase of [Ca2+]i elicited by deoxycholic acid resulted mainly from Ca2+ release from intracellular store sites, and the persistent elevation of [Ca2+]i resulted from the entry of extracellular Ca2+. Figure 1C,D show the effects of high EGTA and Ni2+ on deoxycholic acid-induced sustained [Ca2+]i rise. After [Ca2+]i rise elicited by deoxycholic acid reached the steady state (Figure 1C), the exclusion of extracellular Ca2+ by EGTA (10 mM) inhibited the sustained Ca2+ rise. Ni2+ (1 mM), an inorganic Ca2+ channel blocker, also eliminated the sustained phase of [Ca2+]i (Figure 1D). Similarly, chenodeoxycholic acid (750 μM), a primary bile acid, induced a biphasic increase of [Ca2+]i (Figure 2D). Figure 2 shows the concentration-dependent effects of deoxycholic acid (Figure 2A,B) and chenodeoxycholic acid (Figure 2C,D) on [Ca2+]i. These bile acids (30–750 μM) significantly increased [Ca2+]i in a concentration-dependent manner. Concentration-dependency of various kinds of bile acids was presented in Figure 3. Deoxycholic acid and chenodeoxycholic acid at concentrations above 30 μM increased [Ca2+]i in a concentration-dependent manner. The taurine conjugates of deoxycholic acid (taurodeoxycholic acid) and chenodeoxycholic acid (taurochenodeoxycholic acid, data not shown) also increased [Ca2+]i. The potency of bile acids on elevating [Ca2+]i was deoxycholic acid, chenodeoxycholic acid > taurodeoxycholic acid. On the other hand, cholic acid (750 μM), another primary bile acid, did not significantly affect [Ca2+]i (Figure 2E,F). These results indicate that certain bile acids such as deoxycholic acid and chenodeoxycholic acid increased [Ca2+]i in vascular endothelial cells.
Figure 1.
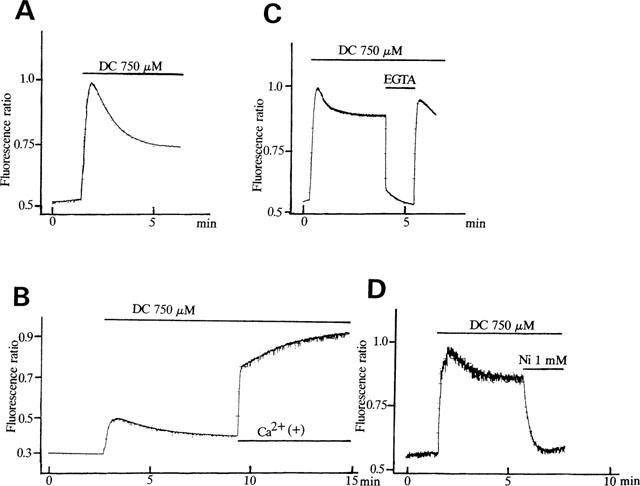
Effects of deoxycholic acid (DC) on [Ca2+]i in human vascular endothelial cells. (A) Effects of deoxycholic acid (750 μM) on [Ca2+]i in the presence of extracellular Ca2+. (B) Effects of deoxycholic acid on [Ca2+]i in the absence of extracellular Ca2+. Note that the additional application of Ca2+ (1.8 mM) rapidly increased [Ca2+]i due to Ca2+ entry. (C) Effects of high EGTA (10 mM) on the DC-induced sustained rise in [Ca2+]i. (D) Effects of Ni2+ (1 mM) on the DC-induced sustained rise in [Ca2+]i. The drug protocols are illustrated in the upper part of each trace. The vertical line represents the fluorescence ratio (F340/F380). Each result is representative of 6–8 similar experiments.
Figure 2.
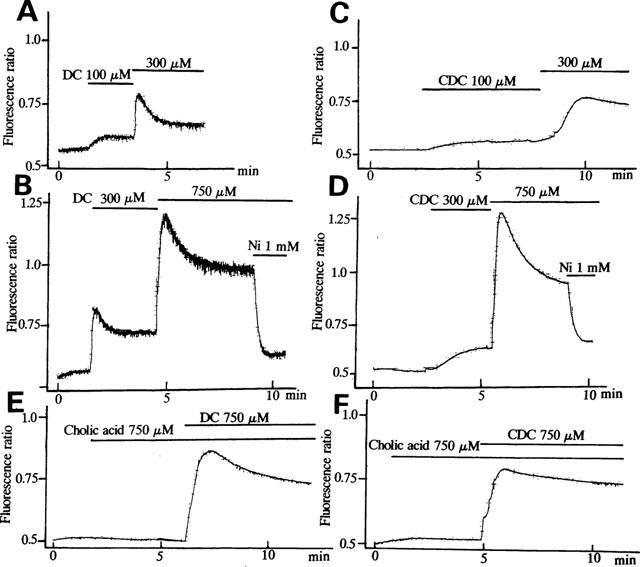
Concentration-dependent effects of bile acids on [Ca2+]i in human endothelial cells. (A,B) Effects of deoxycholic acid (DC) (100–750 μM) on [Ca2+]i. (C,D) Effects of chenodeoxycholic acid (CDC) (100–750 μM) on [Ca2+]i. (E,F) Effects of cholic acid (750 μM) on [Ca2+]i. Note that cholic acid failed to increase [Ca2+]i significantly, while deoxycholic acid (E) and chenodeoxycholic acid (F) dramatically increased [Ca2+]i. Results are representative of 5–6 similar experiments.
Figure 3.
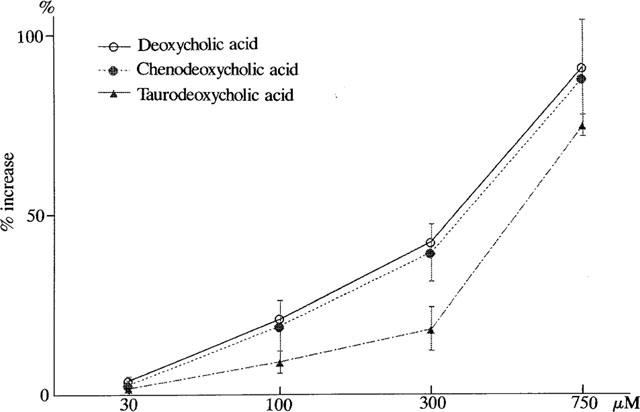
Concentration-dependent effects of bile acids on [Ca2+]i in human endothelial cells. A per cent increase of F340/F380 at the peak level with reference to F340/F380 at the resting state was plotted against each concentration of bile acids (deoxycholic acid, chenodeoxycholic acid and taurodeoxycholic acid). Each point of the curve represents the mean±s.d. of 5–6 preparations.
The effects of deoxycholic acid on [Ca2+]i were also investigated in bovine aortic endothelial cells, by using two-dimensional image analysis. When deoxycholic acid (750 μM) was added to the bath solution, [Ca2+]i within the individual cells was increased (Figure 4) as shown in human endothelial cells suspensions. Deoxycholic acid (750 μM) induced a biphasic increase of [Ca2+]i in almost all cells. On the other hand, deoxycholic acid (300 μM) increased [Ca2+]i, but the time of the onset of [Ca2+]i elevation varied from cells to cells. The oscillatory responses of [Ca2+]i were occasionally observed in individual cells as shown in Figure 5B. Similar results were obtained in chenodeoxycholic acid (data not shown).
Figure 4.
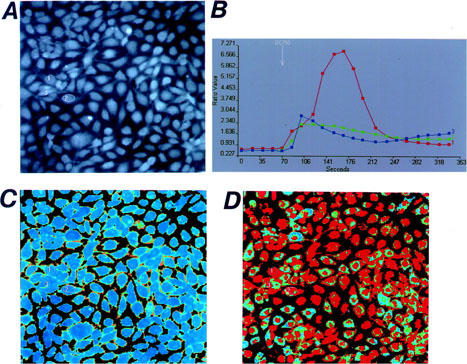
Two-dimensional image of the [Ca2+]i responses in cultured bovine aortic endothelial cells (×200). Microscope images of the fura-2-loaded cultured cells are shown in (A). The resting F340/F380 ratio image is shown in (B), and the image in the presence of deoxycholic acid (DC, 750 μM) is shown in (D). The time courses of the changes in the F340/F380 ratio obtained from three different cells before and after the application of DC are shown in (B). The location of each cell is indicated in (A). Results are representative of four similar experiments.
Figure 5.
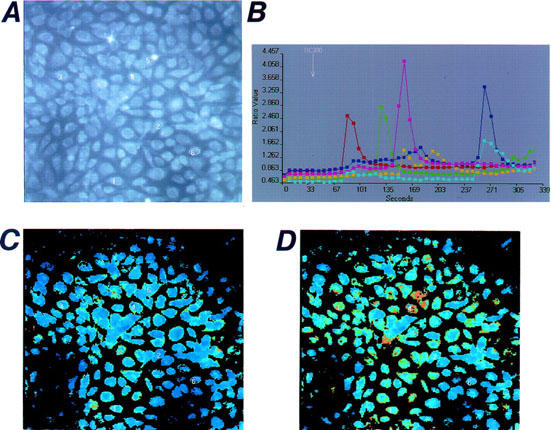
Oscillatory responses of [Ca2+]i induced by deoxycholic acid (DC) in cultured bovine endothelial cells. Two-dimensional images of [Ca2+]i in individual cells are shown. Microscopic images of the fura-2-loaded cultured cells are shown in (A). The resting F340/F380 ratio image is shown in (C), and the image in the presence of deoxycholic acid (DC, 300 μM) is shown in (D). The time courses of the changes in the F340/F380 ratio obtained from five different cells before and after the application of DC are shown in (B). The location of each cell is indicated in (A). Results are representative of four similar experiments.
Bile acids enhance nitric oxide production in vascular endothelial cells
Figure 6 shows the effects of chenodeoxycholic acid (300 μM) on nitric oxide production in human vascular endothelial cells. In the absence of bile acids, the basal concentration of [NO2−] was not changed within 24 h. On the other hand, after the application of the bile acid, the concentration of [NO2−] in the culture medium was increased and remained elevated within 24 h (Figure 6). Figure 7A compared the effects of various kinds of bile acids (300 μM) on nitric oxide production for 24 h in human vascular endothelial cells. Chenodeoxycholic acid, deoxycholic acid, and the conjugates (taurochenodeoxycholic acid and taurodeoxycholic acid) (300 μM) dramatically enhanced [NO2−] production. The taurine conjugates of bile acids were less effective to enhance [NO2−] production than the taurine unconjugates. On the other hand, cholic acid and taurocholic acid (300 μM) did not enhance [NO2−] production significantly (Figure 7A). Figure 7B illustrates the effects of NG-nitro-L-arginine methyl ester (L-NAME), a nitric oxide synthase inhibitor, on bile acid-induced nitric oxide production. Deoxycholic acid and chenodeoxycholic acid (300 μM) enhanced nitric oxide production, but L-NAME (1 mM) significantly inhibited it even in the presence of L-arginine (210.7 mg L−1 in MCDB 107 medium). Figure 8 shows the concentration-dependent effects of bile acids on nitric oxide production. Deoxycholic acid (Figure 8A), chenodeoxycholic acid (Figure 8B) and taurodeoxycholic acid (Figure 8C) (30–750 μM) concentration-dependently increased [NO2−] production. However, taurocholic acid (Figure 8D) failed to increase it significantly.
Figure 6.
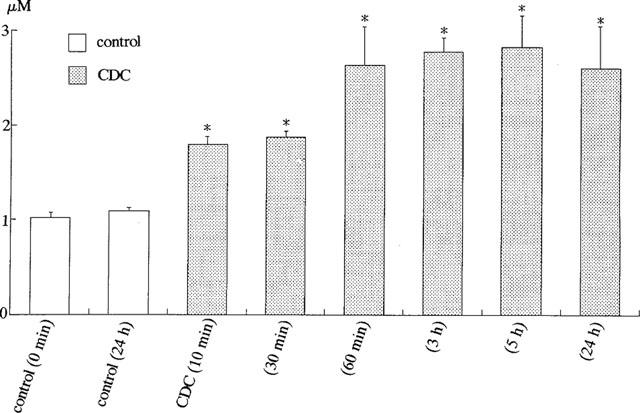
Effects of bile acid (chenodeoxycholic acid, CDC) on [NO2−] production by cultured human endothelial cells. The concentration of [NO2−] (μM) was measured in control and 10 min–24 h after the application of CDC (300 μM). *P<0.05 vs control (0 min). Each column represents the mean±s.d. value of six preparations.
Figure 7.
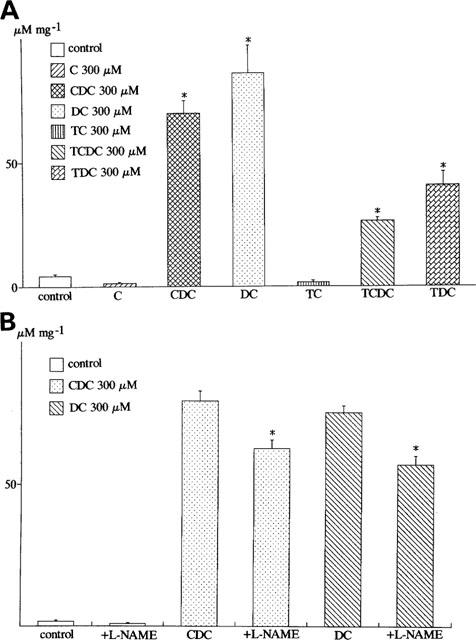
Effects of bile acids on [NO2−] production by cultured human endothelial cells. In this and the following figures, the cells were treated with bile acids for 24 h. The concentrations of [NO2−] (μM) were measured, and divided by the weight of protein (μM mg−1). (A) Effects of various kinds of bile acids on [NO2−] production. Cholic acid (C), chenodeoxycholic acid (CDC), deoxycholic acid (DC), taurochenodeoxycholic acid (TCDC), taurodeoxycholic acid (TDC). *P<0.05 vs control experiments. (B) Effects of NG-nitro-L-arginine methyl ester (L-NAME) on the bile acids (deoxycholic acid and chenodeoxycholic acid)-induced nitric oxide production. The standard bathing solution (MCDB 107 medium) contained L-arginine (210.7 mg l−1). *P<0.05 vs the experiments in the presence of chenodeoxycholic acid (CDC) or deoxycholic acid (DC). Each column represents the mean±s.d. of six preparations.
Figure 8.
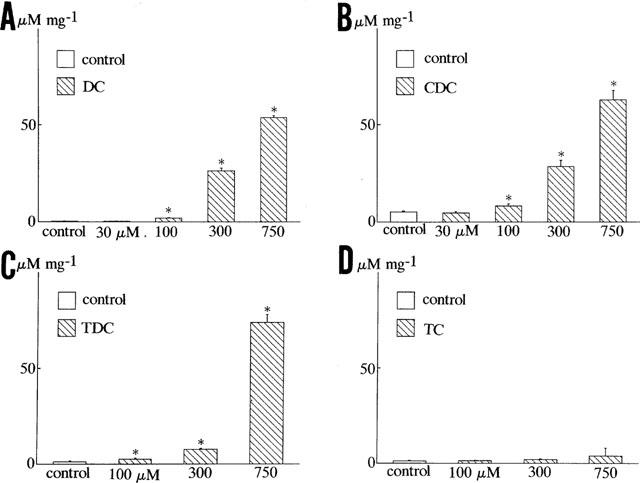
Concentration-dependent effects of bile acids on [NO2−] production in human endothelial cells. (A,B) Concentration-dependent effects of deoxycholic acid (DC), chenodeoxycholic acid (CDC), taurodeoxycholic acid (TDC) and taurocholic acid (TC). Each column represents the mean±s.d. value of six preparations. *P<0.05 vs controls.
Figure 9 shows the effects of calmodulin inhibitors, EGTA and Ni2+ on the bile acid (chenodeoxycholic acid, CDC)-induced nitric oxide production. W-7 and calmidazolium, calmodulin inhibitors, significantly inhibited the bile acid-enhanced nitric oxide production. Similarly, decrease of extracellular Ca2+ with EGTA (10 mM) or Ni2+ (1 mM) decreased the bile acid-induced [NO2−] production in vascular endothelial cells.
Figure 9.
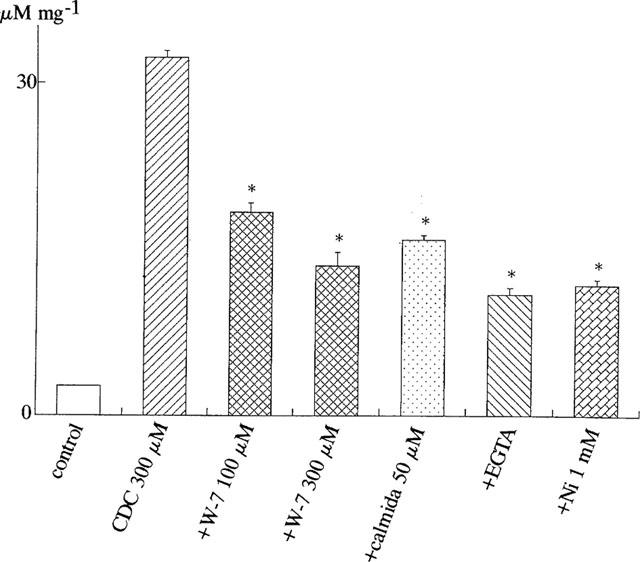
Effects of calmodulin inhibitors (W-7 and calmidazolium), EGTA and Ni2+ on bile acid-induced [NO2−] production in human endothelial cells. [NO2−] production was measured in control, in the presence of chenodeoxycholic acid (CDC, 300 μM), CDC (300 μM) plus calmodulin inhibitors (W-7 and calmidazolium (calmida)), EGTA (10 mM) or Ni2+ (1 mM) for 24 h. Each column represents the mean±s.d. value of six different preparations.
Induction of Ca2+-activated K+ currents by bile acids in vascular endothelial cells
Figure 10 showed the effects of bile acids on membrane potentials in bovine endothelial cells. Under the current clamp conditions, both ATP (1 μM) and deoxycholic acid (750 μM) induced a significant hyperpolarization of membrane potential by approximately −80 mV, which was nearly to the K+ equilibrium potential. Deoxycholic acid (750 μM) induced the sustained hyperpolarization in all cells tested (n=6) as shown in Figure 10A. On the other hand, deoxycholic acid (300 μM) induced the oscillations of the membrane potential in five of seven cells tested (Figure 10B). Similarly, ATP (1 μM) occasionally induced rapidly hyperpolarization, then followed by membrane oscillations (Figure 10C).
Figure 10.
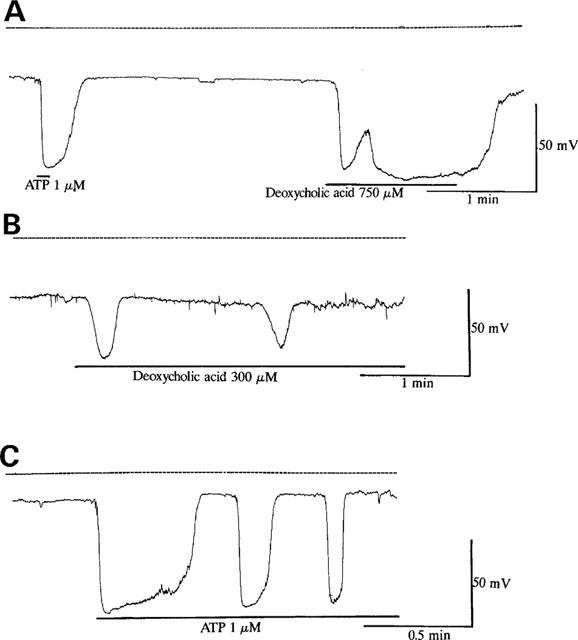
Effects of deoxycholic acid and ATP on membrane potential in cultured bovine aortic endothelial cells. (A) Effects of ATP (1 μM) and deoxycholic acid (750 μM) on membrane potential. The zero potential is indicated by dotted lines. (B) Effects of deoxycholic acid (300 μM) on membrane potential. Note that deoxycholic acid (300 μM) induced the oscillatory responses of membrane potential. (C) Effects of ATP (1 μM) on membrane potential. Each result is representative of 6–7 similar experiments.
To investigate the ionic mechanisms of bile acid-induced hyperpolarization, the effects of deoxycholic acid on membrane currents were investigated as shown in Figure 11. The cells were held at +0 mV, which was approximately equal to the equilibrium potential of Cl− ions. Under the conditions with low EGTA in the patch pipette (0.01 mM), deoxycholic acid (300, 750 μM) induced the outward current in a concentration-dependent manner (Figure 11A). When EGTA in the patch pipette was increased from 0.01–10 mM, both deoxycholic acid and ATP did not increase it at all (Figure 11B). In addition, when K+ in the patch pipette was totally replaced by Cs+ to block K+ currents, deoxycholic acid (750 μM) also did not significantly activate it (data not shown). These observations suggest that bile acids activated Ca2+-dependent K+ currents, then hyperpolarizing the membrane. Deoxycholic acid (300 μM, Figure 11Ca) and ATP (1 μM, Figure 11Cb) frequently induced current oscillations as observed in [Ca2+]i measurements by using two-dimensional image analysis.
Figure 11.
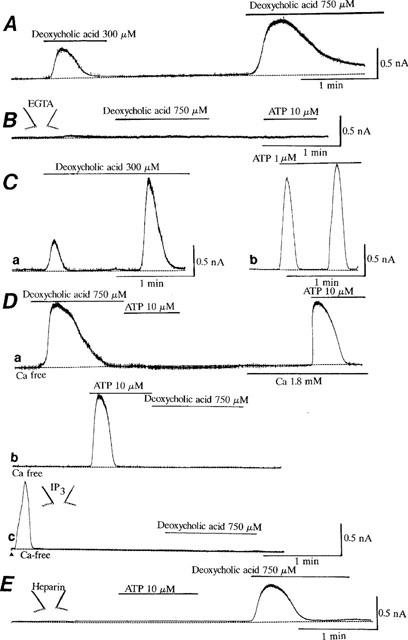
Induction of Ca2+-dependent K+ currents by deoxycholic acid and ATP in bovine endothelial cells. The cells were held at +0 mV. The patch pipette contained 0.01 mM EGTA in (A) and (C,E). (A) Concentration-dependent effects of deoxycholic acid (DC) on Ca2+-dependent K+ currents. (B) Effects of high EGTA (10 mM) in the patch pipette. The patch pipette contained 10 mM EGTA. (C) Induction of the oscillatory K+ currents by deoxycholic acid (CD, 300 μM, a) and ATP (1 μM, b). (D) Effects of deoxycholic acid, ATP and IP3 on the Ca2+-dependent K+ currents in the absence of extracellular Ca2+. In a and b, deoxycholic acid (750 μM) and ATP (10 μM) were applied in the absence of extracellular Ca2+. In c, the patch pipette contained IP3 (100 μM). Immediately after the rupture of the membrane as shown by an arrow, the holding current increased into the outward direction, when IP3 was inserted into the cell through the patch pipette. Note that after deoxycholic acid (750 μM, a), ATP (10 μM) and IP3 (100 μM, c) activated Ca2+-dependent K+ current, the additional application of ATP or deoxycholic acid failed to enhance it furthermore. (E) Effects of heparin on the activation of Ca2+-dependent K+ current induced by ATP and deoxycholic acid (DC). The patch pipette contained heparin (1 mg ml−1). The zero current levels are shown by dotted lines. The drug protocols are illustrated in the upper part of each trace, and each result is representative of 5–6 similar experiments. In the experiments, [Ca2+]i measurements were not done in the same cell.
Even when deoxycholic acid or ATP was applied to the bath solution in the absence of extracellular Ca2+, these agents transiently activated Ca2+-dependent K+ current, primarily by releasing intracellular Ca2+ from the Ca2+ storage sites (Figure 11Da,b). Intracellular application of IP3 (100 μM) also transiently activated Ca2+-dependent K+ current (Figure 11Dc). However, after deoxycholic acid (750 μM, Figure 11Da), ATP (10 μM, Figure 11Db) or IP3 (100 μM, Figure 11Dc) activated the current in the absence of extracellular Ca2+, the additional application of ATP (Figure 11Da) or deoxycholic acid (Figure 11Db,c, 750 μM) did not enhance it furthermore. These results suggest that both bile acids and ATP activated Ca2+-dependent K+ currents by Ca2+ release from the same storage sites. Figure 11E shows the effects of heparin (1 mg ml−1), an IP3 receptor antagonist (Kobayashi et al., 1989), on the ATP and bile acid actions. When heparin was included in the patch pipette, ATP (10 μM) failed to activate Ca2+-dependent K+ currents, but deoxycholic acid (750 μM) still activated it. The similar results were obtained in all five different cells examined.
Discussion
This is the first report to describe that (1) bile acids such as deoxycholic acid, chenodeoxycholic acid and these taurine conjugates concentration-dependently increased [Ca2+]i in vascular endothelial cells, by releasing Ca2+ from an IP3-sensitive site and subsequently Ca2+ influx, while cholic acid and taurocholic acid did not, (2) the bile acids dramatically enhanced nitric oxide production in vascular endothelial cells.
Contractile agonists such as ATP have been known to increase [Ca2+]i through a phosphatidylinositol response; it induces the first transient increase of [Ca2+]i by mainly releasing Ca2+ from an IP3-sensitive store, subsequently followed by Ca2+ influx. The present study provided novel evidence that bile acids concentration-dependently increased [Ca2+]i in vascular endothelial cells. In the presence of extracellular Ca2+, chenodeoxycholic acid (a primary bile acid), deoxycholic acid (a secondary bile acid) and its taurine conjugate (taurodeoxycholic acid and taurochenodeoxycholic acid) increased [Ca2+]i in a biphasic manner. The initial increase of [Ca2+]i induced by bile acids could mainly result from the release of intracellular storage sites. On the other hand, exclusion of extracellular Ca2+ or Ni2+, an inorganic Ca2+ antagonist, inhibited the following persistent elevation of [Ca2+]i, suggesting that it could result from the influx of extracellular Ca2+. The elevation of [Ca2+]i induced by bile acids was also reflected by membrane hyperpolarization due to activation of Ca2+-dependent K+ current as shown in Figure 10. Furthermore, we have observed that in individual cells using two-dimensional image analysis, most of the cells displayed an oscillatory behaviour after the application of relatively low concentrations of deoxycholic acid (300 μM) as in a case of ATP (1 μM, data not shown), while 750 μM deoxycholic acid markedly induced sustained Ca2+ rise. The onset and frequency of oscillations varied from cell to cell as shown in Figure 5. The similar oscillatory membrane potentials and currents, reflected by activation of Ca2+-dependent K+ current, could be recorded under the whole-cell clamp conditions. These oscillations may present a balance between agonist-induced intracellular Ca2+ release and the uptake and efflux mechanisms to maintain low [Ca2+]i.
Under voltage clamp conditions, both bile acids and ATP transiently activated Ca2+-dependent K+ current at a holding potential of +0 mV, mainly by releasing Ca2+ from the storage sites. Also, they activated Ca2+-dependent K+ current in the absence of extracellular Ca2+. However, after ATP, bile acids or IP3 maximally activated K+ current in the absence of extracellular Ca2+, the additional application of ATP or bile acids did not increase it any more. These results suggest that bile acids released Ca2+ from an IP3-sensitive Ca2+ store. Bile acids may induce inositol monophosphate (IP) accumulation, reflecting production of IP3. Actually, bile acids may directly activate phospholipase C, since they have been shown to stimulate an increase in IP3 accumulation in isolated colonic crypts of rats (Craven et al., 1987). In addition, it has been reported that taurodeoxycholate activated K+ conductance via an IP3-mediated release of Ca2+ from intracellular stores in a colonic cell line (T84) (Devor et al., 1993), since heparin, an IP3 receptor antagonist (Kobayashi et al., 1989), antagonized this effect. However, the involvement of IP3 on bile acids-induced Ca2+ increase was unlikely in vascular endothelial cells. Heparin completely blocked the activation of Ca2+-dependent K+ current induced by ATP, while it failed to inhibit the activation of Ca2+-dependent K+ current induced by bile acids in vascular endothelial cells. Bile acids such as taurolithocholic acid 3-sulphate as noradrenaline and angiotensin II have been reported to induce Ca2+ release from the intracellular store sites, then activating Ca2+-dependent K+ currents in guinea-pig liver cells (Combettes et al., 1988; 1989; Capiod et al., 1991). In these cells, the bile acid effect was not blocked by intracellular application of heparin, while heparin blocked the activation of Ca2+-dependent K+ currents induced by noradrenaline and angiotensin II. Thus, the similar mechanism may be involved in the bile acid effect on hepatocytes and endothelial cells.
Bile acids are well known to be anionic detergents and are used in purification and reconstruction of membrane proteins. However, there are several reasons why these detergent effects were not unlikely to be involved in the bile acid effect observed in the present study. First, cholic acid and taurocholic acid (750 μM) are also anionic detergents, but they did not increase [Ca2+]i and activate Ca2+-dependent K+ current in vascular endothelial cells. Second, the cell viability determined by trypan blue exclusion in control cells and cells treated with bile acids (deoxycholic acid, 300–750 μM) was not remarkably different as illustrated in Methods. Third, the LDH release from cells in the culture medium was not significantly different in control cells and cells treated with 300–750 μM deoxycholic acid (data not shown). Alternatively, it is likely that the Ca2+ release caused by bile acids results from a direct permeabilizing action on the membrane of the sarcoplasmic reticulum (SR). The application of ATP immediately increased [Ca2+]i, primarily by releasing Ca2+ from the store sites, while the time needed to elevate [Ca2+]i induced by bile acids was different among individual cells as shown in Figure 5. There were no direct data on the binding of bile acids to the SR, but it is proposed that bile acids participate into SR membranes, and alter cation permeability by either introducing pores or acting as mobile carriers.
There are three types of nitric oxide synthase (Forstermann & Kleinert, 1995) and the one expressed by endothelial cells is a constitutive enzyme that is Ca2+-calmodulin-dependent (Palmer et al., 1988). The present study demonstrates that bile acids rapidly enhanced nitric oxide production in endothelial cells. The Ca2+-calmodulin might be involved in the bile acids-induced nitric oxide production, since exclusion of extracellular Ca2+ or W-7 and calmidazolium, calmodulin inhibitors, inhibited the production of nitric oxide caused by bile acids. In addition, deoxycholic acid and chenodeoxycholic acid increased [Ca2+]i and rapidly enhanced nitric oxide production (Figure 6), while cholic acid did not increase [Ca2+]i and enhance nitric oxide production. Also, the potency of bile acids to enhance nitric oxide production was deoxycholic acid, chenodeoxycholic acid≈thinsp;4 taurodeoxycholic acid≈thinsp;4 cholic acid, which was quite similar to that of bile acids to increase [Ca2+]i in vascular endothelial cells.
Primary bile acids (cholic acid and chenodeoxycholic acid), which are conjugated to either taurine or glycine, and then formed conjugated bile acids such as taurocholic acid, are transferred from hepatocytes to the lumen of the small intestine. And, the primary bile acids are undergone dehydroxylation by intestinal bacteria, to give rise to secondary bile acids, such as deoxycholic acid. By virtue of the enterohepatic circulation, the plasma concentration of all bile acids is very low, less than 1 μg ml−1, which is equivalent to about 2–4 μM. But, in patients with cirrhosis (LaRusso et al., 1975; Clain et al., 1977) or bile duct obstruction (Bogin et al., 1983), plasma concentration of bile acids is elevated, and occasionally reaches beyond 100 μM (Makino et al., 1969; 1975; Pennington et al., 1977; Song et al., 1983). Especially, plasma concentration of chenodeoxycholic acid has been reported to be remarkably increased in patients with liver cirrhosis or obstructive jaundice (Takikawa et al., 1983). The present study provided novel evidence that bile acids such as chenodeoxycholic acid increased [Ca2+]i and then nitric oxide production in endothelial cells at the physiological concentrations more than 30 μM. Cirrhosis, obstructive jaundice or isolated cholaemia produced by choleductocaval anastomoses induces arterial hypotension due to peripheral vasodilation, and also blunts peripheral presser responses to contractile substrates (noradrenaline and angiotensin). Therefore, bile acid-induced nitric oxide production may play an important role in the haemodynamic abnormalities observed in liver diseases such as obstructive jaundice and cirrhosis, but further studies are needed to clarify this possibility.
Acknowledgments
This work was partly supported by grants from the Ministry of Education and Science of Japan to T. Nakajima.
Abbreviations
- [Ca2+]i
cytosolic free Ca2+ concentration
- EGTA
ethylene glycol bis-(β-aminoethylether)-N,N,N′,N′-tetraacetic acid
- L-NAME
NG-nitro-L-arginine methyl ester
- W-7
N-(6-aminohexyl)-5-chloro-l-naphthalenulsulphonamide hydrochloride
- NO
nitric oxide
- ATP
adenosine triphosphate
References
- ALON U., BERANT M., MORDECHOVITZ D., HASHMONAI M., BETTER O.S. Effect of isolated cholaemia on systemic haemodynamics and kidney function in conscious dogs. Clinical Science. 1982;63:59–64. doi: 10.1042/cs0630059. [DOI] [PubMed] [Google Scholar]
- ASANO M., NAKAJIMA T., HAZAMA H., IWASAWA K., TOMARU T., OMATA M., SOMA M., ASAKURA Y., MIZUTANI M., SUZUKI S., YAMASHITA K., OKUDA Y. Influence of cellular incorporation of n-3 eicosapentaenoic acid on intracellular Ca2+ concentration and membrane potential in vascular smooth muscle cells. Atherosclerosis. 1998;138:117–127. doi: 10.1016/s0021-9150(98)00010-0. [DOI] [PubMed] [Google Scholar]
- BATTISTA S., BAR F., MENGOZZI G., ZANON E., GROSSO M., MOLINO G. Hyperdynamic circulation in patients with cirrhosis: direct measurement of nitric oxide levels in hepatic and portal vein. J. Hepatol. 1997;26:75–80. doi: 10.1016/s0168-8278(97)80012-8. [DOI] [PubMed] [Google Scholar]
- BERNARDI M., FORNALE L., DI MARCO C., TREVISANI F., BARALDINI M., GASBARRINI A., DE COLLIBUS C., ZACA F., LIGABUE A., COLANTONI A., Hyperdynamic circulation of advanced cirrhosis: a re-appraisal based on posture-induced changes in hemodynamics. J. Hepatol. 1995;22:309–318. doi: 10.1016/0168-8278(95)80284-3. [DOI] [PubMed] [Google Scholar]
- BERNARDI M., TREVISANI F. Systemic and regional hemodynamics in preascitic cirrhosis. J. Hepatol. 1997;27:588–591. doi: 10.1016/s0168-8278(97)80367-4. [DOI] [PubMed] [Google Scholar]
- BOGIN E., BETTER O., HARARI I. The effect of jaundiced sera and bile salts on cultured beating rat heart cells. Experimentia. 1983;39:1307–1308. doi: 10.1007/BF01990384. [DOI] [PubMed] [Google Scholar]
- BOMZON A., FINBERG J.P., TOVBIN D., NAIDU S.G., BETTER O.S. Bile salts, hypotension and obstructive jaundice. Clinical Science. 1984;67:177–183. doi: 10.1042/cs0670177. [DOI] [PubMed] [Google Scholar]
- BOSCH J., GUNES P., ARROYO V., NAVAS M., RODES J.Hepatic and systemic hemodynamics and the neurohumoral systems in cirrhosis The kidney in liver disease 1988Baltimore: Williams & Wilkins; 286–308.3rd ed. ed Epstein M pp [Google Scholar]
- CAPIOD T., COMBETTES L., NOEL J., CLARET M. Evidence for bile acid-evoked oscillation of Ca2+-dependent K+ permeability unrelated to a D-myo-inositol 1,4,5-triphosphate effect in isolated guinea-pig liver cells. J. Biol. Chem. 1991;266:268–273. [PubMed] [Google Scholar]
- CAREY J. Serum trihydroxy: dihydroxy bile acid ratio in liver and biliary tract disease. J. Clin. Invest. 1958;37:1494–1503. doi: 10.1172/JCI103741. [DOI] [PMC free article] [PubMed] [Google Scholar]
- CASTRO A., JIMENEZ W., CLARIA J., ROS J., MARTINEZ J.M., BOSCH M., ARROYO V., PIULATS J., RIVERA F., RHODES J. Impaired responsiveness to angiotensin II in experimental cirrhosis: role of nitric oxide. Hepatology. 1993;18:367–372. [PubMed] [Google Scholar]
- CLAIN J.E., MALAGELADA J.R., CHADWICK V.S., HOFMAN A.F. Binding properties in vitro of antacids for conjugated bile acids. Gastroenterology. 1977;73:556–559. [PubMed] [Google Scholar]
- CLARIA J., JIMENEZ W., ROS J., ASBERT M., CASTRO A., ARROYO V., RIVERA F., RODES J. Pathogenesis of arterial hypotension in cirrhotic rats with ascites: role of endogenous nitric oxide. Hepatology. 1992;15:343–349. doi: 10.1002/hep.1840150227. [DOI] [PubMed] [Google Scholar]
- COMBETTES L., BERTHON B., DOUCET E., ERLINGER S., CLARET M. Characteristics of bile acid-mediated Ca2+ release from permeabilized liver cells and liver microsomes. J. Biol. Chem. 1989;264:157–167. [PubMed] [Google Scholar]
- COMBETTES L., DUMONT M., BERTHON B., ERLINGER S., CLARET M. Release of calcium from the endoplasmic reticulum by bile acids in rat liver cells. J. Biol. Chem. 1988;263:2299–2303. [PubMed] [Google Scholar]
- CRAVEN P.A., PFANSTIEL J., DERUBERTIS F.R. Role of activation of protein kinase C in the stimulation of colonic epithelial proliferation and reactive oxygen formation by bile acids. J. Clin. Invest. 1987;79:532–541. doi: 10.1172/JCI112844. [DOI] [PMC free article] [PubMed] [Google Scholar]
- DEVOR D.C., SEKAR M.C., FRIZZELL R.A., DUFFEY M.E. Taurodeoxycholate activates potassium and chloride conductances via an IP3-mediated release of calcium from intracellular stores in a colonic cell line (T84) J. Clin. Invest. 1993;92:2173–2181. doi: 10.1172/JCI116819. [DOI] [PMC free article] [PubMed] [Google Scholar]
- DHARMSATHAPHORN K., HUOTT P.A., VONGKOVIT P., BEUERLEIN G., PANDOL S.J., AMMON H.V. Cl− secretion induced by bile acids; a study of the mechanism of action based on a cultured colonic epithelial cell line. J. Clin. Invest. 1989;84:945–953. doi: 10.1172/JCI114257. [DOI] [PMC free article] [PubMed] [Google Scholar]
- FINBERG J.P., SEIDMAN R., BETTER O.S. Cardiovascular responsiveness to vasoactive agents in rats with obstructive jaundice. Clin. Exp. Pharm. Physiol. 1982;9:639–643. doi: 10.1111/j.1440-1681.1982.tb00835.x. [DOI] [PubMed] [Google Scholar]
- FINBERG J.P., SYROP H.A., BETTER O.S. Blunted pressor response to angiotensin and sympathomimetric amines in bile duct ligated dogs. Clinical Science. 1981;61:535–539. doi: 10.1042/cs0610535. [DOI] [PubMed] [Google Scholar]
- FORSTERMANN U., KLEINERT H. Nitric oxide synthase expression and expressional control of the three isoforms. Naunyn-Schmiedeberg' Arch. Pharmacol. 1995;352:351–364. doi: 10.1007/BF00172772. [DOI] [PubMed] [Google Scholar]
- GROSZMANN R.J. Hyperdynamic circulation of liver disease 40 years later: pathophysiology and clinical consequences. Hepatology. 1994;20:1359–1363. [PubMed] [Google Scholar]
- GRYNKIEWCZ G., POENIE M., TSIEN R.Y. A new generation of calcium indicators with greatly improved fluorescence properties. J. Biol. Chem. 1985;260:3440–3450. [PubMed] [Google Scholar]
- GUARNER C., SORIANO G., TOMAS A., BULBENA O., NOVELLA M.T., BALANZO J., VILARDELL F., MOURELLE M., MONCADA S. Increased serum nitrate levels in patients with cirrhosis: relationship to endotoxemia. Hepatology. 1993;18:1139–1143. [PubMed] [Google Scholar]
- HAMILL O.P., MARTY A., NEHER E., SAKMANN B., SIGWORTH F.J. Improved patch-clamp techniques for high-resolution current recording from cells and cell-free membrane patches. Pflügers Arch. 1981;391:85–100. doi: 10.1007/BF00656997. [DOI] [PubMed] [Google Scholar]
- HARTLEB M., MOREAU R., CAILMAIL S., GAUDIN C., LEBREE D. Vascular hyporesponsiveness to endothelin 1 in rats with cirrhosis. Gastroenterology. 1994;107:1085–1093. doi: 10.1016/0016-5085(94)90233-x. [DOI] [PubMed] [Google Scholar]
- KOBAYASHI S., KITAZAWA T., SOMLYO A., SOMLYO A.P. Cytosolic heparin inhibits muscarinic and α-adrenoceptors Ca2+ release in smooth muscle. Physiological role of inositol 1,4,5-triphosphate in pharmacomechanical coupling. J. Biol. Chem. 1989;264:17997–18004. [PubMed] [Google Scholar]
- LARUSSO N.F., HOFFMAN N.E., HOFMANN A.F., KORMAN M.G. Validity and sensitivity of an intravenous bile acid tolerance test in patients with liver disease. N. Engl. J. Med. 1975;292:1209–1214. doi: 10.1056/NEJM197506052922303. [DOI] [PubMed] [Google Scholar]
- MACGILCHRIST A.J., SUMNER D., REID J.L. Impaired pressor reactivity in cirrhosis: evidence for a peripheral vascular defect. Hepatology. 1991;13:689–694. [PubMed] [Google Scholar]
- MAKINO I., HASHIMOTO H., SHINOZAKI K., YOSHINO K., NAKAGAWA S. Sulfated and nonsulfated bile acids in urine, serum, and bile of patients with hepatobiliary disease. Gastroenterology. 1975;68:545–553. [PubMed] [Google Scholar]
- MAKINO I., NAKAGAWA S., MASHIMO K. Conjugated and unconjugated serum bile acid levels in patients with hepatobiliary disease. Gastroenterology. 1969;56:1033–1039. [PubMed] [Google Scholar]
- MARTIN P.Y., GINES P., SCHRIER R.W. Nitric oxide as a mediator of hemodynamic abnormalities and sodium and water retention in cirrhosis. N. Engl. J. Med. 1998;339:533–541. doi: 10.1056/NEJM199808203390807. [DOI] [PubMed] [Google Scholar]
- MATSUMOTO A., OGURA K., HIRATA Y., KAKOKI M., WATANABE F., TAKENAKA K., SHIRATORI Y., MOMOMURA S., OMATA M. Increased nitric oxide in the exhaled air of patients with decompensated liver cirrhosis. Ann. Inter. Med. 1995;123:110–113. doi: 10.7326/0003-4819-123-2-199507150-00005. [DOI] [PubMed] [Google Scholar]
- MOLLER S., CHRISTENSEN E., HENRIKSEN J.H. Continuous blood pressure monitoring in cirrhosis: relations to splanchnic and systemic haemodynamics. J. Hepatol. 1997;72:284–294. doi: 10.1016/s0168-8278(97)80173-0. [DOI] [PubMed] [Google Scholar]
- NAKAJIMA T., SUGIMOTO T., KURACHI Y. Effects of anions on the G protein-mediated activation of the muscarinic K+ channel in the cardiac atrial cell membrane: intracellular chloride inhibition of the GTPase activity of GK. J. Gen. Physiol. 1992;99:665–682. doi: 10.1085/jgp.99.5.665. [DOI] [PMC free article] [PubMed] [Google Scholar]
- NIEDERBERGER M., GINES P., TSAI P., MARTIN P.Y., MORRIS K., WEIGERT A., MCMURTRY I., SCHRIER R.W. Increased aortic cyclic guanosine monophosphate concentration in experimental cirrhosis in rat: evidence for a role of nitric oxide in the pathogenesis of arterial vasodilation in cirrhosis. Hepatology. 1995a;21:1625–1631. [PubMed] [Google Scholar]
- NIEDERBERGER M., MARTIN P.Y., GINES P., MORRIS K., TSAI P., XU D.L., MCMURTRY I., SCHRIER R.W. Normalization of nitric oxide production corrects arterial vasodilation and hyperdynamic circulation in cirrhotic rats. Gastroenterology. 1995b;109:1624–1630. doi: 10.1016/0016-5085(95)90652-5. [DOI] [PubMed] [Google Scholar]
- OKUDA Y., KAWASHIMA K., SAWADA T., TSURUMARU K., ASANO M., SUZUKI S., SOMA M., NAKAJIMA T., YAMASHITA K. Eicosapentaenoic acid enhances nitric oxide production by cultured human endothelial cells. Biochem. Biophys. Res. Commun. 1997;232:487–491. doi: 10.1006/bbrc.1997.6328. [DOI] [PubMed] [Google Scholar]
- PAK J.M., LEE S.S. Vasoactive effects of bile salts in cirrhotic rats: in vivo and in vitro studies. Hepatology. 1993;18:1175–1181. [PubMed] [Google Scholar]
- PALMER R.M.J., ASHTON D.S., MONCADA S. Vascular endothelial cells synthesize nitric oxide from L-arginine. Nature. 1988;333:664–666. doi: 10.1038/333664a0. [DOI] [PubMed] [Google Scholar]
- PENNINGTON C.R., ROSS P.E., BOUCHIER I.A. Serum bile acids in the diagnosis of hepatobiliary disease. Gut. 1977;18:903–908. doi: 10.1136/gut.18.11.903. [DOI] [PMC free article] [PubMed] [Google Scholar]
- PIZCUETA P., PIQUE J.M., FERNANDEZ M., BOSCH J., RODES J., WHITTLE B.J., MONCADA S. Modulation of the hyperdynamic circulation of cirrhotic rats by nitric oxide inhibition. Gastroenterology. 1992;103:1909–1915. doi: 10.1016/0016-5085(92)91451-9. [DOI] [PubMed] [Google Scholar]
- ROS J., JIMENEZ W., LAMAS S., CLARIA J., ARROYO V., RIVERA F., RODES J. Nitric oxide production in arterial vessels of cirrhotic rats. Hepatology. 1995;21:554–560. [PubMed] [Google Scholar]
- SCHRIER R.W., ARROYO V., BERNARDI M., EPSTEIN M., HENRIKSEN J.H., RODES J. Peripheral arterial vasodilation hypothesis: a proposed for the initiation of renal sodium and water retention in cirrhosis. Hepatology. 1988;81:1151–1157. doi: 10.1002/hep.1840080532. [DOI] [PubMed] [Google Scholar]
- SHIN W.S., SASAKI T., KATO M., HARA K., SEKO A., YANG W.D., SHIMAMOTO N., SUGIMOTO T., TOYO-OKA T. Autocrine and paracrine effects of endothelium-derived relaxing factor on intracellular Ca2+ of endothelial cells and vascular smooth muscle cells. Identification by two-dimensional image analysis. J. Biol. Chem. 1992;267:20377–20382. [PubMed] [Google Scholar]
- SOGNI P., GARNIER P., GADANO A., MOREAU R., DALLAVA-SANTUCCI J., DINH-XUAN A.T., LEBREC D. Endogenous pulmonary nitric oxide production measured from exhaled air is increased in patients with severe cirrhosis. J. Hepatol. 1995;23:471–473. doi: 10.1016/0168-8278(95)80207-x. [DOI] [PubMed] [Google Scholar]
- SONG E., SEGAL I., HODKINSON J., KEW M.C. Sinus bradycardia in obstructive jaundice: correlation with total serum bile acid concentrations. S. Afr. Med. 1983;64:548–551. [PubMed] [Google Scholar]
- TAKIKAWA H., OTSUKA H., BEPPU T., SEYAMA Y., YAMAKAWA T. Serum concentrations of bile acid glucuronides in hepatobilliary diseases. Digestion. 1983;27:189–195. doi: 10.1159/000198952. [DOI] [PubMed] [Google Scholar]
- VALLANCE P., MONCADA S. Hyperdynamic circulation in cirrhosis: a role for nitric oxide. Lancet. 1991;337:776–778. doi: 10.1016/0140-6736(91)91384-7. [DOI] [PubMed] [Google Scholar]
- WANG Y., SHIN W.S., KAWAGUCHI H., INUKAI M., KATO M., SAKAMOTO A., UEHARA Y., MIYAMOTO M., SHIMAMOTO N., KORENAGA R., ANDO J., TOYO-OKA T. Contribution of sustained Ca2+ elevation for nitric oxide production in endothelial cells and subsequent modulation of Ca2+ transient in vascular smooth muscle cells in coculture. J. Biol. Chem. 1996;271:5647–5655. doi: 10.1074/jbc.271.10.5647. [DOI] [PubMed] [Google Scholar]
- WEIGERT A.L., MARTIN P.Y., NIEDERBERGER M., HIGA E.M., MCMURTRY I.F., GINES P., SCHRIER R.W. Endothelium-dependent vascular hyporesponsiveness without detection of nitric oxide synthase induction in aortas of cirrhotic rats. Hepatology. 1995;22:1856–1862. [PubMed] [Google Scholar]
- WOOD K.S., BUGA G.M., BYRNS R.E., IGNARRO L.J. Vascular smooth muscle-derived relaxing factor (MDRF) and its close similarity to nitric oxide. Biochem. Biophys. Res. Commun. 1990;170:80–88. doi: 10.1016/0006-291x(90)91243-l. [DOI] [PubMed] [Google Scholar]


