

Abstract
The effects of barnidipine and nifedipine on L-type Ca2+ current (ICa(L)) were investigated in ventricular cardiomyocytes from rats.
Both barnidipine and nifedipine reduced ICa(L) in a concentration and voltage dependent manner; the EC50 were 80 and 130 nM at a holding potential of −80 mV, respectively, and 18 and 6 nM at −40 mV, respectively.
Both drugs induced a leftward shift of the steady-state inactivation curve of ICa(L).
Using a twin pulse protocol, the relationships between the amount of block of ICa(L) by either drug, seen during the second pulse, and the length of the first pulse were described by monoexponential functions reflecting onset of block, dependent on drug concentration. The onset of block by barnidipine was three times faster than that by nifedipine.
With both drugs, recovery of ICa(L) was 50 times slower than under control conditions and described by monoexponential functions reflecting offset of block (independent of drug concentration). The offset of block with barnidipine was three times slower than that with nifedipine.
The time constants of block and unblock of ICa(L) by both drugs were used to calculate binding and unbinding and to predict their effects at two frequencies.
It is suggested that barnidipine exhibits a higher affinity to the inactivated Ca2+ channel state as compared to nifedipine.
Keywords: Cardiac muscle, dihydropyridine, inactivated channel state, net-binding, unbinding
Introduction
Ca2+ antagonists are widely used clinically in the treatment of hypertension, angina pectoris and cardiac arrhythmias (see Roberts & Zanchetti, 1996). Three major classes of structurally unrelated substances, the phenylalkylamines (typified by verapamil), the dihydropyridines (typified by nifedipine) and the benzothiazepines (typified by diltiazem) belong to this important group of drugs. Their pharmacological and therapeutic properties are attributable to the block of the influx of Ca2+ through L-type Ca2+ channels in vascular smooth muscle and/or cardiac muscle (Catterall & Striessnig, 1992). Recently, new Ca2+ antagonists have been developed, especially in the class of dihydropyridine compounds which have considerable higher vascular selectivity and longer duration of action with respect to the prototype compound, nifedipine (Nayler, 1988). One of these compounds, barnidipine (see Merck Index, 1996), is highly lipophilic, which may allow accumulation of the drug in the cell membrane (Satoh, 1991). It has been suggested that lipophilic dihydropyridines may reach their receptor, the L-type Ca2+ channel, via a membrane pathway with a two-step process: first, the drug binds and accumulates in the membrane lipid bilayer and then diffuses within the membrane to its receptor site (Mason et al., 1989; Herbette et al., 1993). This model implies that the kinetic of block and unblock of L-type Ca2+ channels by application of barnidipine may comprise two processes being substantially different from those of more hydrophilic dihydropyridine compounds. In this study, we examined the effects of barnidipine on L-type Ca2+ channel current (ICa(L)) in rat ventricular cardiomyoctes. In particular, the modulation of the effects by certain voltage protocols was investigated in the steady state of drug-tissue distribution in order to get more insights in the kinetics of Ca2+ channel modulation by this drug. For comparison, the effects of nifedipine were also studied.
Methods
Preparations
Sprague-Dawley rats (200–300 g) of either sex were anaesthetized with ether and bled from the carotid arteries. The heart was quickly removed and immersed in warmed and oxygenated solution A (containing in mM): NaCl 137, KCl 5.4, CaCl2 1.8, MgCl2 1, NaHCO3 12, NaH2PO4 0.42, glucose 5.6; aerated with 95% O2+5% CO2; pH 7.4. Single ventricular cardiomyocytes were isolated as described previously (Wegener & Nawrath, 1995). Briefly, the hearts were enzymatically digested by perfusion with a collagenase-containing buffer solution via the aorta using the Langendorff set-up. Single myocytes were obtained from ventricular tissue pieces by mechanical dispersion.
Whole-cell recordings
Electrophysiological experiments were performed on rod-shaped myocytes with clear cross striations using the whole-cell configuration of the patch-clamp technique (Hamill et al., 1981). During the experiments, the myocytes were continuously superfused with solution B (composition in mM): NaCl 137, CsCl 5.4, MgCl2 0.5, CaCl2 1.8, glucose 5, HEPES 10, pH was adjusted with NaOH to 7.4. The patch pipettes were built from borosilicate glass (Science Products, Frankfurt, Germany). The resistances of the pipettes ranged from 1 to 1.3 MΩ when filled with pipette solution (composition in mM): CsCl 125, MgCl2 6, CaCl2 0.15, Na2ATP 5, Na2GTP 0.1, EGTA 5, HEPES 10; pH was adjusted with CsOH to 7.3. Membrane currents of single myocytes were recorded by an Axopatch amplifier (200A, Axon Instruments Inc., Foster City CA, U.S.A.) at seal resistances >5 GΩ. The current signals were filtered at 1 kHz, digitized at 3 kHz using an A/D–D/A-converter (DigiData 1200 system, Axon Instr. Inc.) and stored on a 486-microprocessor based computer, running pClamp 6 software (Axon Instr. Inc.) which was additionally used for the generation of voltage pulses and data analysis. Currents recorded were not compensated for capacity or leak currents. During the experiments, the myocytes were voltage-clamped at a holding potential of −80 mV. To inactivate the fast sodium current, a 10–20 ms pre-pulse to −40 mV was set before activating the Ca2+ current. L-type calcium currents (ICa(L)) were elicited repetitively by 100 ms depolarizing voltage pulses to 0 mV interrupted by a pulse interval at −80 mV. Steady-state inactivation of ICa(L) was studied by the application of 3 s conditioning pulses to various voltages (between −120 and 0 mV) followed by a test pulse to 0 mV. Kinetic analyses were performed using twin-pulse protocols. Either the duration of a depolarizing first pulse or the duration of the interval between the first and the second pulse were varied. The twin-pulse protocols were applied at train intervals of 10 s (under control conditions) and 40 s (in the presence of a drug) to allow full recovery of ICa(L). The experiments were performed at 36±1°C.
Chemicals
All chemicals used were at least of reagent grade and purchased from Sigma (St Louis MO, U.S.A.). Barnidipine was a gift from Yamanouchi Pharmaceutical Co. Ltd. (Tokyo, Japan).
Evaluation of results
Data are presented as original recordings or expressed as means±s.e.mean (in per cent of control values). The magnitude of ICa(L) (ICa(peak)) was measured as the difference of peak inward and steady-state current at the end of the voltage pulse. Steady-state inactivation curves of ICa(L) were described by Boltzmann functions. Concentration-response curves, Boltzmann relationships, and time-dependent changes of data were fitted using GraphPad Prism 3.0 (GraphPad Software Inc., San Diego, CA, U.S.A.). Correlation coefficients were >0.99. Statistical comparisons of monoexponential curves were performed by a two-way analysis of variance (repeated measurements design). Differences were considered as significant at P<0.05.
Computer simulation of drug binding/unbinding was performed according to the model calculations described by Starmer (1986), Starmer et al. (1989) and Chernoff & Strichartz (1989). A change in the fraction of blocked channels was described by a sequence of recursion relations during stimulation and rest intervals where the calculated fraction was used as initial condition for computing block during the next interval. Assuming that the time constants for equilibrium between channel states are small relative to the dwell time in each state, the blockade at the end of the nth stimulation interval, An, and of the nth rest interval, Rn, is described by the following recursion relations (adopted from Starmer et al., 1989): An=Rn*exp(−tn/τon)+A(∞)+A(∞)*exp(−tn/τon) and Rn=(En1R(∞))*exp(tn/τoff)+R(∞) where A(∞) and R(∞) are the equilibrium block at stimulation and rest, respectively, τon is the observed time constant for the increment in block, and τoff the observed time constant for the recovery from block. The equilibrium block associated with the two intervals was assumed to be 1 and 0, respectively.
The apparent dissociation constant for the inactivated Ca2+ channel state (KDI) was computed in a first approach using the equation 1/KD−40 mV=h/KDR+(1-h)/KDI according to Bean (1984) where h is the proportion of non-inactivated channels (0.7 at −40 mV), KD−40 mV is the EC50 at a holding potential of −40 mV, and the apparent dissociation constant for the resting state (KDR) is assumed to be the EC50 at −80 mV (obtained at voltage pulses of 100 ms at 0.2 Hz). In a second approach, KDI was computed from the shift of the steady state inactivation curve with −ΔVh=k*In[(1+[D])/KDI)/(1+[D]/KDR)] according to Bean et al. (1983) where k is the slope factor determined from the control curve, ΔVh the shift of the curve induced by the drug, and [D] the concentration of the drug. KDR was approximated as described above. In the last approach, KDI with KDI=koff/kon was obtained from the plot of the inverse time constants observed during development of block versus concentration of the drug yielding kon from the slope and koff from the y-intercept of a straight line by which the data were fitted (Motulsky, 1999).
Results
Both barnidipine and nifedipine reduced the magnitude of L-type Ca2+ current (ICa(L)) in cardiomyocytes. Using 100 ms pulses to 0 mV from a holding potential of −80 mV at 0.2 Hz, the effects of nifedipine (100 nM) developed about three times faster than those of barnidipine (100 nM) in wash-in experiments (Figure 1A). In contrast to nifedipine (Méry et al., 1996), the development of the effects of barnidipine showed no clear-cut dependence on concentration; the block of ICa(L) developed similarly with time constants of 161, 240, and 263 s with 10 nM, 100 nM, and 1 μM barnidipine, respectively (not shown). In addition, a wash-out of the effects of barnidipine was not observed within 30 min.
Figure 1.
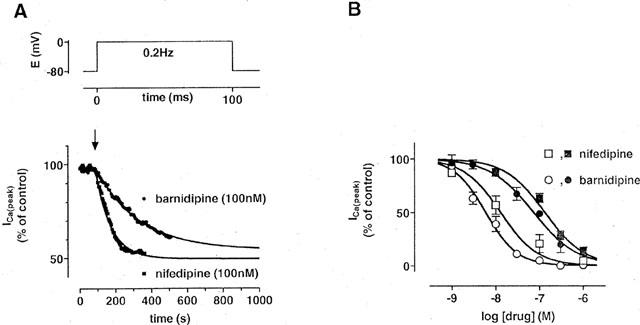
Effects of barnidipine and nifedipine on ICa(L) in rat ventricular cardiomyocytes. (A) Time course of the magnitude of ICa(L). ICa(L) was elicited by 100 ms depolarizing voltage pulses at 0.2 Hz as indicated. Barnidipine (100 nM) or nifedipine (100 nM) were added at the time indicated by the arrow. The time course of effects was fitted by monoexponential functions indicated by the lines (τ=240 s for barnidipine and 88 s for nifedipine). Data points represent means±s.e.mean (n=3 each). (B) Concentration-dependent effects of barnidipine and nifedipine on the magnitude of ICa(L). The EC50 values were 80 nM for barnidipine and 130 nM for nifedipine at a holding potential of −80 mV (closed symbols) and 6 and 18 nM at −40 mV, respectively (open symbols). Data points represent means±s.e.mean (n=6–12).
The effects of both drugs on the magnitude of ICa(L) were dependent on the holding potential; the EC50 of barnidipine and nifedipine were 80 and 130 nM at −80 mV, respectively, and 6 and 18 nM at −40 mV, respectively (Figure 1B). Both drugs did not influence the time course of inactivation of ICa; using a biexponential fit, the time constants of ICa(L) inactivation were 7.2±0.1 and 41±5 ms under control conditions (n=9), 8±0.2 and 42±2 ms in the presence of barnidipine (100 nM; n=6), and 7.3±0.3 and 43±3 ms in the presence of nifedipine (100 nM; n=6).
The voltage dependence of the effects of barnidipine and nifedipine was studied by the determination of the steady-state inactivation curves of ICa(L). Under control conditions, half-maximal inactivation of ICa(L) was observed at −32±2 mV (n=5). Both barnidipine and nifedipine (100 nM each) produced a leftward shift in the steady-state inactivation curve; half-maximal inactivation was observed at −55±3 and −53±4 mV, respectively (n⩾3 each) demonstrating an increase in block at less negative potentials (Figure 2). The block of ICa(L) by barnidipine and nifedipine was not fully eliminated at negative holding potentials. After conditioning pulses to −120 for 3 s, ICa(L) was still reduced to 57±9% (n=3) by barnidipine (100 nM) and to 67±3% (n=4) by nifedipine (100 nM). These results indicate that the block by barnidipine and nifedipine of ICa(L) comprises two components in this condition.
Figure 2.
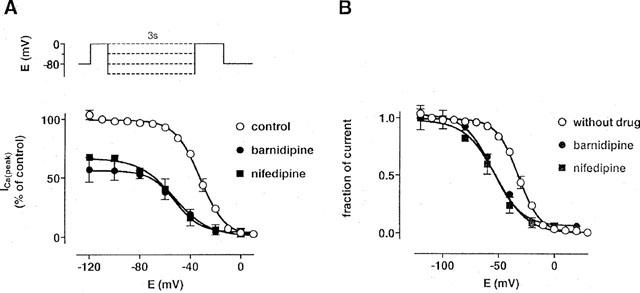
Effects of barnidipine and nifedipine on the steady-state inactivation curve of ICa(L). The voltage protocol is shown above; a brief (10 ms) pulse to −40 mV preceding the test to 0 mV was used to inactivate the fast sodium current. The current measured during the test pulse is plotted against the conditioning pulse potential and expressed in per cent of the control (A) and as normalized values (B). Lines represent fits of the data with Boltzmann functions. The half-maximal inactivation was observed at −32±2 mV (n=5) under control conditions, −55±3 mV (n=3) in the presence of barnidipine (100 nM), and −53±4 mV (n=5) in the presence of nifedipine (100 nM). Data points represent means±s.e.mean (n=3–5).
In another set of experiments, conditioning pulses to voltages between −120 and 0 mV were applied for 3 s, followed by a brief (100 ms) pulse to −80 mV, preceding the actual test pulse to 0 mV. ICa(L) was unaffected by the conditioning pulse under control conditions (Figure 3). In the presence of the drugs, ICa(L) decreased dependent on the voltage of the conditioning pulse. Half-maximal effects were observed at −55±3 mV (n=3) in the presence of 100 nM barnidipine and at −52±4 mV (n=5) in the presence of 100 nM nifedipine. These values were not different from those obtained by the investigation of ICa(L) steady-state inactivation.
Figure 3.
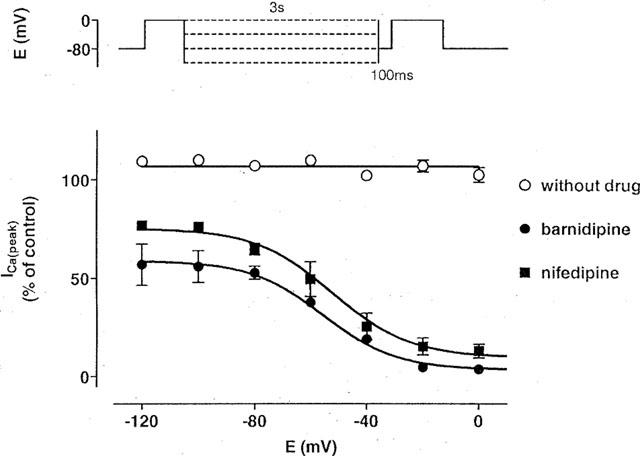
Voltage-dependent effects of barnidipine and nifedipine on ICa(L). The voltage protocol is shown above; a brief (100 ms) pulse to −80 mV preceding the test pulse to 0 mV was used to allow full recovery of ICa(L). The current measured during the test pulse is plotted against the conditioning pulse potential and expressed in per cent of the control. ICa(L) was not influenced by the conditioning pulses of 3 s to various voltages (between −120 and 0 mV) under control conditions. In the presence of the drugs, the data were fitted with Boltzmann functions indicated by the lines. The half-maximal effects were observed at −55±3 mV (n=3) in the presence of barnidipine (100 nM), and −52±4 mV (n=5) in the presence of nifedipine (100 nM). Data points represent means±s.e.mean (n=3–5).
A possible frequency dependence of the effects of barnidipine on ICa(L) was investigated by the use of 100 ms depolarizing voltage pulses to 0 mV at 0.1 and 1 Hz. The block of ICa(L) by barnidipine, but not by nifedipine, was marginally enhanced at 1 Hz as compared to 0.1 Hz (Figure 4). Barnidipine (100 nM) reduced ICa(L) to 53±2% (n=6) at 0.1 Hz and to 41±3% (n=6) at 1 Hz.
Figure 4.
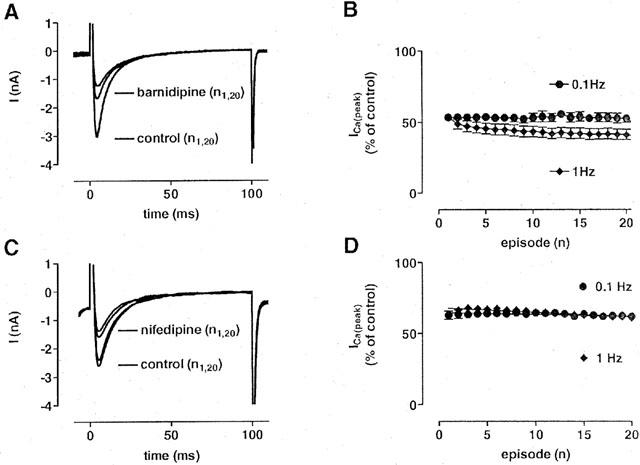
Frequency-dependent effects of barnidipine and nifedipine on ICa(L). (A, C) Original recordings of ICa(L) under control conditions and in the presence of barnidipine (100 nM; A) or nifedipine (100 nM; C). ICa(L) was elicited by 100 ms depolarizing voltage pulses to 0 mV at 1 Hz. Current traces obtained at first (n1) and at the 20th voltage pulse (n20) are superimposed under control conditions and in the presence of the drug. (B, D) Fraction of ICa(L) at stimulation frequencies of 0.1 and 1 Hz using 100 ms depolarizing voltage pulses to 0 mV in the presence of barnidipine (100 nM; B) or nifedipine (100 nM; D). In the presence of barnidipine, the block of ICa(L) was marginally pronounced at the higher frequency of stimulation. In the presence of nifedipine, no frequency-dependent effects on the amount of block were observed. Data points represent means±s.e.mean. (n=3–6).
The frequency-dependent component of block indicates a partial use-dependence of the effects of barnidipine. Twin pulses were applied to highlight this phenomenon. The duration of the first pulse was varied between 12 ms and 10 s, whereas the duration of the second test pulse was set at 100 ms. The interval between the two pulses was fixed at 100 ms to allow complete recovery of ICa(L) under control conditions. In the presence of barnidipine, the length of the first pulse determined the magnitude of ICa(L) during each second pulse (Figure 5). A plot of I2/I1 against the duration of the first pulse yielded monoexponential decay curves with time constants of 4.5±0.6 s (n=3) at 1 nM, 1.3±0.15 s (n=3) at 10 nM, and 0.19±0.03 s (n=5) at 100 nM barnidipine, respectively, reflecting onset of block. Using the steady state values, the EC50 of barnidipine was estimated to 1 nM in this condition. Without drug, the curve declined from about 1.35 to 1 (τ=3.5±1 s; n=9–12) reflecting a time-dependent loss of twin-pulse induced facilitation of ICa(L) (Nawrath & Wegener, 1997).
Figure 5.
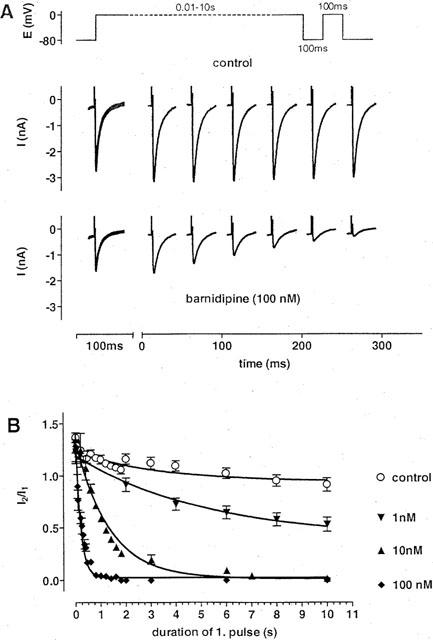
Development of block of ICa(L) by barnidipine. (A) Original recordings of ICa(L) in response to the twin pulse protocol shown above. The duration of the first pulse was varied from 12 ms to 10 s followed by a 100 ms second pulse. Pulse interval was set to 100 ms. Current traces are shown under control conditions and in the presence of barnidipine (100 nM). The current traces obtained during the first pulse are superimposed, whereas the current traces obtained during the second pulse are depicted at the times corresponding to the duration of the first pulse. The duration of the first pulse determined the block of ICa(L) by barnidipine during the second pulse. (B) Fractions of current (I2/I1) as function of the first pulse duration at different concentrations of barnidipine and under control conditions. The values were fitted by monoexponential functions with time constants of 4.5±0.6 s (n=3) at 1 nM, 1.3±0.15 s (n=3) at 10 nM, and 0.19±0.03 s (n=5) at 100 nM barnidipine, respectively. Under control conditions, the fit approached one with a time constant of 3.5±1 s (n=9–12). Symbols represent means±s.e.mean (n=3–12).
The effects of barnidipine on the recovery of ICa(L) from inactivation were examined by another twin pulse protocol. The duration of the first and second voltage pulse was set to 10 and 0.1 s, respectively, whereas the pulse interval was varied between 10 ms and 30 s. The length of the pulse interval determined the amount of recovery seen during the second pulse (Figure 6). Under control conditions, the recovery of ICa(L) was virtually complete within 100 ms. In the presence of barnidipine, the recovery of ICa(L) was significantly slowed down. The time constants of recovery amounted to 12±1 ms (n=8) under control conditions, 1.6±0.2 s (n=3) at 10 nM, and 1.4±0.1 s (n=3) at 100 nM barnidipine, respectively. Whereas the onset of block was concentration-dependent, the offset of block was independent from the drug concentration.
Figure 6.
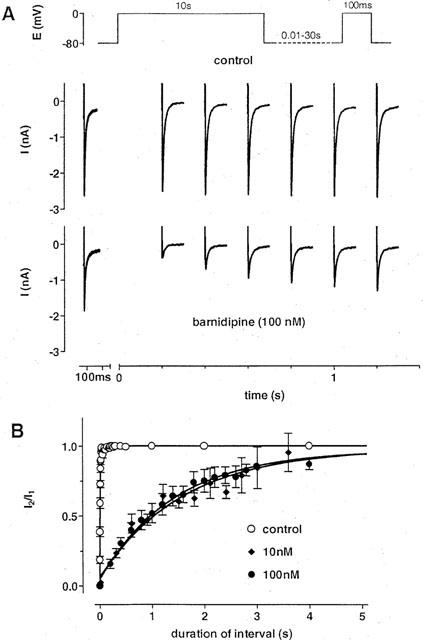
Effects of barnidipine on the recovery of ICa(L) from inactivation. (A) Original recordings of ICa(L) in response to the twin pulse protocol shown above. The duration of the first pulse was set to 10 s followed by a 100 ms second pulse. The pulse interval was varied between 12 ms and 30 s. Current traces are shown under control conditions and in the presence of barnidipine (100 nM). The current traces obtained during the first pulse are superimposed, whereas the current traces obtained during the second pulse are depicted at the times corresponding to the duration of the pulse interval. Barnidipine delayed the recovery from inactivation as compared to the control recording. (B) Fractions of current (I2/I1) as function of the interval duration at different concentrations of barnidipine and under control conditions. The values were fitted by monoexponential functions with time constants of 1.6±0.2 s (n=3) at 10 nM, and 1.4±0.1 s (n=3) at 100 nM barnidipine, respectively. Under control conditions, the fit revealed a time constant of 12±1 ms (n=8). Symbols represent means±s.e.mean (n=3–12).
For comparison, onset and offset of block were also studied with nifedipine (Figure 7). The time constants of onset of block were 5±1.3 s (n=3) at 10 nM, 2±0.1 s (n=3) at 30 nM, and 0.8±0.03 s (n=7) at 100 nM nifedipine, respectively. Using the steady state values, the EC50 of nifedipine was estimated to 10 nM in these conditions. Recovery of ICa(L) was slowed down by nifedipine; the time constants of recovery amounted to 0.45±0.03 s (n=3) at 30 nM and to 0.5±0.06 s (n=7) at 100 nM nifedipine, respectively.
Figure 7.
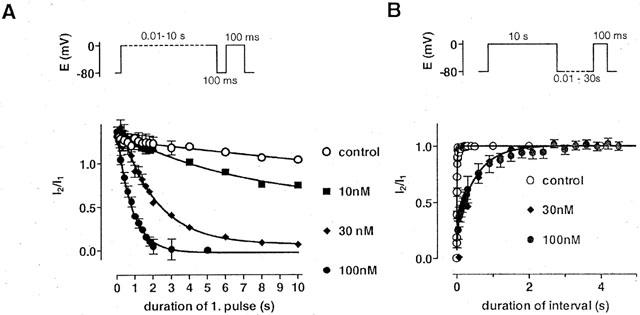
Development of and recovery from block in the presence of nifedipine. (A) Development of block of ICa(L) by nifedipine in response to the twin pulse protocol as shown above. Fractions of current (I2/I1) are shown as function of the duration of the first pulse at different concentrations of nifedipine and under control conditions. The values were fitted by monoexponential functions with time constants of 5±1.3 s (n=3) at 10 nM, 2±0.1 s (n=3) at 30 nM, and 0.8±0.03 s (n=7) at 100 nM nifedipine, respectively. Under control conditions, the fit approached one with a time constant of 3.5±1 s (n=9–12). Symbols represent means±s.e.mean (n=3–12). (B) Effects of nifedipine on the recovery of ICa(L) from inactivation in response to the twin pulse protocol as shown above. Fractions of current (I2/I1) are shown as function of the interval duration at different concentrations of nifedipine and under control conditions. The values were fitted by monoexponential functions with time constant of 0.45±0.03 s (n=3) at 30 nM and of 0.5±0.06 s (n=7) at 100 nM nifedipine, respectively. Under control conditions, the fit revealed a time constant of 12±1 ms (n=8). Symbols represent means±s.e.mean (n=3–8).
The development of block by barnidipine and nifedipine was assumed to represent the association of the drugs with their receptor sites on the Ca2+ channel, obeying a single binding site kinetics. From the plot 1/τobserved versus concentration (Figure 8), the apparent rate constants for the association and dissociation of the drugs were obtained. The resulting apparent dissociation constant at 0 mV was 4 nM for barnidipine and 11 nM for nifedipine.
Figure 8.
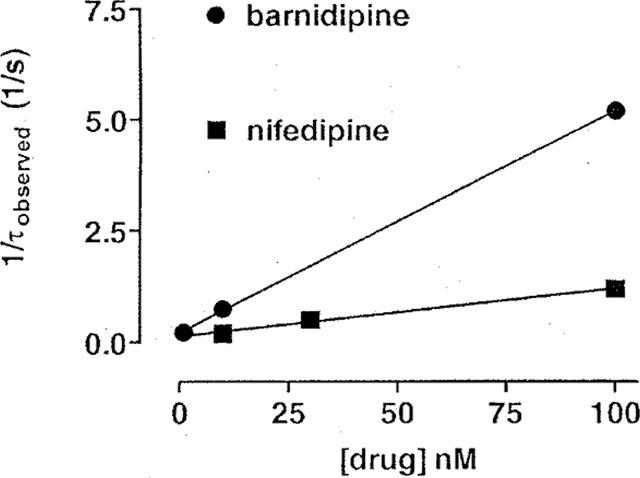
Calculation of the apparent dissociation constants for barnidipine and nifedipine assuming a single binding site model. The observed time constants (τobserved) for the development of block by barnidipine (see Figure 5) and nifedipine (see Figure 7A) were plotted as 1/τobserved against the concentration. According to Motulsky (1999), values of kon were obtained from the slope and values of koff from the y-intercept of the straight lines which fitted fairly well the data. For barnidipine, kon was 5*107 M−1*s−1 and koff was 0.22 s−1. For nifedipine, kon was 1*107 M−1*s−1 and koff was 0.12 s−1. The corresponding apparent dissociation constants were 4 nM for barnidipine and 11 nM for nifedipine.
According to Starmer et al. (1989), apparent cumulative association-dissociation curves for barnidipine (100 nM) and nifedipine (100 nM) were computed for 100 ms depolarizing voltage pulses to 0 mV at 1 Hz, taking into account the experimentally determined time constants (Figure 9A). During each interval at 0 mV, a fraction of the unblocked channels becomes blocked. During each interval at −80 mV, blocked channels continuously recover from block. The theoretical curves predict fairly well the amount of block of ICa(L) observed experimentally.
Figure 9.
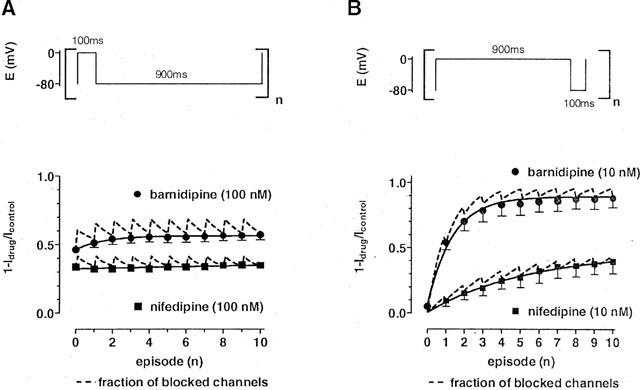
Measured and calculated block of ICa(L) in the presence of barnidipine or nifedipine. The fractions of blocked channels (1-Idrug/Icontrol) are plotted against the number of episodes. The dashed lines represent the calculated fractions of blocked channels in the presence of either barnidipine or nifedipine, incorporating the experimentally determined time constants of onset and offset of block at 0 and −80 mV, respectively. (A) ICa(L) was elicited at 1 Hz using 100 ms depolarizing voltage pulses in the presence of either barnidipine (100 nM) or nifedipine (100 nM). The measured data (filled symbols; means±s.e.mean; see Figure 5) matched fairly well the predicted amount of blocked channels. Solid lines represent a fit of the data by a monoexponential function (τ=1.4±0.3 s; n=3) in the presence of barnidipine and by a linear function (y=0.0026*×+0.34) in the presence of nifedipine. (B) ICa(L) was elicited at 1 Hz using 900 ms depolarizing voltage pulses in the presence of either barnidipine (10 nM) or nifedipine (10 nM). The measured data (filled symbols; means±s.e.mean; n=3–5) matched fairly well the predicted amount of blocked channels. Solid lines represent a fit of the data by a monoexponential function (τ=2.8±0.07 s (n=3) in the presence of barnidipine and τ=5.4±0.6 s (n=5) in the presence of nifedipine).
In the reverse pulse protocol (900 ms depolarization and 100 ms repolarization, 1 Hz), the calculation of the cumulative association-dissociation curves for barnidipine and nifedipine revealed a frequency-dependence of the block ICa(L) at 10 nM (Figure 9B). This concentration was almost ineffective when 100 ms depolarizing voltage pulses to 0 mV at 0.2 Hz were used (see Figure 1).
Discussion
The present study has shown that barnidipine, a dihydropyridine derivative, was nearly equipotent in depressing L-type Ca2+ currents (ICa(L)), elicited by a standard pulse protocol (100 ms voltage clamp pulses from −80 to 0 mV at 0.2 Hz) as compared to its congener nifedipine. The EC50 values of barnidipine and nifedipine were reduced 13 fold and 7 fold, respectively, when the membrane potential was changed from −80 to −40 mV, the effects of barnidipine being slightly more pronounced in this condition than those of nifedipine. The voltage-dependence of the effects of barnidipine and nifedipine was also evident from a leftward shift of the steady state inactivation curve of ICa(L) by about 20 mV. Similar effects have been described for several dihydropyridines (DHP), including nisoldipine (Sanguinetti & Kass, 1984), nifedipine (Uehara & Hume, 1985), and lacidipine (Cerbai et al., 1997).
The effects of barnidipine on ICa(L) developed slower as compared to nifedipine in wash-in experiments and were not reversible within the time course of the experiments (about 30 min). These findings suggest that barnidipine exhibits a stronger interaction with the lipophilic cell membrane as compared to nifedipine. Indeed, barnidipine showed a larger octanol/water partition coefficient than nifedipine (2000 for barnidipine and 2.6 for nifedipine; Satoh, 1991). It may be well that the observed development of block by barnidipine in wash-in experiments include the interaction of the drug with both the cell membrane and its receptor site and is, therefore, not useful to determine kinetic parameters of drug-receptor interaction.
In our study, we studied the differences in potency of barnidipine and nifedipine by investigating their interaction with the Ca2+ channel by the application of twin voltage pulses varied in length and interval, in the steady state of drug-tissue distribution. In contrast to wash-in/wash-out experiments, the effects of the drugs are therefore not hampered by diffusion or accumulation of the drugs in the cell membrane and are supposed to reflect exclusively the interaction of the drugs with their binding sites at different voltages.
Voltage-dependent effects of Ca2+ antagonists are commonly interpreted according to the modulated or guarded receptor theory (Hondeghem & Katzung, 1984; Starmer et al., 1989). In these models, the drugs appear to interact with certain conformations of the Ca2+ channel which are, in a simplified model, the resting (R), open (O) and inactivated (I) state (McDonald et al., 1994). The presence of these states is dependent on the membrane voltage: at negative membrane voltages (e.g. −80 mV), the resting state predominates, whereas more positive voltages (e.g. −40 mV) favour the inactivated state. Therefore, the availability of the inactivated state is believed to vary from virtually 100% (at 0 mV) to 0% (at −80 mV). Based on these considerations, it is assumed that the described time constants of development of block in the presence of the drug represent the net binding of the drug to the inactivated channel state (at 0 mV), whereas the time constants for recovery from block may represent the net unbinding from either the inactivated or the resting state (at −80 mV). Since the time constants of development of block were dependent on concentration and the time constants of recovery from block were not, a single binding site model was applied according to the law of mass action (Taylor & Insel, 1990). Using the time constants of net binding, differences in the potency of barnidipine and nifedipine were expressed in terms of the apparent dissociation constant for the inactivated Ca2+ channel state (KDI). The calculation according to Motulsky (1999) revealed a 3 fold lower value for barnidipine than for nifedipine: the apparent KDI was computed to 4 nM for barnidipine and to 11 nM for nifedipine. Similar values for both drugs were obtained using the approaches according to Bean et al. (1983) (2 and 6 nM, respectively) and Bean (1984) (4 and 8 nM, respectively) or using the EC50 of the drugs after long depolarizing voltage pulses (1 and 10 nM, respectively). The difference in the apparent KDI of barnidipine and nifedipine, presumably reflecting the affinity to the inactivated Ca2+ channel state, is likely to account for the observed differences in frequency and voltage dependence of the effects of both drugs. An estimation of the apparent dissociation constant for the resting Ca2+ channel state (KDR ) of barnidipine and nifedipine was performed using their computed apparent KDI of 4 and 11 nM, respectively. Using the shift in the steady state inactivation curve according to Bean et al. (1983), the values were 74 and 221 nM, respectively, which approximate roughly their EC50 observed at −80 mV using the standard voltage protocol.
The apparent time constants, at a given drug concentration, of net binding/unbinding were much faster than those described in wash-in/wash-out experiments (see Méry et al., 1996). This may be related to diffusion, unspecific binding sites, and lipophilicity of the drugs. The onset of the effects of the dihydropyridine derivative BayK8644, seen with rapid application techniques, was still 10 fold slower than in flash-induced competition experiments (Bechem & Hoffmann, 1993). It is thus thought that the measurement of time constants in the steady state of drug distribution is a more accurate measure of drug-receptor interactions than of those in wash-in and wash-out experiments.
Our results confirm and extend the view that membrane voltage, and/or Ca2+ channel state, are major determinants for the effects of several calcium antagonists as pointed out in the scheme of Figure 10. DHP are believed to interact with the resting and inactivated state, respectively (Bean, 1984; Sanguinetti & Kass, 1984; Méry et al., 1996; this study), the resting state representing a low and the inactivated state a high affinity receptor site which explains that part of the cardiac effects of dihydropyridines was not removed by hyperpolarizing voltage pulses at the concentrations used (100 nM). An interaction of DHP with the open state is unlikely since the time course of ICa(L) inactivation did not change in the presence of nifedipine or barnidipine (Méry et al., 1996; this study) although it has been suggested for isradipine at high concentrations (Lacinova & Hofmann, 1998). For comparison, the effects of verapamil have been ascribed to the interaction with inactivated state since they were almost solely voltage-dependent (Nawrath & Wegener, 1997). In addition, fendiline, another Ca2+ antagonist belonging to the group of phenylalkylamines, has been shown to interact mainly with the open state, its effects being more pronounced when the availability of open channels is increased (Nawrath et al., 1998)
Figure 10.
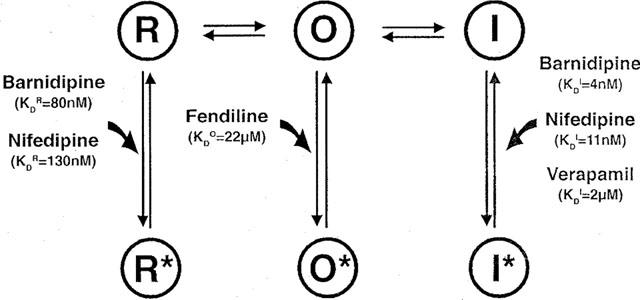
Simplified model of Ca2+ channel state transitions under control conditions and in the presence of Ca2+ channel antagonists. Under control conditions, voltage-dependent Ca2+ channels exist in three main states during an excitation cycle: the resting (R), open (O), and inactivated (I) state. Ca2+ channel antagonists may bind to each channel state resulting in drug-bound channel states: the resting (R*), open (O*), and inactivated (I*) channel state. As pointed out in the Discussion, barnidipine and nifedipine are assumed to bind to high affinity binding sites of I leading to I* and to low affinity binding sites of R leading to R*. For comparison, the scheme shows also the proposed interaction of verapamil (Nawrath & Wegener, 1997), and fendiline (Nawrath et al., 1998) with I and O, respectively. The apparent dissociation constants for the interaction of the drugs with R, I, and O are indicated as KDR, KDI, and KDO, respectively. The KDI were computed from the observed time constants for the development of block (this study, Nawrath & Wegener, 1997). The KDO was calculated from time constants describing fractional Ba2+ current changes, according to Nawrath et al. (1998), at different concentrations of fendiline (unpublished data). The KDR were approximated from the concentration–response curves at a holding potential of −80 mV according to Bean (1984).
It has been shown that the effects of DHP are more pronounced in vascular than cardiac tissue (Sun & Triggle, 1995). This difference may be due to a lower membrane potential in vascular (−50 mV) as compared to cardiac myocytes (−90 mV) leading to different amounts of inactivated Ca2+ channels, these channel states being the main target of DHP (Morel & Godfraind, 1987; Wibo, 1989; Herzig et al., 1992; Sun & Triggle, 1995). Interestingly, the difference in DHP potency may be additionally explained by the presence of different receptor subtypes in vascular and cardiac tissue (Welling et al., 1993). Recently, a pronounced interaction of DHP with the resting state of the Ca2+ channel subtype found in vascular tissue has been described which was not apparent with the Ca2+ channel subtype found in the myocardium (Welling et al., 1997). As a consequence, the differences in DHP potency in cardiac and smooth muscle tissue may be set by differences in the amount of the receptor sites as well as in the molecular structure of Ca2+ channels in both tissues.
In summary, the present study has been shown that the availability of inactivated Ca2+ channels determines the effects of barnidipine, as has been shown earlier for nitrendipine (Bean, 1984) and verapamil (Nawrath & Wegener, 1997). Since the time constants of net binding/unbinding to and from inactivated Ca2+ channels differ considerably among the substances mentioned above, periodical changes in the membrane potential, as in the heart or in certain experimental conditions, can significantly determine the efficacy of drugs which act dependent on channel states.
Acknowledgments
The study was supported by grants from the Deutsche Forschungsgemeinschatt, the Umweltministerium of Rheinland-Pfal (Germany), and Yamanouchi Pharmaceutical Co. Ltd. (Tokyo, Japan) (to H. Nawrath). We thank Dr Korstanje (Yamanouchi, Europe) for advice and the gift of barnidipine. This work contains parts of the M.D. thesis of H. Meyrer.
Abbreviations
- DHP
dihydropyridine
- ICa(L)
L-type Ca2+ current
- KDI
apparent dissociation constant for the inactivated Ca2+ channel state
References
- BEAN B.P. Nitrendipine block of cardiac calcium channels: high-affinity binding to the inactivated state. Proc. Natl. Acad. Sci. U.S.A. 1984;81:6388–6392. doi: 10.1073/pnas.81.20.6388. [DOI] [PMC free article] [PubMed] [Google Scholar]
- BEAN B.P., COHEN C.J., TSIEN R.W. Lidocaine block of cardiac sodium channels. J. Gen. Physiol. 1983;81:613–642. doi: 10.1085/jgp.81.5.613. [DOI] [PMC free article] [PubMed] [Google Scholar]
- BECHEM M., HOFFMANN H. The molecular mode of action of the Ca agonist (−) BAY K 8644 on the cardiac Ca channel. Pflügers Arch. 1993;424:343–353. doi: 10.1007/BF00384362. [DOI] [PubMed] [Google Scholar]
- CATTERALL W.A., STRIESSNIG J. Receptor sites for Ca2+ channel antagonists. Trends Pharmacol. Sci. 1992;13:256–262. doi: 10.1016/0165-6147(92)90079-l. [DOI] [PubMed] [Google Scholar]
- CERBAI E., GIOTTI A., MUGELLI A. Characteristics of L-type calcium channel blockade by lacidipine in guinea-pig ventricular myocytes. Br. J. Pharmacol. 1997;120:667–675. doi: 10.1038/sj.bjp.0700951. [DOI] [PMC free article] [PubMed] [Google Scholar]
- CHERNOFF D.M., STRICHARTZ G.R. Binding kinetics of local anesthetics to closed and open sodium channels during phasic inhibition: relevance to antiarrhythmic actions Molecular and cellular mechanisms of antiarrhythmic agents 1989Mount Kisko: Futura; 307–335.ed. Hondeghem, L.M. [Google Scholar]
- HAMILL O.P., MARTY A., NEHER E., SAKMANN B., SIGWORTH F.J. Improved patch-clamp techniques for high resolution current recording from cells and cell free membrane patches. Pflügers Arch. 1981;391:85–100. doi: 10.1007/BF00656997. [DOI] [PubMed] [Google Scholar]
- HERBETTE L.G., GAVIRAGHI G., TULENKO T., MASON R.P. Molecular interaction between lacidipine and biological membranes. J. Hypertens. 1993;11 Suppl:S13–S19. doi: 10.1097/00004872-199303001-00003. [DOI] [PubMed] [Google Scholar]
- HERZIG S., LULLMANN H., SIEG H. Frequency- and potential-dependency of the negative inotropic action of various dihydropyridine and non-dihydropyridine calcium antagonists. Pharmacol. Toxicol. 1992;71:229–235. doi: 10.1111/j.1600-0773.1992.tb00552.x. [DOI] [PubMed] [Google Scholar]
- HONDEGHEM L.M., KATZUNG B.G. Antiarrhythmic agents: the modulated receptor mechanism of action of sodium and calcium channel-blocking drugs. Ann. Rev. Pharmacol. Toxicol. 1984;24:387–423. doi: 10.1146/annurev.pa.24.040184.002131. [DOI] [PubMed] [Google Scholar]
- LACINOVA L., HOFMANN F. Isradipine interacts with the open state of the L-type calcium channel at high concentrations. Receptors and Channels. 1998;6:153–164. [PubMed] [Google Scholar]
- MASON R.P., CAMPBELL S.F., WANG S.D., HERBETTE L.G. Comparison of location and binding for the positively charged 1,4-dihydropyridine calcium channel antagonist amlodipine with uncharged drugs of this class in cardiac membranes. Mol. Pharmacol. 1989;36:634–640. [PubMed] [Google Scholar]
- MCDONALD T.F., PELZER S., TRAUTWEIN W., PELZER D.J. Regulation and modulation of calcium channels in cardiac, skeletal and smooth muscle cells. Physiol. Rev. 1994;74:365–507. doi: 10.1152/physrev.1994.74.2.365. [DOI] [PubMed] [Google Scholar]
- MERCK 1996Whitehouse Station: Merck & Co., Inc; Index, 12th edn [Google Scholar]
- MÉRY P.F., HOVE-MADSEN L., MAZET J.L., HANF R., FISCHMEISTER R. Binding constants determined from Ca2+ current responses to rapid applications and washouts of nifedipine in frog cardiac myocytes. J. Physiol. (Lond.) 1996;494:105–120. doi: 10.1113/jphysiol.1996.sp021479. [DOI] [PMC free article] [PubMed] [Google Scholar]
- MOREL N., GODFRAIND T. Prolonged depolarization increases the pharmacological effect of dihydropyridines and their binding affinity for calcium channels of vascular smooth muscle. J. Pharmacol. Exp. Ther. 1987;243:711–715. [PubMed] [Google Scholar]
- MOTULSKY H.J. Analyzing kinetic binding data Analyzing Data with Graphpad Prism 1999San Diego: Graphpad Software; 295–305.ed. Motulsky, H.J. pp [Google Scholar]
- NAWRATH H., WEGENER J.W. Kinetics and state-dependent effects of verapamil on cardiac L-type calcium channels. Naunyn Schmiedeberg's Arch. Pharmacol. 1997;355:79–86. doi: 10.1007/pl00004921. [DOI] [PubMed] [Google Scholar]
- NAWRATH H., KLEIN G., RUPP J., WEGENER J.W., SHAINBERG A. Open state block by fendiline of L-type Ca++ channels in ventricular myocytes from rat heart. J. Pharmacol. Exp. Ther. 1998;285:546–552. [PubMed] [Google Scholar]
- NAYLER W.G. London: Academic Press; 1988. Calcium antagonists. [Google Scholar]
- ROBERTS R., ZANCHETTI A. Calcium antagonists Cardiovascular Drug Therapy 1996Philadelphia: WB Sounders; 891–901.ed. Messerli, F.H. pp [Google Scholar]
- SANGUINETTI M.C., KASS R.S. Voltage-dependent block of calcium channel current in the calf cardiac Purkinje fibre by dihydropyridine calcium channel antagonists. Circ. Res. 1984;55:336–348. doi: 10.1161/01.res.55.3.336. [DOI] [PubMed] [Google Scholar]
- SATOH H. Pharmacology and therapeutic effects of mepirodipine. Cardiovasc. Drug Rev. 1991;9:340–356. [Google Scholar]
- STARMER C.F. Theoretical characterization of ion channel blockade: ligand binding to periodically accessible receptors. J. Theor. Biol. 1986;119:235–259. doi: 10.1016/s0022-5193(86)80077-7. [DOI] [PubMed] [Google Scholar]
- STARMER C.F., NESTERENKO V.V., UNDROVINAS A.I., PACKER D.L., GILLIAM F.R., GRANT A.O., ROSENSHTRAUKH L.V., STRAUSS H.C. Characterizing ion channel blockade with the guarded receptor hypothesis Molecular and cellular mechanisms of antiarrhythmic agents 1989Mount Kisko: Futura; 179–200.ed. Hondeghem, L.M pp [Google Scholar]
- SUN J., TRIGGLE D.J. Calcium channel antagonists: cardiovascular selectivity of action. J. Pharmacol. Exp. Ther. 1995;274:419–426. [PubMed] [Google Scholar]
- TAYLOR P., INSEL P.A. Molecular basis of pharmacologic selectivity Principles of drug action 1990New York: Churchill Livingstone; 1–74.ed. Pratt, W.B. & Taylor, P. pp [Google Scholar]
- UEHARA A., HUME J.R. Interactions of organic calcium channel antagonists with calcium channels in single frog atrial cells. J. Gen. Physiol. 1985;85:621–647. doi: 10.1085/jgp.85.5.621. [DOI] [PMC free article] [PubMed] [Google Scholar]
- WEGENER J.W., NAWRATH H. Extracellular site of action of phenylalkylamines on L-type calcium current in rat ventricular myocytes. Naunyn Schmiedeberg's Arch. Pharmacol. 1995;352:322–330. doi: 10.1007/BF00168564. [DOI] [PubMed] [Google Scholar]
- WELLING A., KWAN Y.W., BOSSE E., FLOCKERZI V., HOFMANN F., KASS R.S. Subunit-dependent modulation of recombinant L-type calcium channels. Molecular basis for dihydropyridine tissue selectivity. Circ. Res. 1993;73:974–980. doi: 10.1161/01.res.73.5.974. [DOI] [PubMed] [Google Scholar]
- WELLING A., LUDWIG A., ZIMMER S., KLUGBAUER N., FLOCKERZI V., HOFMANN F. Alternatively spliced IS6 segments of the α1C gene determine the tissue-specific dihydropyridine sensitivity of cardiac and vascular smooth muscle L-type Ca2+ channels. Circ. Res. 1997;81:526–532. doi: 10.1161/01.res.81.4.526. [DOI] [PubMed] [Google Scholar]
- WIBO M. Mode of action of calcium antagonists: voltage-dependence and kinetics of drug-receptor interaction. Pharmacol. Toxicol. 1989;65:1–8. doi: 10.1111/j.1600-0773.1989.tb01116.x. [DOI] [PubMed] [Google Scholar]