

Abstract
In glioma C6 cells, the stimulation of P2Y receptors by ADP, ATP and UTP initiated an increase in the intracellular Ca2+ concentration, in a process that involved the release of Ca2+ from InsP3-sensitive store and the capacitative, extracellular Ca2+ entry. The presence of external Ca2+ was not necessary to elevate Ca2+.
The rank order of potencies of nucleotide analogues in stimulating [Ca2+]i was: 2MeSADP > ADP > 2MeSATP = 2ClATP > ATP > UTP. α,β-Methylene ATP, adenosine and AMP were ineffective.
ADP and UTP effects were additive, while actions of ATP and UTP were not additive on [Ca2+]i increase. Similarly, cross-desensitization between ATP and UTP but not between ADP and UTP occurred.
Suramin, a non-specific nucleotide receptors inhibitor, antagonized ATP-, UTP- and ADP-evoked Ca2+ responses. PPADS, a selective antagonist of the P2Y1 receptor-generated InsP3 accumulation, decreased ADP-initiated Ca2+ response with no effect on ATP and UTP.
Pertussis toxin (PTX) reduced ADP- and ATP-induced Ca2+ increases. Short-term treatment with TPA, inhibited both ATP and ADP stimulatory effects on [Ca2+]i.
ADP inhibited isoproterenol-induced cyclic AMP accumulation. PTX blocked this effect, but PPADS did not.
RT – PCR analysis revealed the molecular identity of P2Y receptors expressed by glioma C6 cells to be both P2Y1 and P2Y2.
It is concluded that both P2Y1 and P2Y2 receptors co-exist in glioma C6 cells. ADP acts as agonist of the first, and ATP and UTP of the second one. Both receptors are linked to phospholipase C (PLC).
Keywords: P2Y1 and P2Y2 receptors, Ca2+ mobilization, cyclicAMP accumulation, glioma C6 cells
Introduction
In a variety of mammalian cells, extracellular adenine and uridine nucleotides elicit their effect either directly through interactions with cell surface P2 receptors, or through a metabolite such as adenosine, interacting with A1 – A3 receptors (Burns, 1990; Burnstock, 1978; 1996; Ziganshin et al., 1994). The P2 receptors are now divided into two groups: the intrinsic ion channel P2X receptors and seven transmembrane domain, G-protein coupled, P2Y receptors (Boarder & Hourani, 1998; Burnstock 1996; Dubyak & El-Moatassim, 1993; Fredholm et al., 1997). Cloning and pharmacological studies revealed at least five distinct subtypes of P2Y receptors: P2Y1, P2Y2, P2Y4, P2Y6 and P2Y11 (Boarder & Hourani, 1998). All of the cloned P2Y receptors activate phospholipase C (PLC) and stimulate an increase in inositol 1,4,5-trisphosphate (InsP3) level. It has been found that the P2Y1 receptor responds selectively to ADP compared to ATP, while ATP may act as a partial antagonist. Moreover, 2-methylthio-ATP (2MeSATP) and 2-methylthio-ADP (2MeSADP) are selective agonists at P2Y1 receptor with the high potency, while UTP is not effective. On the contrary, the P2Y2 receptor responds both to ATP and UTP, while 2MeSATP has no effect on its activity. These two receptors differ also in an antagonist selectivity. The P2Y1 receptor-generated InsP3 accumulation is competitively blocked by pyridoxal-phosphate-6-azophenyl-2′,4′-disulphonic acid (PPADS), whereas the P2Y2 receptor is insensitive to this compound. P2Y4 and P2Y6 receptors are selective for UTP and UDP, respectively, whereas the P2Y11 receptor is selective for ATP but not for UTP (Boarder & Hourani, 1998; Nicholas et al., 1996; Webb et al., 1998).
While in many cell lines an activation of P2Y receptors is associated with an increase in PLC activity (Boyer et al., 1989), there are examples where the P2Y receptor is coupled to the inhibition of adenylyl cyclase (Boyer at al., 1993; 1994; 1995; 1996). The studies on glioma C6-2B and C6 cells have shown the presence of the P2Y1-like receptor that is coupled to the inhibition of adenylyl cyclase but is not effective in the activation of inositol phosphate accumulation and differs in dissimilar antagonist effect from the cloned human and rat P2Y1 receptors (Schachter et al., 1996; 1997). It has been therefore proposed that two distinct kinds of P2Y1-like receptors exist: one coupled to PLC and another one, native to glioma C6 cells, negatively coupled to adenylyl cyclase. However, this interpretation has been questioned by Webb et al. (1996), who suggested that the same, single P2Y1 receptor might be involved in different signalling pathways in different cell types. Thus, there is no conclusive evidence concerning identity of P2Y receptor subtypes in glioma C6 cells and the exact nature of the P2Y1 receptor driven signalling pathways is still unclear.
It is now generally accepted that in nonexcitable cells, such as C6 glioma, biphasic capacitative Ca2+ signalling is mediated by the inositol system (Berridge, 1995; Putney & Bird, 1993). In this process, the initial rise in [Ca2+]i results from the direct effect of InsP3 on the endoplasmic reticulum store and can be observed even in the absence of extracellular Ca2+ (the first phase). When the extracellular Ca2+ is present, the depletion of this store causes opening of specific, voltage-independent Ca2+ channels in the plasma membrane and Ca2+ influx from the extracellular space (the second phase). We have shown, that in glioma C6 cells extracellular ATP increases the cytosolic Ca2+ concentration in a process of biphasic capacitative Ca2+ entry associated with InsP3 accumulation and depletion of intracellular Ca2+ store, followed by Ca2+ influx from the extracellular space (Barańska et al., 1999; Sabała et al., 1997; Wójcik et al., 2000). However, in these cells, the effect of ADP and other nucleotide receptors agonists and antagonists on intracellular Ca2+ mobilization has never been examined. Therefore, the aim of this study was to characterize the functional P2Y1 and P2Y2 receptors in glioma C6 cells, using the measurement of intracellular Ca2+ concentration ([Ca2+]i). Effects of specific pharmacological agents (agonists and antagonists of P2Y1 and P2Y2 receptors) on Ca2+ mobilization should aid in resolving the question about the nature of coupling of both receptors.
Our results indicate the presence of co-existing P2Y1 and P2Y2 receptors in rat glioma C6 cells with similar pharmacological properties and the same molecular identity as the cloned rat P2Y1 and P2Y2 receptors. We demonstrate, that both of them are linked to PLC.
Methods
Cell culture
Glioma C6 cells, obtained from the American Type Culture Collection, were cultured in Minimum Essential Medium (MEM) supplemented with 10% calf serum, penicillin (50 IU ml−1), streptomycin (50 μg ml−1) and 2 mM L-glutamine under humidified atmosphere of 5% CO2 at 37°C. The cells were passaged when confluent by using nonenzymatic cell dissociation solution, and the medium was changed twice a week. Cells for experiments were seeded on glass coverslips and cultured for 3 days under the same conditions.
Measurement of intracellular calcium
Intracellular Ca2+ level was measured as described previously (Barańska et al., 1995) with the following modifications. Cells on coverslips were washed once with PBS and once with the solution containing (mM): NaCl 137, KCl 2.7, Na2HPO3 1, glucose 25, Hepes 20 (pH 7.4), MgCl2 1, 1% bovine serum albumin and 2 mM CaCl2 (later referred as a standard buffer). In the experiments concerning the absence of external Ca2+ 500 μM EGTA was added instead of 2 mM CaCl2. The cells were incubated at 37°C for 30 min in the standard buffer with 1 μM Fura-2 AM. Thereafter, the cells were washed three times with the standard buffer and coverslips were mounted in a chamber over a Nikon Diaphot inverted-stage microscope equipped with a ×40 oil-immersion fluorescence objective lens. Digital fluorescence microscopy was used to determine the changes in [Ca2+]i. Experiments were carried out on a video imaging system (MagiCal, Applied Imaging Ltd.). The cells were alternatively illuminated with 340 and 380 nm wavelengths of light from a xenon lamp. The emitted light was passed through a 510 nm barrier filter into an image-intensified camera (Extended ISIS, Photonic Science). The 340 and 380 nm images (256 gray levels) were software averaged and captured every 2.85 s. The 340 and 380 nm signals were examined for real changes in [Ca2+]i. Ratio (R) values were converted to an estimate of [Ca2+]i using the following formula (Grynkiewicz et al., 1985):
R – fluorescence ratio recorded from the cell, Rmin – fluorescence ratio in the absence of Ca2+, Rmax – fluorescence ratio in saturating concentration of Ca2+, Kd – calcium dissociation constant of the fura-2, β – the ratio of the fluorescence of fura-2 Ca2+-free form to the Ca2+-saturated form recorded at 380 nm. Intracellular calibration was carried out by addition of 4 μM ionomycin to glioma C6 cells placed in a solution containing 2 mM Ca2+ (Rmax=2.3) and no added calcium with 5 mM EGTA (Rmin=0.3). The β value was 4.5 and Kd of 224 nM was assumed. Data processing and ratio values conversion to an [Ca2+]i were carried out using Tardis V8.0 software.
All substances (agonists, antagonists, activators and inhibitors) were added as solutions in the standard buffer at final concentrations indicated in the figures.
Measurement of intracellular cyclic AMP
The adenylyl cyclase activity was estimated by measuring isoproterenol (50 μM) stimulated cyclic AMP accumulation according to Lin & Chuang (1994), assayed with the [3H]-cyclic AMP assay kit. Cell pellets were assayed for protein content by a modification (Markwell et al., 1978) of the procedure of Lowry et al. (1951), and the level of cyclic AMP was expressed in picomoles per mg of protein.
Isolation of P2Y1 and P2Y2 mRNA and RT – PCR analysis
Total RNA was extracted from glioma C6 cells using TRIZOL reagent. Reverse transcription of total RNA was performed using Expand RT enzyme. Specific primes for PCR reaction were designed using ‘DNA Star' software (DNA Star Inc. U.S.A.). P2Y1 primers were based on unique sequences stretching bases 97 – 120 (AGAATGCGGCCGGAAGAAGAGTCG, upper) and 686 – 666 (AGCCCAGGCCAGCCAGGAAGG, lower) of the rat P2Y1 sequence (Accession No. U22830). The estimated product length was 590 bp. P2Y2 primers were based on the following unique sequences: 392 – 415 (CCTCCCTGCCGCTGCTGGTTTATT, upper) and 1112 – 1091 (TCTGTGGCGGGCTTGGCATCTC, lower) of the rat P2Y2 sequence (Acc. No. L46865). The predicted product length was 721 bp. A hot-start PCR protocol was used involving denaturation at 95°C, 30 s, annealing at 65°C, 45 s and extension at 72°C, 2 min. Total of 35 cycles were conducted. PCR products were separated on 1% agarose gel, stained with ethidium bromide and quantified using ImageQuant and Excel programs.
Materials
Minimum Essential Medium, calf serum, antibiotics, TRIZOL reagent and phosphate buffered saline (PBS) were from Gibco BRL. ATP, ADP, AMP, UTP, BSA, EGTA, cell dissociation solution, ethidium bromide, agarose, molecular weight marker (123b), isoproterenol and phorbol ester, 12-O-tetradecanoylphorbol 13-acetate (TPA), were purchased from Sigma Chemical Co. Fura-2 AM was from Molecular Probes, Inc. 2MeSADP, 2MeSATP, 2-chloro-ATP (2ClATP), α,β-methylene ATP, PPADS and suramin hexasodium salt were obtained from Research Biochemicals International. PTX was purchased from Fluka. Expand RT enzyme was obtained from Boehringer Mannheim and Taq PCR Core Kit was obtained from QUIAGEN. [3H]-cyclic AMP assay kit was purchased from Amersham Pharmacia Biotech.
Data analysis
Data presentation and statistical analysis were performed using ImageQuant, Tardis 8.0 and MS Excel software. Each trace shown in Figures 1 and 4 represents the response of an individual cell studied in one particular experiment, each experiment was conducted on at least five occasions and data expressed as means±s.d. are indicated in the text. Data in Figures 2, 3 and 7 are presented as means±s.d. from the indicated number of experiments. Traces shown in Figures 5 and 6 represent the mean value of intracellular Ca2+ changes in the indicated number of cells tested in three independent experiments.
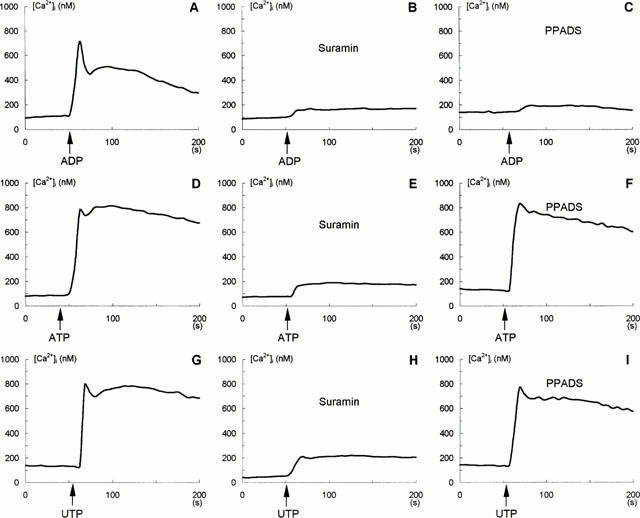
Figure 1.
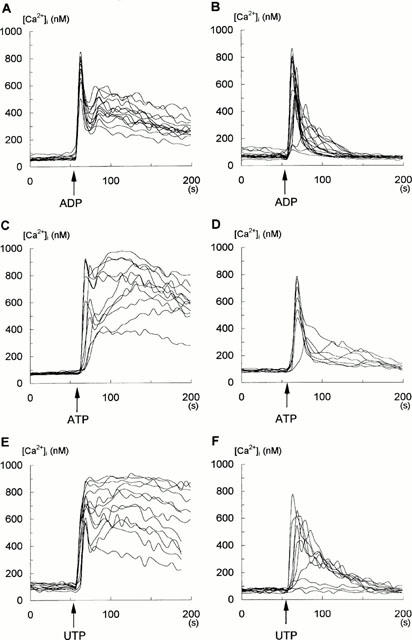
Effect of ADP (10 μM), ATP (100 μM) and UTP (100 μM) on changes in [Ca2+]i in single glioma C6 cells. [Ca2+]i was measured in Fura-2-loaded cells as described under Methods and experiments were performed either in the standard buffer containing 2 mM CaCl2 (A,C,E) or without CaCl2 but with 500 μM EGTA (B,D,F). Each trace in this figure represents the response of an individual cell tested during one typical experiment. Additions of ADP, ATP and UTP are indicated by arrows. Experiments in A,C,E were conducted on 10 separate occasions (number of cells tested: n=80). Experiments in B,D,F were conducted on five separate occasions (number of cells tested: n=40).
Figure 4.
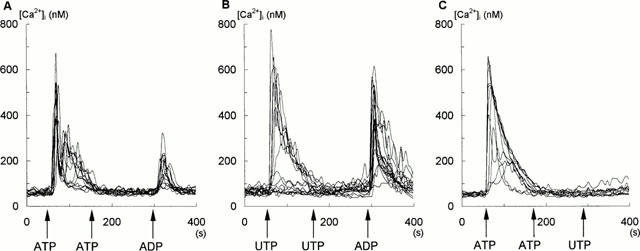
Effect of the sequential addition of ATP (100 μM), UTP (100 μM) and ADP (10 μM) on glioma C6 cells measured in the standard buffer without CaCl2 and with 500 μM EGTA. Each trace in this figure represents the response of an individual cell tested during one typical experiment. Additions of ADP, ATP and UTP are indicated by arrows. Experiments in A – C were conducted on three separate occasions (number of cells tested: n=24).
Figure 2.
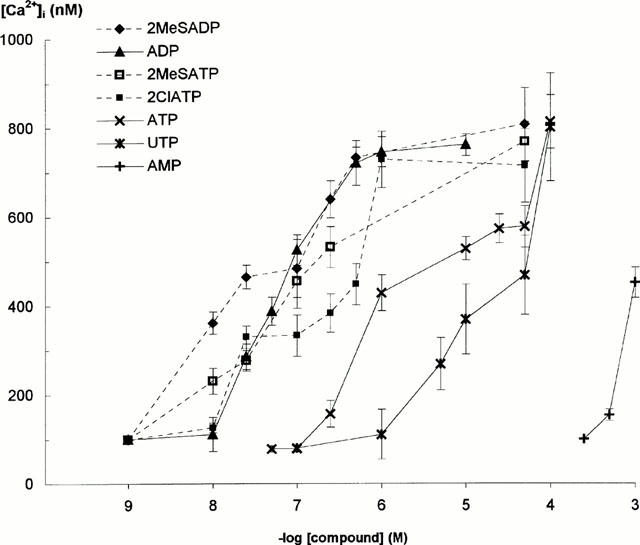
Concentration-dependent effect of ATP and ADP analogues on [Ca2+]i in Fura-2-loaded glioma cells tested in standard buffer containing CaCl2. Curves each represent the results of the five experiments (number of cells tested: n=40) and bars show the±s.d.
Figure 3.
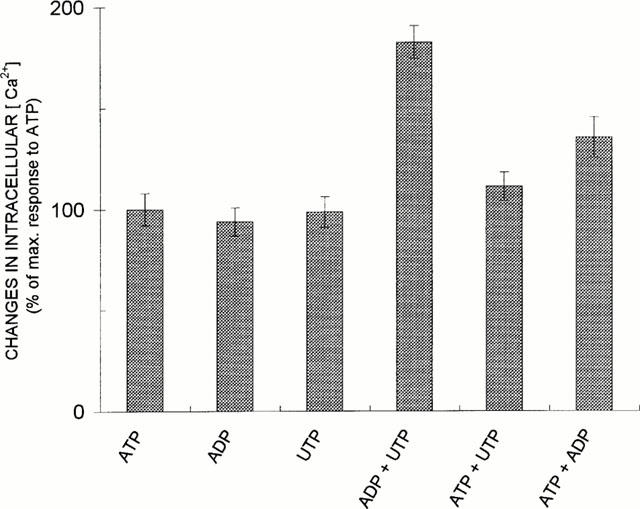
Additivity of ATP/ADP and UTP/ADP actions but not of ATP/UTP actions. Comparison of relative potencies of 10 μM ADP, 100 μM ATP and 100 μM UTP and their mixtures for increasing [Ca2+]i are shown. Cells were treated with nucleotides in the standard buffer with 2 mM CaCl. Means±s.d. from four experiments are shown (number of cells tested: n=32).
Figure 7.
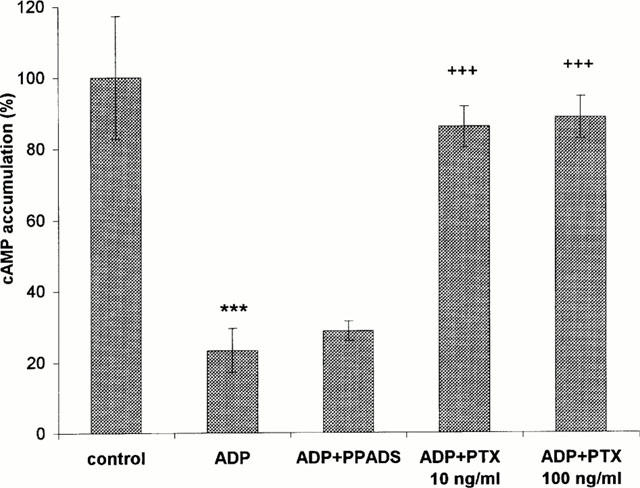
Effect of PTX and PPADS treatment on the inhibition induced by ADP of the isoproterenol-elicited cAMP response. The cells were treated with 50 μM isoproterenol in the absence or presence of ADP (10 μM) for 5 min at 37°C in the standard buffer. PTX (10 or 100 ng ml−1) was added to the culture medium 24 h and PPADS (100 μM) 2 min before the experiment. Cyclic AMP levels were assayed with the [3H]-cyclic AMP kit. The response to isoproterenol in the absence of added ADP was taken as 100%. The data are means±s.d. from four independent experiments done in duplicate. Statistical significance of differences, when comparing isoproterenol versus isoproterenol and ADP treated cells is ***P<0.001, and isoproterenol and ADP versus isoproterenol and ADP and PTX (10 and 100 ng ml−1) treated cells is +++P<0.001 (Student's t-test).
Figure 5.
Effect of P2Y nucleotide receptor antagonists, suramin and PPADS, on ADP-, ATP- and UTP-induced changes in [Ca2+]i in glioma C6 cells. [Ca2+]i was measured as described under Methods and experiments were performed in the standard buffer containing 2 mM CaCl2. A,D,G: Control cells, (A) 10 μM ADP added, (D) 100 μM ATP added, (G) 100 μM UTP added. B,E,H: Cells were treated with 1 mM suramin for 10 min prior to addition of 10 μM ADP (B), 100 μM ATP (E) and 100 μM UTP (H). G,F,I: Cells were treated with 100 μM PPADS for 2 min prior to addition of 10 μM ADP (C), 100 μM (F) and 100 μM UTP (I). Additions of ADP, ATP and UTP are indicated by arrows. Each trace represents a mean value for 24 cells. Each experiment was conducted on three separate occasions.
Figure 6.
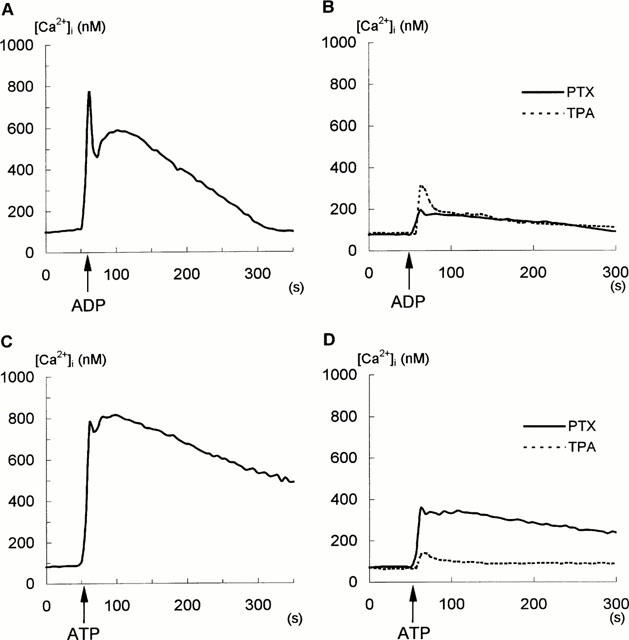
Modulation of ADP- and ATP- evoked Ca2+ signals in glioma C6 cells by PTX and phorbol ester, TPA, measured in the standard buffer containing 2 mM CaCl2. A,C: Control cells, (A) 10 μM ADP added, (C) 100 μM ATP added. B,D: Cells were treated 4 h with 500 ng ml−1 PTX (solid lines), or 5 min with 100 nM TPA (dashed lines) prior to addition of 10 μM ADP (B) or 100 μM ATP (D). Additions of ADP and ATP are indicated by arrows. Each trace represents a mean value for 24 cells. Each experiment was conducted on three separate occasions.
Results
Figure 1 shows that the addition of ADP, ATP and UTP induced rapid changes in [Ca2+]i in single, intact glioma C6 cells, in both the presence (Figure 1A,C,E) and absence (Figure 1B,D,F) of extracellular Ca2+. When extracellular medium contained 2 mM CaCl2, the addition of ADP, ATP and UTP caused a rapid rise in [Ca2+]i, reaching a maximum at few seconds. This increase was associated with the depletion of intracellular Ca2+ stores (the first phase) and was followed by the sustained elevation in [Ca2+]i (the second phase), which was a result of a subsequent influx of extracellular Ca2+ to the cells. Traces shown in Figure 1 represent the responses of individual cells studied in one particular experiment. The statistical analysis (mean value±s.d. data from 10 separate experiments and for the indicated number of cells n) revealed that the initial peak of Ca2+ elevation following exposure to 100 μM ATP was 811±60 nmol (n=80) and to 100 μM UTP was 799±121 nmol (n=80). ADP was more effective and in concentration 10 μM induced a similar huge rise in [Ca2+]i with the initial peak of Ca2+ amounted to 760±75 nmol (n=80). However, the kinetics of this ADP-evoked Ca2+ changes differed from those evoked by ATP and UTP. The ATP-and UTP-induced Ca2+ elevation, started with an initial peak response was followed by a long sustained plateau phase (Figure 1C,D) which, in most cases, was still above basal level even after 15 min exposure to both nucleotides (not shown). In contrast, the response to ADP was more transient. The initial Ca2+ peak declined distinctly towards basal line; there was a significant decrease in the level measured at 16 s after the ADP addition (Figure 1A). This peak was followed by the second, sustained phase that declined to the basal level at 300 s in almost all cells examined (84%, n=80) (see Figure 6A). In the absence of extracellular Ca2+ (500 μM EGTA), 10 μM ADP, 100 μM ATP and 100 μM UTP resulted only in the initial transient rise in [Ca2+]i which declined to the basal level (the first phase), indicating that this phase of the cytosolic Ca2+ increase was indeed caused by mobilization of intracellular Ca2+ stores (Figure 1B,D,F). The maximal values of Ca2+ elevation after exposure of cells to ADP amounted to 711±120 nmol (n=40) (Figure 1B), ATP to 676±103 nmol (n=40) (Figure 1D), and UTP to 597±59 nmol (n=40) (Figure 1F). Essentially, all cells (95%, 152 out of 160) responded to 10 μM ADP, while most responded to 100 μM ATP (85%, 204 out of 240) and 100 μM UTP (71%, 113 out of 160).
In order to characterize pharmacological properties of nucleotide receptors generating Ca2+ mobilization in glioma C6 cells, the increase in [Ca2+]i in response to various nucleotide analogues was measured. Figure 2 shows concentration-effect curves established for ATP and ADP analogues. The calculated EC50 values for Ca2+ mobilization induced by these agonists were as follows (in nM) 2MeSADP 20, ADP 84, 2MeSATP 148, 2ClATP 183; (in μM): ATP 4.5, UTP 15.8 and AMP 664. This relative potency: 2MeSADP > ADP > 2MeSATP = 2ClATP > ATP > UTP, was consistent with the order of potency expected for P2Y receptors. AMP was practically ineffective (Figure 2). P2X nucleotide receptors selective agonist, α,β-methylene ATP, and adenosine, interacting with A1 – A3 receptors, had no effect on the increase in [Ca2+]i in glioma C6 cells when assayed at concentrations up to 1 mM (not shown). It is worth noting that 2MeSATP, 2MeSADP and 2ClATP increased [Ca2+]i in a manner typical for ADP (Figure 1), i.e. with the initial Ca2+ peak (the first phase) distinctly separated from the second phase that declined very quickly towards basal level (not shown).
Figure 3 shows that a mixture of 10 μM ADP and 100 μM UTP raised [Ca2+]i level in an additive manner. On the contrary, 100 μM ATP and 100 μM UTP did not increase [Ca2+]i to a level higher than those observed for ATP and UTP alone, indicating that their action was nonadditive. On the other hand, the mixture of 10 μM ADP and 100 μM ATP produced only partial additive effect on the increase in [Ca2+]i. The similar results were obtained in experiments presented in Figure 4, where the cells were treated with sequential additions of nucleotides. As is shown, 100 μM ATP and 100 μM UTP added to the cells after the previous addition of the same concentration of these nucleotides had no further effect on the cytosolic Ca2+ level. Such ATP and UTP treated cells were capable to respond to ADP, although the ADP-induced rise in [Ca2+]i was larger in the cells first treated with UTP (Figure 4B), than in those treated with ATP (Figure 4A). In contrast, the cells treated with ATP failed to respond to UTP (Figure 4C), indicating that cross-desensitization between ATP and UTP occurred. These data suggested that ATP and UTP exerted their effects on a common subtype of the P2Y receptor, while ADP is recognized by another one.
The effect of P2Y nucleotide receptor antagonists on ADP-, ATP- and UTP-induced [Ca2+]i increase is presented in Figure 5. Suramin (1 mM), a broad spectrum P2 receptors inhibitor known to antagonize both P2Y1 and P2Y2 receptors, distinctly blocked the effect of ADP, ATP and UTP on [Ca2+]i by 90, 82 and 75%, respectively, compared to the control glioma C6 cells (Figure 5A,D,G versus B,E,H). On the other hand, PPADS (100 μM), a selective P2Y1 but not P2Y2 antagonist, strongly decreased the Ca2+ response to ADP (by 94%) (Figure 5C) but was without an influence on changes produced by ATP (Figure 5F) and UTP (Figure 5I). These results suggested the presence of both, P2Y1 and P2Y2 receptors, with ADP as agonist of the first, and ATP and UTP of the second one.
To examine the nature of coupling between P2Y receptors and intracellular Ca2+ elevation, Ca2+ responses to nucleotides in the control cells (Figure 6A,B) were compared to those in the cells pretreated with PTX (500 ng ml−1), or 100 nM TPA (Figure 6C,D). In experiments with PTX, the toxin was added to the culture medium 4 h before the experiments (Figure 6), but the similar results were obtained when the cells were treated 24 h with 100 ng ml−1 (not shown). As is shown, PTX reduced the 10 μM ADP- and 100 μM ATP-evoked [Ca2+]i increase by 88 and 59%, respectively (Figure 6C,D). Figure 6 also shows that short-term treatment (5 min) with 100 nM TPA strongly diminished the stimulatory effect of 10 μM ADP and 100 μM ATP on [Ca2+]i increase by 70 and 89%, respectively, suggesting protein kinase C (PKC) -inhibitory feedback (Figure 6C,D; dashed lines).
To check whether in the cell line studied herein ADP could inhibit adenylyl cyclase, experiments with ADP effect on cyclic AMP accumulation were performed. The level of cyclic AMP increased about 140 times (from 8±3 to 1115±195 pmol mg−1 protein) within 5 min in response to 50 μM isoproterenol. ADP, used at the same concentration (10 μM) as that inducing a large increase in [Ca2+]i, inhibited the isoproterenol-stimulated cyclic AMP synthesis by about 80%. This effect was significantly reversed by 24 h pretreatment of the cells with 10 ng ml−1 or 100 ng ml−1 PTX. In contrast, 100 μM PPADS did not abolish the ADP-induced cyclic AMP inhibition (Figure 7).
To confirm the identity of P2Y nucleotide receptors in glioma C6 cells, polymerase chain reaction on reverse transcribed total mRNA was employed. Primers were selected to cover unique sequences of rat P2Y1 and P2Y2 receptors. The estimated product size was 590 and 721 bp, respectively. Figure 8 shows that mRNAs of both receptors are expressed in glioma C6 cells. The experiments on five independent cell colonies demonstrated that P2Y1 and P2Y2 mRNA expression levels were not very much different, with P2Y1 mRNA expression slightly, about 1.5 fold, higher than that of P2Y2.
Figure 8.
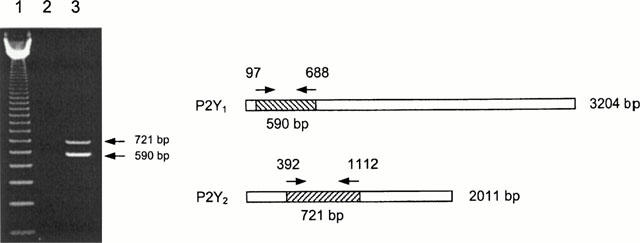
Detection of P2Y1 and P2Y2 mRNA with RT – PCR reaction. A 590 and 721 bp amplification products (corresponding to P2Y1 and P2Y2 mRNAs, respectively) were analysed on 1% agarose gel and visualized by ethidium bromide staining. Lane 1, molecular weight marker 123 bp; Lane 2, control reaction in the absence of cDNA template; Lane 3, PCR products obtained in separate reactions but run together for better visualization.
Discussion
In this study we show that ADP, ATP and UTP initiate a large Ca2+ response consistent with the typical, biphasic capacitative model of Ca2+ entry associated with the stimulation of PLC and depletion of intracellular Ca2+ stores. The similar response was observed with several other metabotropic P2Y nucleotide receptor agonists such as 2MeSATP, 2MeSADP and 2ClATP, while no increase in [Ca2+]i was observed with α,β-methylene ATP, a selective agonist of the inotropic P2X receptors. Adenosine and AMP were ineffective in increasing [Ca2+]i. These and other results of this study, concerning: (i) the apparent rank order of potency for increasing [Ca2+]i, (ii) the effect of antagonists, (iii) the additive actions of ADP and UTP with the lack of additivity of ATP and UTP, (iv) the response of ATP-desensitized cells to ADP but not to UTP, and (v) the RT – PCR reaction, provide a strong support for the presence of two subtypes of the P2Y receptor in glioma C6 cells: the P2Y1 for ADP and the P2Y2 for ATP and UTP.
The presence of the P2Y2 receptor stimulated by both ATP and UTP has been documented in a variety of cells. Among others, it has been found in brain capillary endothelial cells (Albert et al., 1997; Feolde et al., 1995), aortic endothelial cells and in platelets (for review, see Boarder & Hourani, 1998; Boeynaems et al., 2000; Kunapuli, 1998). In glioma C6 cells, ATP has been reported to mediate phosphoinositide turnover and stimulate phosphoinositide hydrolysis (Kitanaka et al., 1992; Lin & Chuang, 1994). We have also demonstrated that in these cells ATP treatment generates InsP3 and simultaneously results in increases [Ca2+]i due to the PLC- mediated release from intracellular stores (Sabała et al., 1997). Thus, our present results confirm previous data indicating that ATP and UTP act on the P2Y2 receptor coupled to PLC and elevated [Ca2+]i.
In contrast to the PLC activation stimulated by ATP and UTP, the receptor that responds to ADP in rat glioma C6 cells had been to date believed not to be coupled to PLC. Such a notion had been supported by the observation that ADP did not cause the detectable increase in InsP3. On the other hand, the cloned rat P2Y1 receptor produced such effect in response to ADP (Boarder & Hourani, 1998; Boyer et al., 1994; 1995; 1996; Pianet et al., 1989; Schachter et al., 1996; 1997).
The present study provide several lines of evidence that the PLC-coupled P2Y1 receptor may exist in glioma C6 cells. First, RT – PCR analysis revealed that the P2Y1 receptor mRNA is localized to these cells. Second, 2MeSATP, 2MeSADP, ADP and 2ClATP, the specific agonists of the P2Y1 receptor were most potent and, PPADS, the selective antagonist of this PLC-coupled-generated InsP3 accumulation receptor completely blocked ADP-evoked [Ca2+]i increases. Third, Ca2+ rises induced by ADP were distinctly diminished by a phorbol ester, TPA. It has been documented that TPA activates PKC that exerts negative feedback regulation on receptor-coupled PLC and, due to that, inhibits phosphatidylinositol 4,5-bisphosphate (PIP2) hydrolysis, InsP3 production and Ca2+ mobilization (Ryu et al., 1990). It has been found that TPA via PKC also inhibits ATP-evoked [Ca2+]i raises (see this study and Chen & Lin, 1999; Czajkowski & Barańska, 1999). Fourth, ADP and other nucleotide analogues initiated biphasic capacitative Ca2+ responses and the presence of external Ca2+ was not necessary to elevate [Ca2+]i. However, in contrast to ATP and UTP, the second phase of this response was transient, quickly reduced to the basal level and 4 – 5 min after addition of agonists no more visible. Thus, one can expect that ADP-evoked InsP3 accumulation is also transient and too short to be estimated. Brain endothelial cells have P2Y1-like receptors which similarly stimulate an increase in [Ca2+]i in the absence of detectable increase in InsP3 levels (Frelin et al., 1993; Albert et al., 1997).
In addition to its effect on the Ca2+ increase, ADP is known to inhibit cyclic AMP accumulation in rat C6 glioma cells and its inhibitory effect is reversed by PTX but insensitive to PPADS (see this study and Boyer et al., 1994; 1995; 1996; Pianet et al., 1989; Schachter et al., 1996; 1997). Schachter et al., (1996; 1997) suggested that the P2Y1 receptor coupled to PLC is distinct from an endogenous P2Y1-like receptor in glioma C6 cells. This interpretation has been questioned by Webb et al. (1996), who purified P2Y receptor cDNA from C6-2B cells, known to possess a P2Y receptor negatively coupled to adenylyl cyclase, and found that sequence analysis of the entire coding region revealed 100% identity to the cloned rat P2Y1 receptor. The authors proposed that the same, single receptor might be coupled to the inhibition of adenylyl cyclase in some cells and to the activation of PLC in others.
Thus, two possible interpretations of the obtained results could be advanced. First that the single P2Y1 receptor is involved in both activities: an inhibition of adenylyl cyclase (PPADS-insensitive) and an activation of PLC (PPADS-sensitive). According to this suggestion, this receptor might be dually coupled to both Gq (PLC) and Gi (adenylyl cyclase) as it has been recently shown for other P2Y receptors (Boeynaems et al., 2000). On the other hand, there is growing evidence that many receptors coupled to Gi (e.g., adenosine A1) can simultaneously modulate adenylyl cyclase and activate PLC via Giα and βγ subunits, respectively (Bugrim, 1999; Clapham & Neer, 1997; Selbie & Hill, 1998). However, although the present study shows that ADP-evoked Ca2+ elevation can be reduced by PTX, this blockade does not prove a direct Gi involvement in this signalling pathway since Gi and Go are usually present at much higher amounts than other G protein and might affect Gq-related signalling. The second possibility is the presence of two ADP receptors in glioma C6 cells: the cloned P2Y1 receptor coupled to PLC and yet-to-be cloned P2Y1-like receptor negatively coupled to adenylyl cyclase. The presence of two ADP receptors, one coupled to PLC via Gq and other, yet uncharacterized, coupled to Gi and associated with adenylyl cyclase, has been postulated in platelets (Boeynaems et al., 2000; Gachet et al., 1997). Further studies should elucidate this problem and answer these still open questions.
In conclusion, our results indicate that both P2Y1 and P2Y2 receptors are expressed and linked to PLC and Ca2+ release in glioma C6 cells. We show that in these cells ADP has two activities: it stimulates PLC and inhibits adenylyl cyclase. The cross-talk between these pathways most probably leads to a multiple network of simultaneous regulation of InsP3 and cyclic AMP mediated signalling.
Acknowledgments
This study was supported by a grant No 4PO5A04408 from the State Committee for Scientific Research (KBN, Poland).
Abbreviations
- [Ca2+]i
intracellular Ca2+ concentration
- 2CIATP
2-chloro-ATP
- EGTA
[ethylene-bis(oxyethylenenitrilo]tetraacetic acid
- Hepes
4-(2-hydroxyethyl)-1-piperazineethanesulphonic acid
- InsP3
inositol 1,4,5-trisphosphate
- MEM
Minimum Essential Medium
- 2MeSADP
2-methylthio-ADP
- 2MeSATP
2-methylthio-ATP
- PBS
phosphate buffered saline
- PIP2
phosphatidylinositol 4,5-bisphosphate
- PKA
protein kinase A
- PKC
protein kinase C
- PLC
phospholipase C
- PPADS
pyridoxal-phosphate-6-azophenyl-2′,4′-disulphonic acid
- PTX
pertussis toxin
- TPA
12-0-tetradecanoylphorbol 13-acetate
References
- ALBERT J.L., BOYLE J.P., ROBERTS J.A., CHALLISS R.A.J., GUBBY S.E., BOARDER M.R. Regulation of brain capillary endothelial cells by P2Y receptors coupled to Ca2+, phospholipase C and mitogen-activated protein kinase. Br. J. Pharmacol. 1997;122:935–941. doi: 10.1038/sj.bjp.0701453. [DOI] [PMC free article] [PubMed] [Google Scholar]
- BARAŃSKA J., CHABAN V., CZARNY M., SABAŁA P. Changes in Ca2+ concentration in phorbol ester and thapsigargin treated cells. The role of protein kinase C in regulation of Ca2+ entry. Cell Calcium. 1995;17:207–215. doi: 10.1016/0143-4160(95)90035-7. [DOI] [PubMed] [Google Scholar]
- BARAŃSKA J., PRZYBYŁEK K., SABAŁA P. Capacitative calcium entry: glioma C6 as a model of nonexcitable cells. Pol. J. Pharmacol. 1999;51:153–162. [PubMed] [Google Scholar]
- BERRIDGE M.J. Capacitative calcium entry. Biochem. J. 1995;312:1–11. doi: 10.1042/bj3120001. [DOI] [PMC free article] [PubMed] [Google Scholar]
- BOARDER M.R., HOURANI S.M.O. The regulation of vascular function by P2 receptors: multiple sites and multiple receptors. Trends Pharmacol. Sci. 1998;19:99–107. doi: 10.1016/s0165-6147(98)01170-5. [DOI] [PubMed] [Google Scholar]
- BOEYNAEMS J.-M., COMMUNI D., SAVI P., HERBERT J.M. P2Y receptor: in the middle of the road. Trends Pharmacol. Sci. 2000;21:1–3. doi: 10.1016/s0165-6147(99)01415-7. [DOI] [PubMed] [Google Scholar]
- BOYER J.L., DOWNES C.P., HARDEN T.K. Kinetics of activation of phospholipase C by P2Y1 purinergic receptor agonists and guanine nucleotides. J. Biol. Chem. 1989;264:884–890. [PubMed] [Google Scholar]
- BOYER J.L., LAZAROWSKI E.R., CHEN X., HARDEN T.K. Identification of phospholipase C by P2Y1 purinergic receptor that inhibits adenylate cyclase. J. Pharmacol. Exp. Ther. 1993;267:1140–1146. [PubMed] [Google Scholar]
- BOYER J.L., O'TUEL J.W., FISCHER B., JACOBSON K.A., HARDEN T.K. Potent agonist action of 2-thioether derivatives of adenine nucleotides at adenylyl cyclase-linked P2Y-purinoceptors. Br. J. Pharmacol. 1995;116:2611–2616. doi: 10.1111/j.1476-5381.1995.tb17215.x. [DOI] [PMC free article] [PubMed] [Google Scholar]
- BOYER J.L., ROMERO T., SCHACHTER J.B., HARDEN T.K. Identification of competitive antagonists of the P2Y1-purinergic receptor. Mol. Pharmacol. 1996;50:1323–1329. [PubMed] [Google Scholar]
- BOYER J.L., ZOHN I.E., JACOBSON K.A., HARDEN T.K. Differential effects of P2-purinoceptor antagonists on phospholipase C- and adenylate cyclase-coupled P2Y-purinoceptors. Br. J. Pharmacol. 1994;113:414–620. doi: 10.1111/j.1476-5381.1994.tb17034.x. [DOI] [PMC free article] [PubMed] [Google Scholar]
- BUGRIM A.E. Regulation of Ca2+ release by cAMP-dependent protein kinase. A mechanism for agonist-specific calcium signaling. Cell Calcium. 1999;25:219–226. doi: 10.1054/ceca.1999.0027. [DOI] [PubMed] [Google Scholar]
- BURNS R.F. Adenosine receptors: role and pharmacology. Ann. N.Y. Acad. Sci. 1990;603:211–226. doi: 10.1111/j.1749-6632.1990.tb37674.x. [DOI] [PubMed] [Google Scholar]
- BURNSTOCK G.A basis for distinguishing two types of purinergic receptors Cell Membrane Receptors for Drugs and Hormones, a Multidisciplinary Approach 1978New York: Raven Press; 107–118.ed. Staub R.W. & Bolis L. pp [Google Scholar]
- BURNSTOCK G. P2 purinoreceptors: historical perspective and classification. Chichester: J. Wiley; Ciba Foundation Symposium. 1996;198:1–28. doi: 10.1002/9780470514900.ch1. [DOI] [PubMed] [Google Scholar]
- CHEN B.C., LIN W.W. PKC betal mediated the inhibition of P2Y receptor-induced inositol phosphate formation in endothelial cells. Br. J. Pharmacol. 1999;127:1908–1914. doi: 10.1038/sj.bjp.0702727. [DOI] [PMC free article] [PubMed] [Google Scholar]
- CLAPHAM D.E., NEER E.J. G protein βγ subunits. Cell. 1997;80:250–268. [Google Scholar]
- CZAJKOWSKI R., BARAŃSKA J. Sphingosine and phorbol ester modulate protein kinase C activity and modify ATP-evoked calcium mobilization in glioma C6 cells. Biochem. Biophys. Res. Commun. 1999;260:614–618. doi: 10.1006/bbrc.1999.0946. [DOI] [PubMed] [Google Scholar]
- DUBYAK G.R., EL-MOATASSIM C. Signal transduction via P2-purinergic receptors for extracellular ATP and other nucleotides. Am. J. Physiol. 1993;265:C577–C606. doi: 10.1152/ajpcell.1993.265.3.C577. [DOI] [PubMed] [Google Scholar]
- FEOLDE E., VIGNE P., BREITTMAYER J.P., FRELIN C. ATP, a partial agonist of a typical P2Y purinoceptors in rat brain microvascular endothelial cells. Br. J. Pharmacol. 1995;115:1199–1203. doi: 10.1111/j.1476-5381.1995.tb15025.x. [DOI] [PMC free article] [PubMed] [Google Scholar]
- FREDHOLM B.B., ABBRACCHIO M.P., BURNSTOCK G., DUBYAK G.R., HARDEN T.K., JACOBSON K.A., SCHWABE U., WILLIAMS M. Towards a revised nomenclature for P1 and P2 receptors. Trends Pharmacol. Sci. 1997;18:79–82. doi: 10.1016/s0165-6147(96)01038-3. [DOI] [PMC free article] [PubMed] [Google Scholar]
- FRELIN C., BREITTMAYER J.P., VIGNE P. ADP induces phosphate-independent intracellular Ca2+ mobilization in brain capillary endothelial cells. J. Biol. Chem. 1993;268:8787–8792. [PubMed] [Google Scholar]
- GACHET C., HECHLER B., LEON C., VIAL C., LERAY C., OHLMANN P., CAZENAVE J.P. Activation of ADP receptors and platelet function. Thromb. Haemost. 1997;78:271–275. [PubMed] [Google Scholar]
- GRYNKIEWICZ G., POENIE M., TSIEN R.Y. A new generation of Ca2+ indicators with greatly improved fluorescence properties. J. Biol. Chem. 1985;260:3440–3450. [PubMed] [Google Scholar]
- KITANAKA J.-I., HASHIMOTO H., GOTOH M., MAYUMI T., BABA A. Mechanism of extracellular ATP-stimulated phosphoinositide hydrolysis in rat glioma C6 cells. J. Pharm. Exp. Ther. 1992;263:1248–1252. [PubMed] [Google Scholar]
- KUNAPULI S.P. Multiple P2 receptor subtypes on platelets: a new interpretation of their function. Trends Pharmacol. Sci. 1998;19:391–394. doi: 10.1016/s0165-6147(98)01248-6. [DOI] [PubMed] [Google Scholar]
- LIN W.-W., CHUANG D.-M. Different signal transduction pathways are coupled to the nucleotide receptor and the P2Y receptor in C6 glioma cells. J. Pharmacol. Exp. Therap. 1994;269:926–931. [PubMed] [Google Scholar]
- LOWRY O.H., ROSEBROUGH N.J., FARR A.J., RANDALL R.J. Protein measurements with the Folin phenol reagent. J. Biol. Chem. 1951;193:265–275. [PubMed] [Google Scholar]
- MARKWELL M.K., HASS S.M., BIEBER L.L., TOLBERT N.E. A modification of the Lowry procedure to simplify protein determination in membrane and lipoprotein samples. Anal. Biochem. 1978;271:478–485. doi: 10.1016/0003-2697(78)90586-9. [DOI] [PubMed] [Google Scholar]
- NICHOLAS R.A., WATT W.C., LAZAROWSKI E.R., LI Q., HARDEN T.K. Uridine nucleotide selectivity of three phospholipase C-activating receptors: identification of a UDP-selective, a UTP-selective, and an ATP-and UTP-specific receptor. Mol. Pharmacol. 1996;50:224–229. [PubMed] [Google Scholar]
- PIANET I., MERLE M., LABOUESSE J. ADP and indirectly, ATP are potent inhibitors of cAMP production in intact isoproterenol-stimulated C6 glioma cells. Biochem. Biophys. Res. Commun. 1989;163:1150–1157. doi: 10.1016/0006-291x(89)92341-3. [DOI] [PubMed] [Google Scholar]
- PUTNEY J.W., Jr, BIRD G.St.J. The inositol phosphate-calcium signaling system in nonexcitable cells. Endocr. Rev. 1993;14:610–631. doi: 10.1210/edrv-14-5-610. [DOI] [PubMed] [Google Scholar]
- RYU S.H., KIM U.H., WAHL M.I., BROWN A.B., CARPENTNER G., HUANG K.P., RHEE S.G. Feedback regulation of phospholipase C-beta by protein kinase C. J. Biol. Chem. 1990;265:17941–17945. [PubMed] [Google Scholar]
- SABAŁA P., AMLER E., BARAŃSKA J. Intracellular Ca2+ signals induced by ATP and thapsigargin in glioma C6 cells. Neurochem. Int. 1997;31:55–64. doi: 10.1016/s0197-0186(96)00135-0. [DOI] [PubMed] [Google Scholar]
- SCHACHTER J.B., BOYER J.L., LI Q., NICHOLAS R.A., HARDEN K. Fidelity in functional coupling of the rat P2Y1 receptor to phospholipase C. Br. J. Pharmacol. 1997;122:1021–1024. doi: 10.1038/sj.bjp.0701479. [DOI] [PMC free article] [PubMed] [Google Scholar]
- SCHACHTER J.B., LI Q., BOYER J.L., NICHOLAS R.A., HARDEN T.K. Second messenger cascade specificity and pharmacological selectivity of the human P2Y1-purinoceptor. Br. J. Pharmacol. 1996;118:167–173. doi: 10.1111/j.1476-5381.1996.tb15381.x. [DOI] [PMC free article] [PubMed] [Google Scholar]
- SELBIE L.A., HILL S.J. G protein-coupled-receptor cross-talk: the fine-tuning of multiple-receptor signalling pathways. Trends Pharmacol. Sci. 1998;19:87–93. doi: 10.1016/s0165-6147(97)01166-8. [DOI] [PubMed] [Google Scholar]
- WEBB T.E., FEOLDE E., VIGNE P., NEARY T., RUNBERG A., FRELIN C., BARNARD E.A. The P2Y purinoceptor in rat brain microvascular endothelial cells couple to inhibition of adenylate cyclase. Br. J. Pharmacol. 1996;119:1385–1392. doi: 10.1111/j.1476-5381.1996.tb16050.x. [DOI] [PMC free article] [PubMed] [Google Scholar]
- WEBB T.E., HENDERSON D.J., ROBERTS J.A., BARNARD E.A. Molecular cloning and characterization of the rat P2Y4 receptor. J. Neurochem. 1998;71:1348–1357. doi: 10.1046/j.1471-4159.1998.71041348.x. [DOI] [PubMed] [Google Scholar]
- WÓJCIK M., DYGAS A., BOBESZKO M., CZAJKOWSKI R., BARAŃSKA J. Effect of ethanol on ATP-induced phospholipase C and D and serine base exchange in glioma C6 cells. Neurochem. Int. 2000;36:127–136. doi: 10.1016/s0197-0186(99)00111-4. [DOI] [PubMed] [Google Scholar]
- ZIGANSHIN A.U., HOYLE C.H.V., BURNSTOCK G. Ecto-enzymes and metabolism of extracellular ATP. Drug Dev. Res. 1994;32:134–146. [Google Scholar]