

Abstract
The release-inhibiting α2-adrenoceptors of cerebral serotoninergic axons were studied in mice. Slices of the hippocampus or the occipito-parietal cortex from NMRI mice, from mice lacking the α2A/D-, the α2B-, the α2C- or both the α2A/D- and the α2C-adrenoceptor, and from mice sharing the genetic background of the receptor-deficient animals (WT) were preincubated with [3H]-serotonin and then superfused and stimulated electrically, in most experiments by trains of 8 pulses at 100 Hz.
The concentration-response curves of the α2-adrenoceptor agonist medetomidine were virtually identical in hippocampal slices from NMRI and WT mice, with maximally 70% inhibition and an EC50 of about 2 nM. In hippocampal slices from NMRI mice, phentolamine and rauwolscine were equipotent antagonists against medetomidine.
The effect of medetomidine was greatly reduced, with maximally 20% inhibition, in hippocampal slices from α2A/D-adrenoceptor-deficient mice; was slightly reduced, with maximally 59% inhibition, in hippocampal slices from α2C-adrenoceptor-deficient mice; was not changed in hippocampal slices from α2B-adrenoceptor-deficient mice; and was abolished in hippocampal slices from mice lacking both the α2A/D- and the α2C-adrenoceptor.
Similar results were obtained in: (i) occipito-parietal slices from NMRI and α2A/D-adrenoceptor-deficient mice and (ii) hippocampal slices that were preincubated with [3H]-serotonin in the presence of oxaprotiline to rule out cross-labelling of noradrenergic axons.
The serotoninergic axons of the mouse brain possess both α2A/D-heteroreceptors, which predominate, and α2C-heteroreceptors but lack α2B-adrenoceptors. The situation resembles the coexistence of α2A/D- and α2C-autoreceptors but lack of α2B-autoreceptors at the noradrenergic axons of mice.
Keywords: α2-Adrenoceptor, α2A-adrenoceptor, α2B-adrenoceptor, α2C-adrenoceptor, presynaptic heteroreceptor, serotonin release, medetomidine, phentolamine, rauwolscine, transgenic mice
Introduction
The release of serotonin in the brain is reduced when α2-adrenoceptors are activated, which are presumably located on the serotoninergic terminal axons (Starke & Montel, 1973; Frankhuyzen & Mulder, 1980; Göthert & Huth, 1980; Göthert et al., 1981). These presynaptic α2-adrenoceptors, often called α2-heteroreceptors to distinguish them from the α2-autoreceptors of noradrenergic neurones, have been found in several brain areas and several species including man (reviewed by Mongeau et al., 1997; humans: Raiteri et al., 1990; Feuerstein et al., 1993).
When the three genetically distinct α2-adrenoceptor subtypes α2A/D, α2B and α2C became known, the question arose to which subtype the α2-heteroreceptors at the serotoninergic axons belonged; the α2A/D-adrenoceptors are orthologous receptors, the pharmacological properties of which differ between species, the pharmacological α2A version occurring for example in humans and rabbits and the α2D version in rats and mice (see Bylund et al., 1994). Experiments using series of antagonists initially showed that the receptors were not α2B (Gobbi et al., 1990; Maura et al., 1992), and later that they were at least predominantly α2A in the rabbit and α2D in the rat (Trendelenburg et al., 1994). They thus obeyed the rule that all mammalian presynaptic α2-adrenoceptors, autoreceptors as well as heteroreceptors, belonged predominantly to the α2A/D group of orthologous receptors (see Starke et al., 1995).
Recently, α2A/D-, α2B- and α2C-adrenoceptor-deficient mice were generated by disruption of the respective genes. Experiments with these mice confirmed that the presynaptic α2-autoreceptors of noradrenergic neurones were mainly α2A/D, but showed that non-α2A/D-autoreceptors existed as well (Altman et al., 1999; Trendelenburg et al., 1999). In a further step, α2A/D-adrenoceptor- and α2C-adrenoceptor-deficient mice were crossed to produce animals lacking both subtypes. Studies on these animals demonstrated that the non-α2A/D-autoreceptors were α2C (Hein et al., 1999).
We have now used α2A/D-adrenoceptor-deficient mice (α2AKO), α2B-deficient mice (α2BKO), α2C-deficient mice (α2CKO) and the both α2A/D- and α2C-adrenoceptor-deficient animals of Hein et al. (1999) (α2ACKO) to re-examine the α2-heteroreceptors at the serotoninergic axons of the brain. Slices of the hippocampus or the occipito-parietal cortex were preincubated with [3H]-serotonin, and release of [3H]-serotonin was then elicited by electrical stimulation. Medetomidine was used as a selective α2-adrenoceptor agonist.
Methods
Animals, tissues and superfusion
Male Naval Medical Research Institute (NMRI) mice, male α2AKO, α2BKO and α2CKO mice (Altman et al., 1999), male or female α2ACKO mice (Hein et al., 1999), and male mice of the wildtype strain from which the KO animals were generated (C57BL/6×129Sv; WT) were killed at the age of at least 2 months. Six to seven round slices of the occipito-parietal cortex (Limberger et al., 1995b) and 20 – 30 frontal slices, 0.3 mm thick, of the hippocampus were obtained from each animal. The occipito-parietal and hippocampal slices were preincubated for 45 min at 37°C in 4-ml volumes of medium containing 0.1 μM [3H]-serotonin. They were then washed with five 3-ml volumes of [3H]-serotonin-free medium and transferred to 12 superfusion chambers equipped with platinum electrodes, one slice (occipito-parietal cortex) or 2 – 3 slices (hippocampus) per chamber, where they were superfused with [3H]-serotonin-free medium at a rate of 1.2 ml min−1. Successive 2-min superfusate samples were collected from t=50 min onwards (t=0 being the start of superfusion). At the end of experiments tissues were dissolved and tritium was determined in superfusate samples and slices.
The superfusion medium contained (mM): NaCl 118, KCl 4.8, CaCl2 1.3, MgSO4 1.2, NaHCO3 25, KH2PO4 1.2, glucose 11, ascorbic acid 0.57, disodium EDTA 0.03 and nitroquipazine 0.001. Unless stated otherwise, the preincubation medium was the same but nitroquipazine-free.
Stimulation and drug application
Seven periods of electrical stimulation were applied. Each consisted of rectangular pulses of 1 ms width and a current strength of 60 mA, which yielded a voltage of 20 – 30 V between the electrodes of each chamber. The first stimulation (18 pulses at 3 Hz) was delivered at t=30 min and was not used for the determination of tritium overflow. The subsequent six stimulation periods differed, depending on the type of experiment.
In the first type of experiment (hippocampus only), various pulse patterns were applied as follows: a single pulse at t=54 and 126 min (S1 and S4); eight pulses at 100 Hz at t=72 and 144 min (S2 and S5); and 360 pulses at 3 Hz at t=90 and 162 min (S3 and S6). Drug effects were determined by addition of the drug at t=96 min, i.e. 30 min before S4, at a fixed concentration.
In the second type of experiment (hippocampus and occipito-parietal cortex), which was used predominantly, each stimulation period consisted of a train of 8 pulses/100 Hz. Stimulation periods were applied at t=54 (S1), 72 (S2), 90 (S3), 108 (S4), 126 (S5) and 144 min (S6). Concentration-response curves for medetomidine were determined by addition of the agonist at increasing concentrations 12 min before S2, S3, S4, S5 and S6. Phentolamine and rauwolscine, when tested as antagonists against medetomidine, were present throughout superfusion.
Evaluation
The outflow of tritium was calculated as a fraction of the tritium content of the tissue at the onset of the respective collection period (fractional rate; min−1). The overflow elicited by electrical stimulation was calculated as the difference ‘total tritium outflow during the 4 min (one pulse, eight pulses at 100 Hz) or 34 min (360 pulses at 3 Hz) after onset of electrical stimulation' minus ‘basal outflow'; basal tritium outflow was assumed to decline linearly from the 2-min period before to the 2-min period after these stimulation peaks. The evoked overflow was then expressed as a percentage of the tritium content of the tissue at the onset of stimulation. For further evaluation, overflow ratios were calculated: S4/S1, S5/S2 and S6/S3 (pairs with identical stimulation conditions) for the first type of experiment and S2/S1, S3/S1, S4/S1, S5/S1 and S6/S1 for the second. Overflow ratios were also calculated as a percentage of the average corresponding ratio from controls in which no drug was applied after S1. The basal efflux of tritium was evaluated similarly, with calculation of ratios of fractional outflow rates such as b2/b1 (b2 being efflux immediately before S2 and b1 efflux immediately before S1).
Where possible, concentration-response curves of medetomidine, were evaluated by logistic curve fitting (equation no. 25 of Waud, 1976), using either the data for ‘medetomodine given alone' or, in a simultaneous fit, the data for ‘medetomidine given alone' and ‘medetomidine in the presence of phentolamine or rauwolscine', essentially as described previously (Trendelenburg et al., 1997). The calculation yielded the maximal effect (Emax) and EC50 of medetomidine given alone as well as its EC50 in the presence of an antagonist. Apparent antagonist pKd values were calculated from the antagonist-induced EC50 increase. The pKd values are apparent because the competitive character of the interaction was not verified.
Results are expressed as arithmetic means±s.e.mean except in the case of Emax and EC50 (means±s.e. as defined by Waud, 1976). Groups were compared by the Mann-Whitney test with Bonferroni correction if Kruskal-Wallis analysis indicated a significant difference. P<0.05 was taken as the limit of statistical difference. n Represents the number of superfusion chambers. n Superfusion chambers contained slices from approximately n/6 to n animals.
Materials
5-[1,2-3H(N)]-Hydroxytryptamine creatinine sulphate, specific activity 21.4 – 24.0 Ci mmol−1 (NEN, Köln, Germany); tetrodotoxin citrate (Biotrend, Köln, Germany); (+)-oxaprotiline HCl, phentolamine HCl (Ciba-Geigy, Basel, Switzerland); (2S, 12bS) 1′,3′-dimethylspiro (1, 3, 4, 5′, 6, 6′, 7, 12b-octahydro-2H-benzo[b]furo[2,3-a]quinolizine)-2,4′- pyrimidin-2′-one HCl (MK 912; MSD Sharp & Dohme, München, Germany); medetomidine HCl (Orion, Espoo, Finnland); (±)-idazoxan HCl (Reckitt & Colman, Kingston-upon-Hull, U.K.); methiothepin mesylate, 6-nitroquipazine maleate, rauwolscine HCl (Sigma, Deisenhofen, Germany). Drugs were dissolved in distilled water except MK 912 (10 mM HCl).
Results
Evoked tritium overflow: stimulation conditions
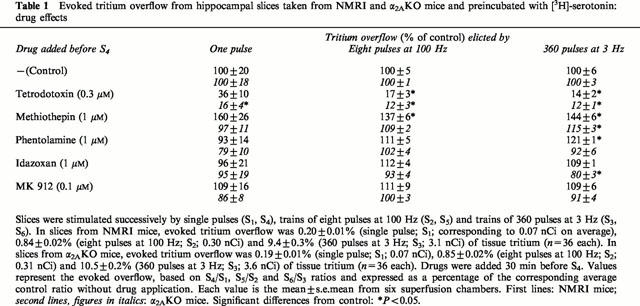
In an initial series of experiments, hippocampal slices preincubated with [3H]-serotonin were exposed to various electrical pulse patterns in order to find suitable stimulation conditions. Single pulses elicited only very small increases in tritium outflow, averaging 0.20% of tissue tritium for NMRI and 0.19% of tissue tritium for α2AKO mice (see legend to Table 1). Trains of eight pulses at 100 Hz, in contrast, produced acceptable outflow peaks, 0.84 and 0.85% of tissue tritium on average for NMRI and α2AKO mice, respectively, and for trains of 360 pulses at 3 Hz the evoked overflow was even larger (see legend to Table 1). The evoked overflow, in particular that evoked by eight pulses at 100 Hz or 360 pulses at 3 Hz, was greatly reduced by tetrodotoxin (0.3 μM; Table 1) and at most slightly increased by the serotonin receptor antagonist methiothepin (1 μM; Table 1), indicating only a minor degree of 5-HT-receptor-mediated autoinhibition. Pulse trains consisting of eight pulses at 100 Hz were chosen for most of the following experiments.
Table 1.
Evoked tritium overflow from hippocampal slices taken from NMRI and α2AKO mice and preincubated with [3H]-serotonin: drug effects
Evoked tritium overflow: NMRI versus WT hippocampus
Repeated stimulation by eight pulses at 100 Hz, without drug administration after S1, produced tritium overflow from hippocampal slices that was very similar from S1 – S6, irrespective of the mouse strain and irrespective of the absence or presence of antagonists (filled circles in Figure 1). In one series of experiments, the effect of medetomidine in hippocampal slices from NMRI mice was compared with its effect in hippocampal slices taken from the strain from which the knockout animals were generated (WT); experiments on NMRI and WT animals were carried out strictly in parallel. The overflow of tritium evoked by eight pulses at 100 Hz at S1, before addition of medetomidine, was identical in the two groups (Table 2; compare NMRI 1 and WT). Medetomidine caused concentration-dependent inhibition, and its effects in the two groups were indistinguishable, whether viewed in efflux-versus-time curves (Figure 1, upper two panels) or concentration-response curves (NMRI and WT curves were superimposed; not shown). The EC50 of medetomidine in NMRI hippocampal slices was 1.77±0.05 nM and its Emax 69.1±0.3% inhibition; the EC50 in WT hippocampal slices was 1.64±0.04 nM and the Emax 70.4±0.3% inhibition. NMRI mice were used for comparison with the transgenic animals in all subsequent experiments.
Figure 1.
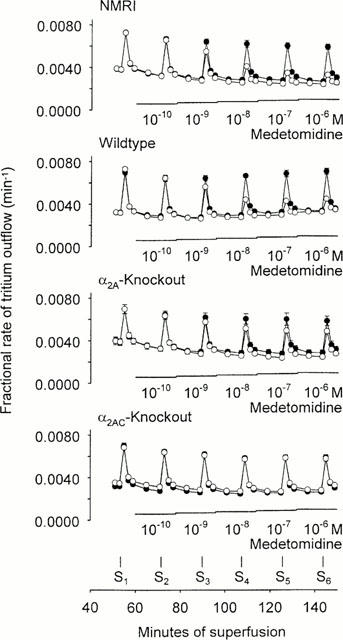
Tritium efflux from hippocampal slices preincubated with [3H]-serotonin and effect of medetomidine. Slices were from NMRI mice, from the strain from which the knockout animals had been generated (wildtype), from α2A-knockout mice or from α2AC-knockout mice. After preincubation, slices were superfused and stimulated six times by eight pulses at 100 Hz (S1 – S6). Filled circles represent slices that were superfused with medetomidine-free medium throughout. Empty circles represent experiments in which medetomidine (0.1 nM – 1 μM) was added as indicated. Each value is the mean±s.e.mean from 5 – 10 superfusion chambers.
Table 2.
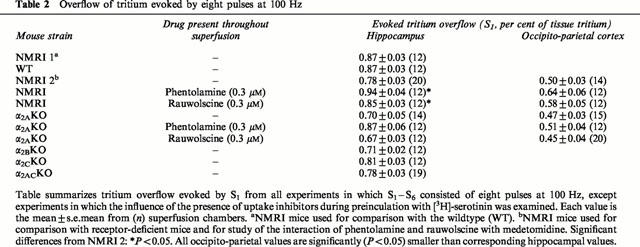
Overflow of tritium evoked by eight pulses at 100 Hz
Evoked tritium overflow: NMRI versus α2AKO, α2BKO, α2CKO and α2ACKO hippocampus
Results obtained in the NMRI mice of this series agreed well with the preceding series, although the overflow evoked by S1 was slightly lower (Table 2; compare NMRI 2, no drug, with NMRI 1). The EC50 of medetomidine was 1.78±0.15 nM and its Emax 70.5±0.9% inhibition (from concentration-response curve in Figure 2).
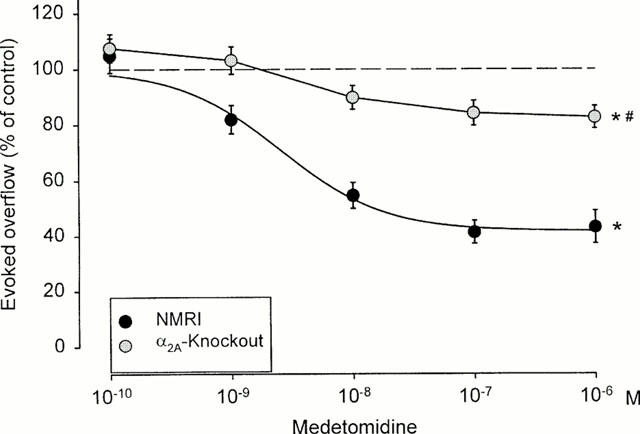
Figure 2.
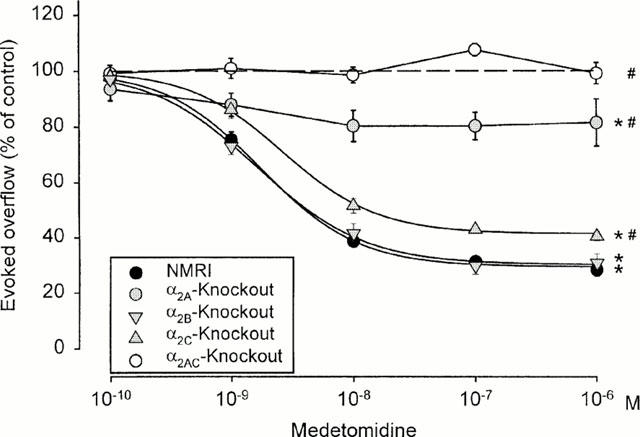
Effect of medetomidine on electrically evoked tritium overflow from hippocampal slices taken from NMRI, α2A-knockout, α2B-knockout, α2C-knockout and α2AC-knockout mice. S1 – S6 consisted of eight pulses at 100 Hz. Medetomidine was added at increasing concentrations before S2 – S6. Ordinates, evoked tritium overflow, calculated from Sn/S1 ratios and expressed as a percentage of the corresponding average control ratio (no medetomidine). Each value is the mean±s.e.mean from 7 – 11 superfusion chambers. *Indicates significant (P<0.05) inhibition in the respective group by 1 nM – 1 μM medetomidine (NMRI, α2BKO, α2CKO) or 10 and 100 nM medetomidine (α2AKO). # Indicates significantly (P<0.05) less inhibition, by 1 nM – 1 μM medetomidine, in the respective group than in NMRI mice.
Disruption of the any of the α2-adrenoceptor genes did not affect the overflow response to S1 (Table 2; compare α2AKO, α2BKO and α2CKO, no drug, with NMRI 2, no drug). In hippocampal slices from α2BKO animals, the effect of medetomidine likewise was as in NMRI slices; the EC50 was 1.67±0.17 nM and the Emax 69.8±1.2% inhibition (Figure 2). In slices from α2AKO and α2CKO animals, however, the effect of medetomidine was reduced. The reduction was slight in α2CKO slices, in which the EC50 was 2.70±0.33 nM and the Emax 58.7±0.7% inhibition (Figure 3). The reduction was marked in slices from α2AKO animals: the concentration-response curve, although apparently not shifted to the right or left, was so flat that fitting of a sigmoid was not possible (Figures 1 and 2). Nevertheless, two concentrations of medetomidine still caused significant inhibition in the α2AKO preparations (Figure 2). The greatest inhibition, at a concentration of 0.01 μM, was by 19.8%.
Figure 3.
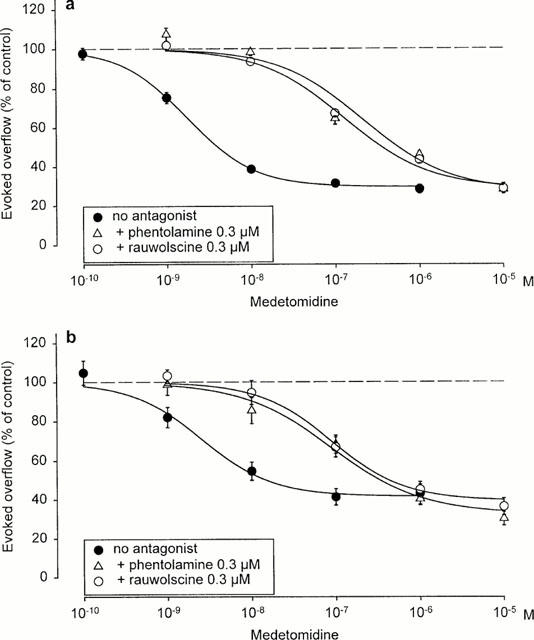
Interaction of medetomidine with phentolamine and rauwolscine on electrically evoked tritium overflow from hippocampal (a) or occipito-parietal cortex slices (b) taken from NMRI mice. S1 – S6 consisted of eight pulses at 100 Hz. Medetomidine was added at increasing concentrations before S2 – S6. Phentolamine and rauwolscine were present throughout superfusion. Ordinates, evoked tritium overflow, calculated from Sn/S1 ratios and expressed as a percentage of the corresponding average control ratio (no medetomidine). The ‘no antagonist' curves are (a) from Figure 2 and (b) from Figure 4, respectively. Each value is the mean±s.e.mean from 3 – 11 superfusion chambers.
In hippocampal slices from animals in which both the α2A gene and the α2C gene had been disrupted, the overflow of tritium evoked by S1 again did not differ from NMRI values (Table 2; compare α2ACKO with NMRI 2, no drug). In these tissues, any inhibitory effect of medetomidine was abolished (Figures 1 and 2).
Effects of phentolamine (0.3 μM) and rauwolscine (0.3 μM) against medetomidine were studied in hippocampal slices from NMRI and α2AKO mice. Phentolamine and rauwolscine shifted the concentration-response curve of medetomidine in slices from NMRI mice to the right with similar potency, the pKd values being 8.6 and 8.4, respectively (Figure 3a). The flat concentration-response curve of medetomidine in α2AKO slices did not permit quantification of antagonist effects. However, phentolamine and rauwolscine obviously antagonized the small effect of medetomidine that remained in the α2AKO preparations (n=3 – 11; data not shown). Phentolamine and rauwolscine, when present throughout superfusion of NMRI hippocampal slices, significantly increased the overflow of tritium elicited by S1 (Table 2).
Evoked tritium overflow: NMRI versus α2AKO occipito-parietal cortex
As in the hippocampus, S1 – S6, all eight pulses per 100 Hz, produced overflow peaks of similar magnitude when no drug was added after S1, irrespective of the mouse strain and irrespective of the absence or presence of antagonists (data not shown). In all groups, the overflow of tritium evoked by S1, before addition of medetomidine, was lower than in hippocampal slices (Table 2). Medetomidine reduced the evoked overflow of tritium from NMRI occipito-parietal cortex with an EC50 of 2.57±0.91 nM and an Emax of 58.4±3.6% inhibition (Figure 4), similar to NMRI hippocampus.
Figure 4.
Effect of medetomidine on electrically evoked tritium overflow from occipito-parietal cortex slices taken from NMRI and α2A-knockout mice. S1 – S6 consisted of eight pulses at 100 Hz. Medetomidine was added at increasing concentrations before S2 – S6. Ordinates, evoked tritium overflow, calculated from Sn/S1 ratios and expressed as a percentage of the corresponding average control ratio (no medetomidine). Each value is the mean±s.e.mean from 5 – 8 superfusion chambers. *Indicates significant (P<0.05) inhibition in the respective group by 1 nM – 1 μM medetomidine (NMRI) or 1 μM medetomidine (α2AKO). # Indicates significantly (P<0.05) less inhibition, by 1 nM – 1 μM medetomidine, in α2AKO than in NMRI mice.
Disruption of the α2A gene did not change the overflow evoked by S1 (Table 2; compare α2AKO, no drug, with NMRI 2, no drug). As in the hippocampus, however, the effect of medetomidine was greatly changed: no obvious shift of the concentration-response curve to the right or left but marked flattening, so that a sigmoid could not be fitted to the data. One concentration, 1 μM, still caused significant inhibition by 17.4% (Figure 4).
As in NMRI hippocampal slices, phentolamine (0.3 μM) and rauwolscine (0.3 μM) shifted the concentration-response curve of medetomidine in NMRI occipito-parietal cortex slices to the right to a similar extent, the apparent pKd values being 7.8 for phentolamine and 8.0 for rauwolscine (Figure 3b). Phentolamine (0.3 μM) and rauwolscine (0.3 μM) also antagonized the small effect of medetomidine that remained in the α2AKO preparations. However, the flatness of the agonist concentration-response curves prevented quantification (n=3 – 8; data not shown). The antagonists, when present throughout superfusion, did not change the overflow of tritium elicited by S1 (Table 2).
Evoked tritium overflow: effect of α-adrenoceptor antagonists given alone
In NMRI hippocampal slices, phentolamine and rauwolscine, when present throughout superfusion, had increased the overflow of tritium elicited by S1, as mentioned above (Table 2). Drug effects on the evoked overflow can be better assessed when the drugs are administered after Sn, so that Sn is the internal control for each single preparation. For this reason, phentolamine (1 μM) and the α2-selective antagonists idazoxan (1 μM) and MK 912 (0.1 μM) were given after S3 in experiments on NMRI and α2AKO hippocampal slices in which single pulses, eight pulses per 100 Hz and 360 pulses per 3 Hz were applied successively. None of the three drugs changed the overflow elicited by single pulses or eight pulses per 100 Hz. Phentolamine increased the response to 360 pulses per 3 Hz in NMRI hippocampus and idazoxan reduced the response to 360 pulses per 3 Hz in α2AKO hippocampus. Both changes were small (Table 1).
Preincubation with [3H]-serotonin in the presence of uptake inhibitors
A final series of experiments was performed in order to avoid erroneous conclusions due to uptake of [3H]-serotonin into noradrenergic axon terminals during preincubation. For this purpose, hippocampal slices from NMRI or α2AKO mice were preincubated with [3H]-serotonin in the presence of the selective inhibitor of the high affinity noradrenaline transporter, oxaprotiline (to prevent uptake into noradrenergic axons), or the selective inhibitor of the high affinity serotonin transporter, nitroquipazine (to prevent entry into serotoninergic axons). Experiments without uptake inhibitors were carried out in parallel.
NMRI and α2AKO hippocampal preparations that had been preincubated with [3H]-serotonin in inhibitor-free medium contained 66.0±5.6 and 51.4±3.0 nCi of tritiated compounds at the beginning of sample collection, i.e. at t=50 min of superfusion, respectively (n=8 each, P>0.05). Presence of 10 μM oxaprotiline during preincubation with [3H]-serotonin did not significantly reduce these values (NMRI −22.2% and α2AKO −7.8% on average, n=8 each, P>0.05). Presence of 10 μM nitroquipazine during preincubation with [3H]-serotonin, however, caused a significant decrease (NMRI −65.3% and α2AKO −62.3% on average, n=8 each, P<0.05). Tritium overflow elicited by eight pulses per 100 Hz from slices that had been preincubated with [3H]-serotonin in inhibitor-free medium was similar to the preceding series of experiments (see Table 2). Tritium overflow from slices that had been preincubated with [3H]-serotonin in the presence of oxaprotiline or nitroquipazine was slightly but significantly lower (P<0.05; data not shown).
Concentration-response curves of medetomidine in NMRI hippocampal slices are shown in Figure 5a. Experiments on slices preincubated with [3H]-serotonin in inhibitor-free medium yielded results almost identical with those shown in Figure 2; the EC50 of medetomidine was 2.25±0.45 nM and its Emax 65.9±2.0% inhibition (filled circles in Figure 6a). When oxaprotiline had been present during preincubation with [3H] serotonin, the concentration-response curve of medetomidine remained unchanged (Figure 5a). When nitroquipazine had been present during preincubation, the curve was shifted slightly to the left and downward, with an EC50 of 0.52±0.13 nM and an Emax of 79.5±1.5% inhibition (Figure 6a).
Figure 5.
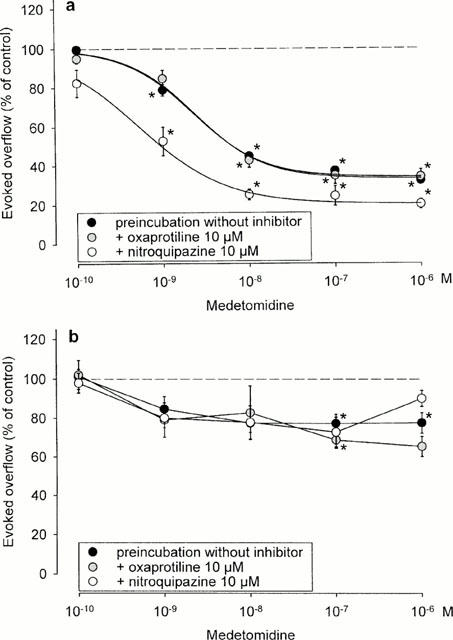
Effect of medetomidine on electrically evoked tritium overflow from hippocampal slices taken from NMRI (a) or α2AKO (b) mice: tritium labelling in the presence of oxaprotiline and nitroquipazine. Slices were first incubated for 30 min with 10 μM oxaprotiline or nitroquipazine and then, in the continued presence of oxaprotiline or nitroquipazine, with [3H]-serotonin. Subsequently they were superfused with the usual medium containing nitroquipazine (1 μM). Otherwise identical experiments on slices preincubated with [3H]-serotonin in the absence of oxaprotiline and nitroquipazine were carried out in parallel. S1 – S6 consisted of eight pulses at 100 Hz. Medetomidine was added at increasing concentrations before S2 – S6. Ordinates, evoked tritium overflow, calculated from Sn/S1 ratios and expressed as a percentage of the corresponding average control ratio (no medetomidine). Each value is the mean±s.e.mean from four superfusion chambers. *Indicates significant (P<0.05) inhibition by medetonidine.
Concentration-response curves of medetomidine in α2AKO hippocampal slices are shown in Figure 5b. Experiments on slices preincubated with [3H]-serotonin in inhibitor-free medium gave results virtually identical with the series shown in Figure 2: a flat concentration-response curve of medetomidine, but significant (P<0.05) inhibition by 0.1 (22.7% inhibition, the largest effect) and 1 μM medetomidine (filled circles in Figure 5b). Presence of oxaprotiline or nitroquipazine during labelling did not change the concentration-response curve of medetomidine (Figure 5b).
Basal tritium outflow
The basal efflux of tritium from hippocampal slices before S1 (b1) was similar in the various animal strains (see Figure 1). The same was true for occipito-parietal cortex slices. Two drugs tended to cause changes. Tetrodotoxin (0.3 μM) tended to reduce basal tritium outflow from NMRI and α2AKO hippocampal slices (experiments of Table 1). Medetomidine (0.1 nM – 1 μM) also tended to reduce basal efflux, except in slices from α2ACKO mice; the effect seemed to be attenuated by α-adrenoceptor antagonists. However, only some of these tendencies reached statistical significance.
Discussion
Action potential-evoked release of [3H]-serotonin from mouse brain preparations has rarely been studied (e.g. Figueroa et al., 1985; Nakazi et al., 2000). Therefore, in initial experiments we established parameters of electrical stimulation which (i) gave well measurable tritium overflow peaks and (ii) triggered release that was largely sensitive to tetrodotoxin and (iii) not subject to major 5-HT-receptor-mediated autoinhibition: the latter because ongoing presynaptic autoinhibition might minimize any α2-adrenoceptor-mediated inhibition due to the well-known interaction between presynaptic inhibitory receptors (see p. 164 of Mongeau et al., 1997; Schlicker & Göthert, 1998). Trains of eight pulses at 100 Hz fulfilled these three conditions (Figure 1, Table 1). The only minor effect of methiothepin on release of [3H]-serotonin elicited by one pulse or eight pulses at 100 Hz was expected (Fischer et al., 1990). Upon stimulation with longer pulse trains, autoinhibition and, hence the effect of methiothepin usually is greater (Fischer et al., 1990), but small increases similar to the present ones have also been reported (a 31% increase for 360 pulses at 3 Hz in rat brain cortex: Göthert, 1980).
α2-Adrenergic inhibition of serotonin release in the brain of mice does not seem to have been reported previously. Our results show that it occurs both in the hippocampus and the occipito-parietal cortex: the α2-adrenoceptor agonist medetomidine inhibited the release of [3H]-serotonin, and its effect was antagonized by phentolamine and rauwolscine in a manner compatible with competitive kinetics. Mice strains may differ in serotoninergic neurone function (Daszuta et al., 1984). We made sure that both the magnitude of electrically evoked release and the inhibition by medetomidine were virtually identical in NMRI mice and the WT strain that shared the genetic background of the transgenic animals (Table 2, Figure 1). NMRI mice therefore could be used for comparison with the latter.
Our experiments show that serotoninergic axons innervating the mouse hippocampus (i) possess prominent α2A/D-heteroreceptors – or more specifically α2D-heteroreceptors if the rodent orthologue of this receptor is called by its traditional designation; (ii) possess less prominent α2C-heteroreceptors; and (iii) lack α2B-heteroreceptors. The evidence is as follows. First, in the hippocampus of NMRI mice, phentolamine and rauwolscine were approximately equipotent antagonists against medetomidine (Figure 3a); a potency ratio phentolamine ⩾ rauwolscine is unique to the α2D-adrenoceptor (see Simonneaux et al., 1991; Limberger et al., 1995a), and the equipotency hence indicates a major population of α2D-heteroreceptors. Second, disruption of the α2A/D-adrenoceptor gene to generate α2AKO mice reduced the maximal inhibitory effect of medetomidine by about 70% (Figure 2), in accord with an α2D predominance but disclosing an additional non-α2A/D pathway. Third, disruption of the α2C-adrenoceptor gene to produce α2CKO mice also reduced the maximal inhibitory effect of medetomidine, although only by 17%, whereas disruption of the α2B gene to produce α2BKO mice did not change the medetomidine concentration-response curve (Figure 2); the 2 fold observation indicates that the non-α2A/D pathway is an α2C pathway. Fourth and finally, the small inhibition by medetomidine that remained in α2AKO hippocampal slices was lost in α2ACKO slices, i.e. when both the α2A/D- and the α2C-adrenoceptor had been deleted (Figure 2), thus confirming the α2C and ruling out an α2B component.
The results in the occipito-parietal cortex are similar but less complete: the approximate antagonist equipotency of phentolamine and rauwolscine in NMRI occipito-parietal cortex slices (Figure 3b) and the 70% loss of inhibitory efficacy of medetomidine in α2AKO slices (Figure 4) indicate prevailing α2D-heteroreceptors and an additional non-α2A/D mechanism. The latter, however, was not studied further.
The existence of prominent α2A/D-heteroreceptors is in accord with previous work on rats and rabbits (Trendelenburg et al., 1994). The coexistence of α2C- (but not α2B-) heteroreceptors with α2A/D-heteroreceptors at the serotoninergic axons is reminiscent of the coexistence of α2C- (but not α2B-) autoreceptors with α2A/D-autoreceptors at the noradrenergic axons of mice (Altman et al., 1999; Hein et al., 1999; Trendelenburg et al., 1999): the hetero- and autoreceptors constitute the same, dual, types (cf. Trendelenburg et al., 1994).
Previous work has shown that the α2-heteroreceptors at cerebral serotoninergic axons are not activated by endogenous noradrenaline to any major extent under in vitro conditions such as the present ones (see p. 163 of Mongeau et al., 1997). We have seen here the same. Phentolamine and rauwolscine enhanced the release of [3H]-serotonin elicited by eight pulses at 100 Hz (S1) in NMRI hippocampus when they were present throughout superfusion (Table 2), and phentolamine also enhanced the release elicited by 360 pulses at 3 Hz (S6) in NMRI hippocampus when it was added after S3 (Table 1). The increases were small, however, and idazoxan and MK 912 failed to cause any increase (Table 1). Still, it seems of interest that no increase occurred in α2AKO hippocampus (Tables 1 and 2), indicating perhaps that the α2D-heteroreceptor rather than the α2C-heteroreceptor was involved. In vivo, a functionally important α2-adrenergic inhibition of [3H]-serotonin release by endogenous noradrenaline is likely (see Mongeau et al., 1997).
[3H]-Serotonin may be taken up into, and subsequently released from, noradrenergic terminal axons. An α2-autoreceptor-mediated modulation of [3H]-serotonin release from noradrenergic axons may then simulate an α2-heteroreceptor-mediated modulation of [3H]-serotonin release from serotoninergic axons. Several considerations indicate, however, that cross-labelling of noradrenergic axons played a minimal role in our study. First, the affinity of serotonin for the noradrenaline transporter is much lower (Ki>10 μM) than its affinity for the serotonin transporter (Km 0.5 μM; Hoffman et al., 1991; Pacholczyk et al., 1991). Second, α2-adrenoceptor antagonists increased the release of [3H]-serotonin elicited by 360 pulses at 3 Hz by maximally 21% (Table 1). They increase the release of noradrenaline from mouse brain noradrenergic axons elicited by pulse trains of this kind, which lead to major α2-autoinhibition, by more than 300% (Trendelenburg et al., 1999). Third, only nitroquipazine but not oxaprotiline, when present during preincubation with [3H]-serotonin, significantly reduced the uptake and subsequent retention of [3H]-serotonin. About one-third of the accumulation and retention was resistant to nitroquipazine. The same has been observed in rabbit brain cortex where the resistant fraction was not due to uptake into noradrenergic axons (Limberger et al., 1986). Fourth, the concentration-response curves of medetomidine in NMRI as well as α2AKO hippocampal slices were unchanged when uptake of [3H]-serotonin into noradrenergic axons had been prevented by oxaprotiline (Figure 5).
Some uptake of [3H]-serotonin into, and subsequent release from, noradrenergic axons did occur, however, at least in slices labelled in the presence of nitroquipazine: these slices responded to electrical stimulation with medetomidine-sensitive tritium overflow (Figure 5). In NMRI hippocampus, medetomidine acted on the noradrenergic axons (preincubation with nitroquipazine) even with lower EC50 and higher Emax than on the serotoninergic axons (preincubation with oxaprotiline) (Figure 5a). This may reflect the high potency and large maximal effect of medetomidine at the noradrenergic axons of the mouse brain (in single pulse experiments: EC50 about 0.25 nM and maximal inhibition by about 98%; Trendelenburg et al., 1999).
In conclusion, the serotoninergic axons innervating the hippocampus and the occipito-parietal cortex of mice possess release-inhibiting α2-heteroreceptors. Characterization by phentolamine and rauwolscine suggests that these receptors are predominantly α2D. Experiments on animals lacking α2A/D-, α2B-, α2C- or both α2A/D- and α2C-adrenoceptors confirm this predominance but show that the axons possess in addition a minor population of α2C-heteroreceptors. The coexistence of α2A/D- and α2C-heteroreceptors at the serotoninergic axons agrees with the coexistence of α2A/D- and α2C-autoreceptors at the noradrenergic axons of the mouse brain.
Acknowledgments
The study was supported by the Deutsche Forschungsgemeinschaft (SFB 505). We thank Ciba-Geigy, MSD Sharp & Dohme, Orion and Reckitt & Colman for generous supply of drugs.
Abbreviations
- KO
knockout
- MK 912
(2S, 12bS) 1′,3′-dimethylspiro (1, 3, 4, 5′, 6, 6′, 7, 12b-octahydro-2H-benzo[b]furo [2, 3-a] quinolizine)-2,4′-pyrimidin-2′-one HCl
- WT
wildtype
References
- ALTMAN J.D., TRENDELENBURG A.U., MACMILLAN L., BERNSTEIN D., LIMBIRD L., STARKE K., KOBILKA B.K., HEIN L. Abnormal regulation of the sympathetic nervous system in α2A-adrenergic receptor knockout mice. Mol. Pharmacol. 1999;56:154–161. doi: 10.1124/mol.56.1.154. [DOI] [PubMed] [Google Scholar]
- BYLUND D.B., EIKENBERG D.C., HIEBLE J.P., LANGER S.Z., LEFKOWITZ R.J., MINNEMAN K.P., MOLINOFF P.B., RUFFOLO R.R., TRENDELENBURG U. International Union of Pharmacology nomenclature of adrenoceptors. Pharmacol. Rev. 1994;46:121–136. [PubMed] [Google Scholar]
- DASZUTA A., HERY F., FAUDON M. In vitro [3H]-serotonin (5-HT) synthesis and release in BALBc and C57BL mice. I. Terminal areas. Brain Res. Bull. 1984;12:559–563. doi: 10.1016/0361-9230(84)90172-2. [DOI] [PubMed] [Google Scholar]
- FEUERSTEIN T.J., MUTSCHLER A., LUPP A., VAN VELTHOVEN V., SCHLICKER E., GÖTHERT M. Endogenous noradrenaline activates α2-adrenoceptors on serotonergic nerve endings in human and rat neocortex. J. Neurochem. 1993;61:474–480. doi: 10.1111/j.1471-4159.1993.tb02148.x. [DOI] [PubMed] [Google Scholar]
- FIGUEROA H.R., YÜRGENS P.B., NEWTON D.K., HALL T.R. Evidence for negative feedback control of the release of [3H] serotonin from superfused mouse cerebellum slices induced by electrical field stimulation. Gen. Pharmacol. 1985;16:103–108. doi: 10.1016/0306-3623(85)90044-8. [DOI] [PubMed] [Google Scholar]
- FISCHER M.R.G., LIMBERGER N., STARKE K. The transmitter release pattern of serotonin axons in rabbit brain cortex slices during short pulse trains. Neurochem. Int. 1990;17:129–137. doi: 10.1016/0197-0186(90)90135-g. [DOI] [PubMed] [Google Scholar]
- FRANKHUYZEN A.L., MULDER A.H. Noradrenaline inhibits depolarization-induced [3H]-serotonin release from slices of rat hippocampus. Eur. J. Pharmacol. 1980;63:179–182. doi: 10.1016/0014-2999(80)90441-0. [DOI] [PubMed] [Google Scholar]
- GOBBI M., FRITTOLI E., MENNINI T. The modulation of [3H] noradrenaline and [3H] serotonin release from rat brain synaptosomes is not mediated by the α2B-adrenoceptor subtype. Naunyn-Schmiedeberg's Arch. Pharmacol. 1990;342:382–386. doi: 10.1007/BF00169453. [DOI] [PubMed] [Google Scholar]
- GÖTHERT M. Serotonin-receptor-mediated modulation of Ca2+-dependent 5-hydroxytryptamine release from neurones of the rat brain cortex. Naunyn-Schmiedeberg's Arch. Pharmacol. 1980;314:223–230. doi: 10.1007/BF00498543. [DOI] [PubMed] [Google Scholar]
- GÖTHERT M., HUTH H. Alpha-adrenoceptor-mediated modulation of 5-hydroxytryptamine release from rat brain cortex slices. Naunyn-Schmiedeberg's Arch. Pharmacol. 1980;313:21–26. doi: 10.1007/BF00505800. [DOI] [PubMed] [Google Scholar]
- GÖTHERT M., HUTH H., SCHLICKER E. Characterization of the receptor subtype involved in alpha-adrenoceptor-mediated modulation of serotonin release from rat brain cortex slices. Naunyn-Schmiedeberg's Arch. Pharmacol. 1981;317:199–203. doi: 10.1007/BF00503816. [DOI] [PubMed] [Google Scholar]
- HEIN L., ALTMAN J.D., KOBILKA B.K. Two functionally distinct α2-adrenergic receptors regulate sympathetic neurotransmission. Nature. 1999;402:181–184. doi: 10.1038/46040. [DOI] [PubMed] [Google Scholar]
- HOFFMAN B.J., MEZEY E., BROWNSTEIN M.J. Cloning of a serotonin transporter affected by antidepressants. Science. 1991;254:579–580. doi: 10.1126/science.1948036. [DOI] [PubMed] [Google Scholar]
- LIMBERGER N., BONANNO G., SPÄTH L., STARKE K. Autoreceptors and α2-adrenoceptors at the serotonergic axons of rabbit brain cortex. Naunyn-Schmiedeberg's Arch. Pharmacol. 1986;332:324–331. doi: 10.1007/BF00500082. [DOI] [PubMed] [Google Scholar]
- LIMBERGER N., FUNK L., TRENDELENBURG A.U., STARKE K. Subclassification of presynaptic α2-adrenoceptors: α2A-autoreceptors in rabbit atria and kidney. Naunyn-Schmiedeberg's Arch. Pharmacol. 1995a;352:31–42. doi: 10.1007/BF00169187. [DOI] [PubMed] [Google Scholar]
- LIMBERGER N., TRENDELENBURG A.U., STARKE K. Subclassification of presynaptic α2-adrenoceptors: α2D-autoreceptors in mouse brain. Naunyn-Schmiedeberg's Arch. Pharmacol. 1995b;352:43–48. doi: 10.1007/BF00169188. [DOI] [PubMed] [Google Scholar]
- MAURA G., BONANNO G., RAITERI M. Presynaptic α2-adrenoceptors mediating inhibition of noradrenaline and 5-hydroxytryptamine release in rat cerebral cortex: further characterization as different α2-adrenoceptor subtypes. Naunyn-Schmiedeberg's Arch. Pharmacol. 1992;345:410–416. doi: 10.1007/BF00176618. [DOI] [PubMed] [Google Scholar]
- MONGEAU R., BLIER P., DE MONTIGNY C. The serotonergic and noradrenergic systems of the hippocampus: their interactions and the effects of antidepressant treatments. Brain Res. Rev. 1997;23:145–195. doi: 10.1016/s0165-0173(96)00017-3. [DOI] [PubMed] [Google Scholar]
- NAKAZI M., BAUER U., NICKEL T., KATHMANN M., SCHLICKER E. Inhibition of serotonin release in the mouse brain via presynaptic cannabinoid CB1 receptors. Naunyn-Schmiedeberg's Arch. Pharmacol. 2000;361:19–24. doi: 10.1007/s002109900147. [DOI] [PubMed] [Google Scholar]
- PACHOLCZYK T., BLAKELY R.D., AMARA S.G. Expression cloning of a cocaine- and antidepressant-sensitive human noradrenaline transporter. Nature. 1991;350:350–354. doi: 10.1038/350350a0. [DOI] [PubMed] [Google Scholar]
- RAITERI M., MAURA G., FOLGHERA S., CAVAZZANI P., ANDRIOLI G.C., SCHLICKER E., SCHALNUS R., GÖTHERT M. Modulation of 5-hydroxytryptamine release by presynaptic inhibitory α2-adrenoceptors in the human cerebral cortex. Naunyn-Schmiedeberg's Arch. Pharmacol. 1990;342:508–512. doi: 10.1007/BF00169037. [DOI] [PubMed] [Google Scholar]
- SCHLICKER E., GÖTHERT M. Interactions between the presynaptic α2-autoreceptor and presynaptic inhibitory heteroreceptors on noradrenergic neurones. Brain Res. Bull. 1998;47:129–132. doi: 10.1016/s0361-9230(98)00068-9. [DOI] [PubMed] [Google Scholar]
- SIMONNEAUX V., EBADI M., BYLUND D.B. Identification and characterization of α2D-adrenergic receptors in bovine pineal gland. Mol. Pharmacol. 1991;40:235–241. [PubMed] [Google Scholar]
- STARKE K., MONTEL H. Involvement of α-receptors in clonidine-induced inhibition of transmitter release from central monoamine neurones. Neuropharmacol. 1973;12:1073–1080. doi: 10.1016/0028-3908(73)90051-8. [DOI] [PubMed] [Google Scholar]
- STARKE K., TRENDELENBURG A.U., LIMBERGER N. Presynaptic α2-adrenoceptors: subtype determination. Pharmacol. Commun. 1995;6:99–108. [Google Scholar]
- TRENDELENBURG A.U., HEIN L., GAISER E.G., STARKE K. Occurrence, pharmacology and function of presynaptic α2-autoreceptors in α2A/D-adrenoceptor-deficient mice. Naunyn-Schmiedeberg's Arch. Pharmacol. 1999;360:540–551. doi: 10.1007/s002109900093. [DOI] [PubMed] [Google Scholar]
- TRENDELENBURG A.U., SUTEJ I., WAHL C.A., MOLDERINGS G.J., RUMP L.C., STARKE K. A re-investigation of questionable subclassifications of presynaptic α2-autoreceptors: rat vena cava, rat atria, human kidney and quinea-pig urethra. Naunyn-Schmiedeberg's Arch. Pharmacol. 1997;356:721–737. doi: 10.1007/pl00005111. [DOI] [PubMed] [Google Scholar]
- TRENDELENBURG A.U., TRENDELENBURG M., STARKE K., LIMBERGER N. Release-inhibiting α2-adrenoceptors at serotonergic axons in rat and rabbit brain cortex: evidence for pharmacological identity with α2-autoreceptors. Naunyn-Schmiedeberg's Arch. Pharmacol. 1994;349:25–33. doi: 10.1007/BF00178202. [DOI] [PubMed] [Google Scholar]
- WAUD D.R.Analysis of dose-response relationships Advances in General and Cellular Pharmacology 19761New York: Plenum; 145–178.ed. Narahashi, T. & Bianchi, C.P. pp [Google Scholar]