Abstract
As arginase by limiting nitric oxide (NO) synthesis may play a role in airway hyperresponsiveness and glucocorticoids are known to induce the expression of arginase I in hepatic cells, glucocorticoid effects on arginase in alveolar macrophages (AMΦ) were studied.
Rat AMΦ were cultured in absence or presence of test substances. Thereafter, nitrite accumulation, arginase activity, and the expression pattern of inducible NO synthase, arginase I and II mRNA (RT – PCR) and proteins (immunoblotting) were determined.
Lipopolyssacharides (LPS, 20 h) caused an about 2 fold increase in arginase activity, whereas interferon-γ (IFN-γ), like LPS a strong inducer of NO synthesis, had no effect.
Dexamethasone decreased arginase activity by about 25% and prevented the LPS-induced increase. Mifepristone (RU-486) as partial glucocorticoid receptor agonist inhibited LPS-induced increase by 45% and antagonized the inhibitory effect of dexamethasone.
Two different inhibitors of the NF-κB-pathway also prevented LPS-induced increase in arginase activity.
Rat AMΦ expressed mRNA and protein of arginase I and II, but arginase I expression was stronger. Arginase I mRNA and protein was not affected by IFN-γ, but increased by LPS and this effect was prevented by dexamethasone. Both, LPS and IFN-γ enhanced the levels of arginase II mRNA and protein, effects also inhibited by dexamethasone. As IFN-γ did not affect total arginase activity, arginase II may represent only a minor fraction of total arginase activity.
In rat AMΦ glucocorticoids inhibit LPS-induced up-regulation of arginase activity, an effect which may contribute to the beneficial effects of glucocorticoids in the treatment of inflammatory airway diseases.
Keywords: Arginase, inducible nitric oxide synthase, alveolar macrophages, glucocorticoides, lipopolysaccharides, interferon-γ
Introduction
In macrophages (MΦ), the amino acid L-arginine, beyond being precursor in protein synthesis, is the substrate of nitric oxide synthase (NOS) and arginase. Both pathways play a particular role in host defence mechanisms and the control of inflammatory reactions (Xie & Nathan, 1994; Wu & Morris, 1998). Arginase which catalyses the formation of L-ornithine and urea appears to be expressed constitutively in MΦ, although its activity and/or expression may be modulated by various stimuli (Hey et al., 1995; Modolell et al., 1995; Wang et al., 1995; Corraliza et al., 1997; Sonoki et al., 1997; Louis et al., 1998; Morris et al., 1998). On the other hand, NOS in MΦ is not expressed constitutively, but the inducible isoenzyme (iNOS) is induced by bacterial toxins and/or pro-inflammatory cytokines (Jorens et al., 1991; Xie & Nathan, 1994; Hey et al., 1995; Wang et al., 1995; Hammermann et al., 2000).
Between iNOS and arginase multiple interactions can occur, suggesting counter-regulatory functions of these two pathways. Thus, L-arginine metabolism by arginase can limit L-arginine utilization by iNOS (Hey et al., 1997; Tenu et al., 1999), but on the other hand, iNOS by liberating NG-OH-L-arginine can exert inhibitory effects on arginase (Hecker et al., 1995; Buga et al., 1996). Arginase may also limit L-arginine availability for the constitutive isoforms of NOS, and functional experiments indicate that arginase by limiting NO synthesis may contribute to the development of airway hyperreactivity (Meurs et al., 2000). In addition to these interactions with the NOS pathway, arginase is a key enzyme in the synthesis of polyamines, proline and glutamate (Wu & Morris, 1998) indicating complex functional roles of this pathway.
Despite this great functional significance of arginase in MΦ, the present knowledge about the regulation of arginase in MΦ is rather fragmentary. There are two arginase isoenzymes, arginase I, first described as hepatic arginase and arginase II, as the non-hepatic enzyme (Jenkinson et al., 1996). Both enzymes have similar enzymatic properties, but differ with regard to subcellular localization and regulation of expression (Jenkinson et al., 1996). Whereas the rat and human sequences of arginase I are known for quite a long time (Dizikes et al., 1986; Kawamoto et al., 1987; Haraguchi et al., 1987), human, rat and mouse arginase II has been cloned and characterized only recently (Gotoh et al., 1996; Vockley et al., 1996; Morris et al., 1997; Iyer et al., 1998). Arginase I is, however, not restricted to the liver, but expressed in various non-hepatic cells and both arginase isoenzymes may be expressed even in the same cell (Gotoh et al., 1997a; Louis et al., 1998).
As arginase in the airways may contribute to the development of airway hyperreactivity and glucocorticoids, which play an important role in the treatment of asthmatic airway diseases (e.g. Barnes 1995; 1997), have been shown to up-regulate arginase I in hepatocytes and hepatoma cells (Haggerty et al., 1982; Dizikes et al., 1986; Nebes & Morris, 1988; Gotoh et al., 1997b), the present study aimed to characterize the effect of glucocorticoids on arginase activity and expression of arginase isoenzymes in rat alveolar macrophages. Because of the close link of the arginase pathway to the NOS pathway, the effects of the known iNOS inducers, LPS and interferon-γ (IFN-γ) and their interactions with glucocorticoids were also tested, and changes in the expression and activity of iNOS were always monitored in parallel.
Methods
Cell preparation and culture
Sprague Dawley rats (own breeding) of either sex were used to prepare AMΦ as described previously (Hey et al., 1995; 1997). AMΦ (5×10⁶) were cultured in 35 mm dishes in DME/F-12 medium supplemented with 5% foetal calf serum and antibiotics. AMΦ were allowed to adhere for 2 h (37°C; 5% CO2), before the medium was renewed to remove non-adherent cells. Afterwards, AMΦ were cultured for different times in the absence or presence of 1 μg ml−1 LPS or 500 u ml−1 recombinant rat interferon-γ (IFN-γ) alone or in combination with other test substances. In some experiments AMΦ were first cultured for 20 h in the absence of test substance followed by a second culture period in the absence or presence of LPS.
Arginase assay
For the determination of arginase activity cell lysates were prepared after the culture period by incubating the cells in 750 μl 0.1% Triton X-100 containing additionally the protease inhibitors phenylmethylsulfonyl fluoride (PMSF, 1 mM), leupeptin 0.5 μg ml−1, pepstatin A 0.7 μg ml−1 and EDTA 2 mM. Thereafter 500 μl portions of the cell lysates were mixed with 500 μl 25 mM Tris HCl (pH 7.4) containing 5 mM MnCl2 and incubated for 10 min at 56°C. Then 50 μl of a 0.5 M L-arginine solution (pH 9.7) were added to 50 μl of the heat-activated lysates and incubated for 1 h at 37°C. The amounts of urea were then determined by a spectrophotometric assay based on a reaction with α-isonitrosopropiophenon (Corraliza et al., 1995). The arginase activity was calculated from a standard curve (urea) and was expressed in absolute terms (mu μg protein−1; one unit is the enzyme activity which catalyzes the formation of 1 μmol urea per min) or as percentage of the mean value of the respective controls of the individual cell preparation.
Nitrite assay
As a measure of NO synthesis during the culture period nitrite which accumulated in the culture media was determined. Nitrite was quantified by a spectrophotometric assay based on the Griess reaction as described previously (Hey et al., 1995). Briefly, 400 μl Griess reagent (sulfanilic acid 1%, N(1-naphthyl)ethylenediamine hydrochloride 0.1% dissolved in 2.5% (w v−1) H3PO4) were added to 400 μl incubation medium. After 20 min of incubation at room temperature absorbance was measured at 540 nm. The nitrite contents given in the Results section were calculated from a standard curve (NaNO2) and expressed in absolute terms (nmol (106 cells)−1).
Extraction of RNA and reverse transcription-polymerase chain reaction (RT – PCR)
Total RNA was prepared and the first strand cDNA synthesized as described previously (Hammermann et al., 1998; Racké et al., 1998). Oligonucleotide primers were constructed based on EMBL sequences: rat β-actin, 5′-TTCTACAATGAGCTGCGTGTGGC-3′ and 5′-AGAGGTCTTTACGGATGTCAACG-3′; rat iNOS, 5′-CATGAACTCCAAGAGTTTGACCAG-3′ and 5′-GCCCAGGTCGATGCACAACTGG-3′; rat arginase I, 5′-AAAGCCCATAGAGATTATCGGAGCG-3′ and 5′-AGACAAGGTCAACGGCACTGCC-3′; rat arginase II, 5′-TTAGTAGAGCTGTGTCAGGTGGC-3′ and 5′-ACTTGAAGCAATCACATCCACTGC-3′. PCR amplification was performed using RedTaq DNA polymerase and specific primers in a programmable thermal reactor (RoboCycler®, Stratagene, Amsterdam, The Netherlands) with initial heating for 3 min at 94°C, followed by 25 (iNOS, arginase I and β-actin) or 35 (arginase II) cycles of 45 s denaturation at 94°C, annealing at 56°C (30 s), extension at 72°C (1 min), and a final extension for 10 min at 72°C. PCR products were separated by a 1.2% agarose gel electrophoresis and documented by a video documentation system and the optical density of the bands was quantified by the RFLPscan 2.01 software (MWG, Ebersberg, Germany). PCR products were sequenced by MWG (single strand analysis).
Immunoblotting of iNOS, arginase I and II
Cellular proteins were extracted and separated by SDS – PAGE (7.5% for iNOS, 12% for arginase I and II; 10 μg protein per lane for iNOS and arginase I, 25 μg protein for arginase II) and then transferred onto a PVDF membrane. The immobilized proteins were visualized by subsequent incubation with a polyclonal rabbit antibody against mouse iNOS (Calbiochem, Bad Soden, Germany), and polyclonal rabbit antibodies against rat arginase I and II. The anti-arginase antibodies had been generated against specific peptide sequences (arginase I: H2N-CEGNHKPETDYLKPPK-COOH; arginase II H2N-CHLPTPSSPHESEKEE-COOH). A polyclonal horseradish peroxidase-conjugated goat anti-rabbit IgG (BioRad, Munich, Germany) was used as secondary antibody and staining was performed with the BM chemiluminescence blotting kit (Boehringer Mannheim, Germany). The ‘housekeeping' protein α-tubulin was detected with a mouse monoclonal anti-human α-tubulin antibody (Cedar Lane, Hornby, Canada) and a secondary horseradish peroxidase-conjugated goat anti-mouse IgG (BioRad). Finally, the blots were exposed to Hyperfilm ECL (Amersham Buchler, Braunschweig, Germany). Optical density of the bands was quantified by using a video documentation system and the RFLPscan software.
Statistical analysis
All values are mean±s.e.mean of n experiments. Statistical significance of differences was evaluated by Student's t-test. When multiple comparisons were performed the significance of differences was evaluated by ANOVA or repeated measures ANOVA followed Dunnett or Bonferroni test when appropriate using the computer program GraphPad InStat (GraphPad Software, San Diego, U.S.A.). P<0.05 was accepted as significant.
Drugs and materials
Amphotericin B, L-arginine HCl, cycloheximide, desoxynucleotide mixture, dexamethasone, Dulbecco's modified Eagle's medium/nutrient mixture F-12 Ham (DME/F-12 medium), rat interferon-γ, α-isonitrosopropiophenon, leupeptin; lipopolysaccharides from Escherichia coli 0127:B8, mifepristone (RU-486), penicillin-streptomycin solution, pepstatin A, phenylmethylsulfonyl fluoride (PMSF), pyrrolidine dithiocarbamate (PDTC), RedTaq DNA-polymerase and Nα-p-tosyl-L-lysine chloromethyl ketone (TLCK) were all purchased from Sigma (Deisenhofen, Germany); foetal calf serum (FCS) from Biochrom (Berlin, Germany), DC Protein Assay from BioRad (Munich, Germany), Trizol® reagent for RNA isolation from Life Technologies (Karlsruhe, Germany) and AMV reverse transcriptase from Promega (Mannheim, Germany). All oligodesoxynucleotides for RT – PCR were obtained from MWG Biotech (Ebersberg, Germany).
Results
Effects of LPS and IFN-γ
The basal arginase activity determined in rat AMΦ after a 20 h culture period under control conditions varied between 0.20±0.02 (n=8) and 0.35±0.05 (n=9) mu μg protein−1 in different series of experiments. Generally, arginase activity showed much smaller variations within one cell preparation than between different cell preparations. Therefore, in the following the data were expressed as per cent of the controls within an individual cell preparation. In initial experiments the effects of two potent iNOS inducers, LPS and IFN-γ, were studied. Presence of 1 μg ml−1 LPS during the culture period caused a clear up-regulation of the arginase activity as well as an increase in nitrite accumulation (Figure 1). On the other hand, IFN-γ (100 or 500 u ml−1), which caused a similar increase in nitrite accumulation had no effect on arginase activity (Figure 1).
Figure 1.
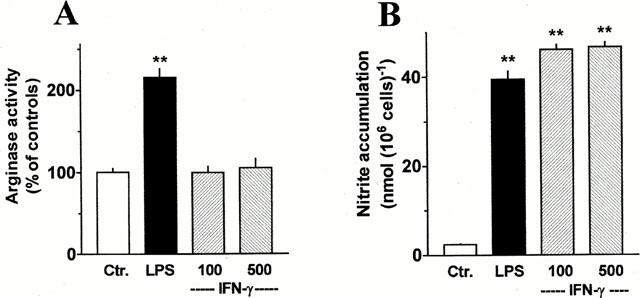
Comparison of the effects of LPS and IFN-γ on arginase activity and nitrite accumulation of AMΦ. Cells were cultured for 20 h under control conditions or in the presence of 1 μg ml−1 LPS or IFN-γ (100 or 500 u ml−1). The cells were lysed and the arginase activity was determined (A). The culture medium was collected and analysed for nitrite accumulation (B). Results are expressed in absolute terms for nitrite accumulation or as per cent of the mean value of the controls of the respective cell preparation for arginase activity. Given are means+s.e.mean of 6 – 12 experiments. **P<0.01 when compared with the respective control value (Ctr.).
In rat AMΦ, cultured for 20 h under control conditions, mRNA for arginase I and II could be detected by the use of RT – PCR (Figure 2A). However, a clear signal for arginase I was obtained already at 25 PCR cycles, whereas a much weaker signal was obtained for arginase II even at 35 cycles (Figure 2A). Sequencing of the PCR products demonstrated 99% homology to the published sequences of rat arginase I and II, respectively. Presence of LPS (1 μg ml−1) during the 20 h culture period resulted in a marked increase of the mRNA for both, arginase I and II. When the quantities of the PCR products for arginase I and II were expressed as ratios over that of β-actin, the signal for arginase I and II mRNA were increased 3 – 4 fold (Figure 2B). When IFN-γ (500 u ml−1) was present during the culture period, the mRNA signal for arginase I appeared unchanged, whereas that for arginase II was enhanced by about 80% (Figure 2B). On the other hand, both IFN-γ as well as LPS caused the well known, marked up-regulation of mRNA for iNOS also in the present cells (Figure 2A,B).
Figure 2.
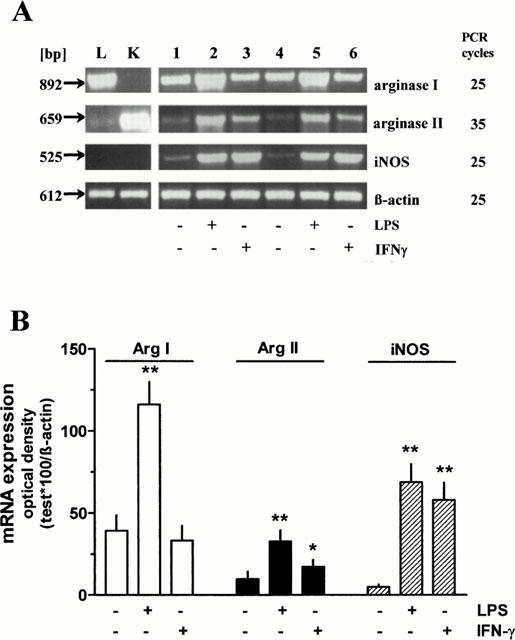
RT – PCR performed with RNA isolated from independent pools of rat AMΦ cultured for 20 h in the absence or presence of LPS (1 μg ml−1) or IFN-γ (500 u ml−1) (lanes 1 – 6) or from rat liver (L) and kidney (K) tissue using primer pairs specific for rat arginase I and II, iNOS and β-actin. PCR products were separated on a 1.2% agarose gel. (A) representative samples of PCRs. (B) densitometric quantification of the PCR bands. Given are the ratios of PCR products of arginase I and II, and iNOS×100 over the respective value of β-actin, mean values+s.e.mean of n=6 – 7. *P<0.05; **P<0.01 compared with the respective control value (absence of LPS and IFN-γ).
The effects of IFN-γ and LPS on the mRNA levels were accompanied by corresponding changes at the protein levels (Figure 3). Thus, iNOS protein was markedly increased by LPS as well as by IFN-γ. Arginase I levels were enhanced after exposure to LPS, but not after exposure to IFN-γ. Finally, arginase II levels were enhanced after exposure to both, LPS and IFN-γ. However, whereas the increase in arginase II mRNA caused by LPS appeared to be larger than that by IFN-γ (Figure 2), at the protein level the effects of IFN-γ appeared to be more pronounced than those of LPS (Figure 3B).
Figure 3.
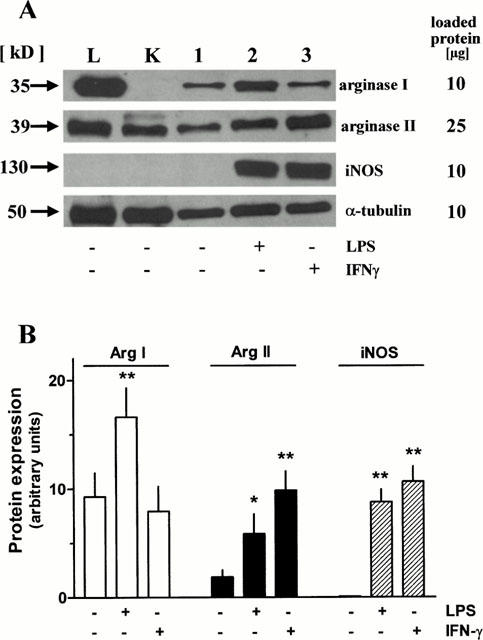
Immunoblot analysis of homogenates from rat AMΦ cultured for 20 h in the absence or presence of LPS (1 μg ml−1) or IFN-γ (500 u ml−1) (lanes 1 – 3) or from rat liver (L) and kidney (K) tissues using antibodies against arginase I and II, iNOS and α-tubulin. (A) representative samples of SDS – PAGE. (B) Densitometric quantification of the protein bands. Given are arbitrary units of the optical density of the respective bands, means+s.e.mean of n=6 – 11 for arginases and n=3 for iNOS. *P<0.05; **P<0.01 compared with the respective control value (absence of LPS and IFN-γ).
In order to characterize further the anti-arginase antibodies, tissue samples of liver and kidney had been included, as these tissues are known to express either arginase I or II (Wu & Morris, 1998; Jenkinson et al., 1996). The arginase I antibody detected a large protein band of the size of arginase I in liver samples, but no band was seen in kidney samples (Figure 3A). Moreover, the arginase I band in AMΦ corresponded well to that in liver tissue (Figure 3A). On the other hand, the arginase II antibody detected a clear band corresponding to the size of arginase II, both in kidney and liver samples. In agreement to these observations regarding the protein level, RT – PCR demonstrated mRNA for arginase I in liver, but not in kidney samples (Figure 2A), and mRNA for arginase II was detected in both, kidney and liver samples, although the signal for arginase II mRNA in the liver samples was rather weak (Figure 2A).
In order to get some information about the expression of the two arginase isoenzymes in AMΦ under in vivo conditions, RT – PCR was also performed with RNA prepared from freshly isolated AMΦ. Therefore, RNA was extracted from the cells immediately after the lung lavage. The purity of such a cell preparation is smaller (80 – 90% AMΦ) than of a cell preparation in which the AMΦ were enriched by the usually performed adherence and washing protocol (>95% AMΦ). Both, in cells of the crude lavage as well as in cells which underwent a 2 h adherence protocol, mRNA for arginase I and II was clearly detected, whereas mRNA for iNOS was absent (Figure 4), and this correlated with observations showing the presence of arginase I and II protein, but not iNOS protein in freshly prepared cells (data not shown, n=2). It appears that in particular the mRNA for arginase II declined markedly during the 20 h culture period. Interestingly, presence of LPS opposed the decline of arginase II mRNA, but did not enhance the mRNA above the initial level (Figure 4). On the other hand, arginase I mRNA declined less during 20 h culture, and presence of LPS caused an increase clearly above the initial levels (Figure 4). Noteworthy, an inductive effect of LPS on arginase I mRNA was seen after 5 h, whereas the inductive effect of LPS on iNOS mRNA levels was already evident after 2 h (Figure 4).
Figure 4.
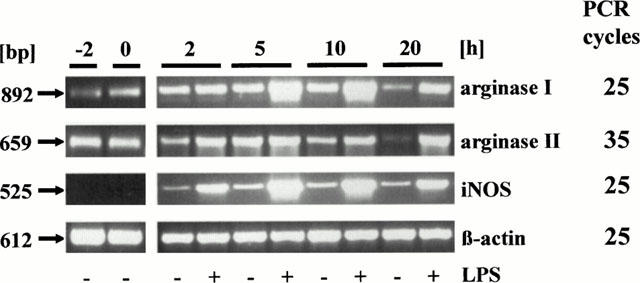
Time-dependent effect of culture in the absence or presence of 1 μg ml−1 LPS on the expression of mRNA for arginase I and II, and iNOS in rat AMΦ. Total RNA was prepared from AMΦ freshly isolated (−2 h), after a 2 h adherence period (0 h) or after additional 2, 5, 10 or 20 h in culture as indicated. RT – PCR was performed as described in Figure 2. Given is one out of three similar experiments.
In order to see a possible inductive effect of LPS on arginase II more clearly an additional set of experiments was performed in which AMΦ were first cultured for 20 h under control conditions, followed by additional 2, 5 or 10 h culture in the absence or presence of LPS, i.e. LPS was added after the decline of arginase II mRNA. As shown in Figure 5, low levels of mRNA for arginase II were detected at all time points, independent of the presence or absence of LPS. Arginase I mRNA was substantially higher, and presence of LPS caused a clear increase which was first seen after 5 h. LPS caused also an induction of iNOS mRNA, but again this effect was already seen after 2 h (Figure 5).
Figure 5.
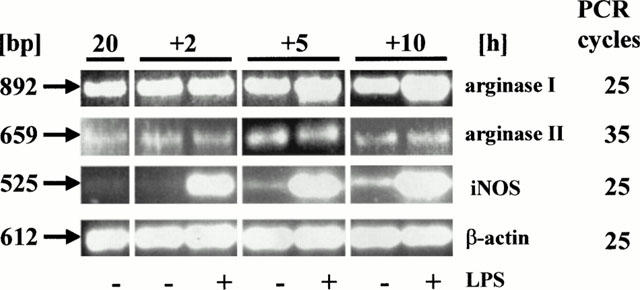
Time-dependence of the effect of LPS (1 μg ml−1, added after a 20 h culture period) on the expression of mRNA for arginase I and II, and iNOS in rat AMΦ. Total RNA was isolated from AMΦ at the time points indicated, and RT – PCR was performed as described in Figure 2. Given is one out of three similar experiments.
Effects of dexamethasone
After culture in the presence of dexamethasone basal arginase activity was reduced by about 25%, and the maximum effect was seen at 1 μM (Figure 6). Moreover, 1 μM dexamethasone prevented the LPS-induced up-regulation of arginase activity, and 0.1 μM dexamethasone was almost as effective (Figure 6). Mifepristone (RU-486, 1 and 10 μM) alone did not cause a significant effect on arginase activity, but inhibited the stimulatory effect of LPS by about 50% and 70%, respectively (Figure 6 and data not shown). Furthermore, mifepristone and dexamethasone together acted in a manner suggesting competitive interaction at a common receptor. Thus, in the presence of 1 μM mifepristone, 0.1 μM dexamethasone did not cause a stronger inhibition of the LPS-activated arginase activity than mifepristone alone (Figure 6), i.e. the full agonist activity of dexamethasone was blocked. The antagonistic effect of 1 μM mifepristone was partially surmounted by increasing the concentration of dexamethasone to 1 μM (Figure 6).
Figure 6.
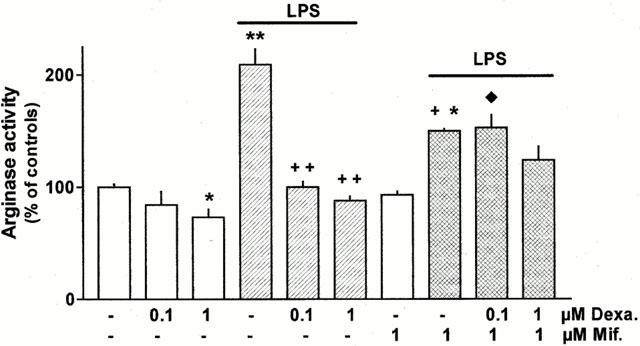
Effect of LPS, dexamethasone (Dexa.) and mifepristone (Mif.) alone or in combination on arginase activity in rat AMΦ. Cells were cultured for 20 h under control conditions or in the presence of the test substances at the concentrations indicated. Thereafter cells were lysed and arginase activity was determined. Results are expressed as per cent of the mean value of the controls of the respective cell preparation. Given are means+s.e.mean of 6 – 12 experiments. *P<0.05; **P<0.01 when compared with controls (absence of test substances.);+P<0.05; ++ P<0.01 compared with LPS alone; ♦P<0.05 compared with respective experiments with LPS plus dexamethasone.
These functional observations correlated with corresponding findings on the expression of arginase mRNAs and proteins. After 20 h exposure to dexamethasone mRNA and protein level of arginase I tended to be reduced and the LPS-induced increase in arginase I and II mRNA and protein was prevented (Figure 7). As already mentioned above, the LPS-induced increase in mRNA was almost maximally after 5 h of exposure (Figure 4). This initial increase in arginase I mRNA was only partially inhibited by dexamethasone, whereas cycloheximide abolished it (Figure 8). Cycloheximide alone had no effect on basal arginase I mRNA (data not shown).
Figure 7.
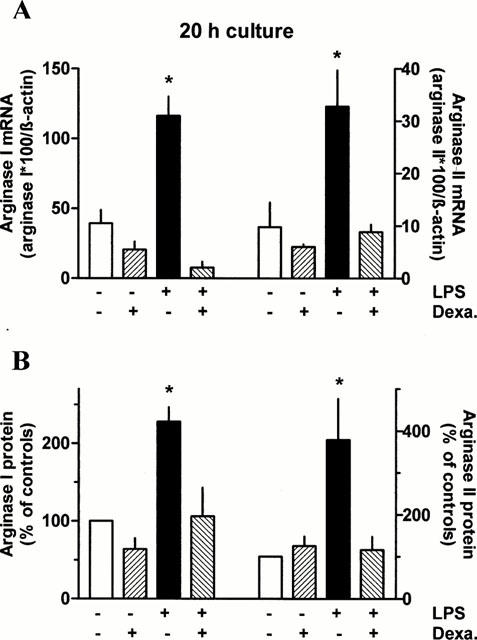
Effect of 20 h exposure to dexamethasone and/or LPS on arginase I and II mRNA and protein expression in rat AMΦ. AMΦ were cultured for 20 h in the absence or presence of LPS (1 μg ml−1) and/or dexamethasone (Dexa., 1 μM). Thereafter total RNA was isolated or proteins were extracted and RT – PCRs and immunoblots were performed as described in Figures 2 and 3, respectively. Height of columns: (A) densitometric quantification of the PCR bands. Given are the ratios of PCR products of arginase I and II×100 over the respective value of β-actin; (B) densitometric quantification of the protein bands, expressed as per cent of the respective control. The absolute values (arbitrary units) of the controls were 6.8±1.3 (n=13) for arginase I and 2.6±0.7 (n=12) for arginase II. Given are mean values+s.e.mean of n=3 – 7. *P<0.05 compared with the respective control value (absence of LPS and Dexa.).
Figure 8.
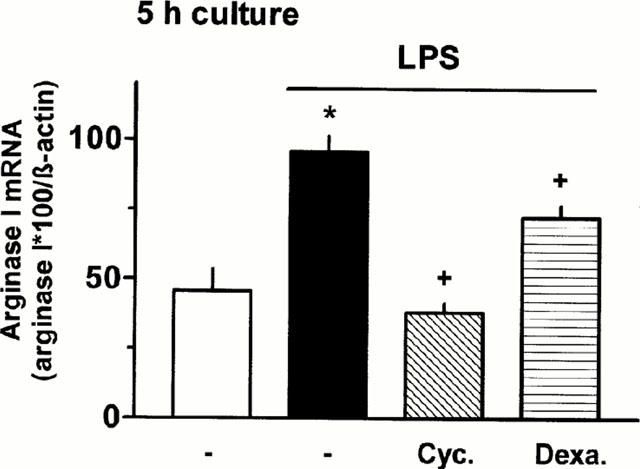
Effect of 5 h exposure to LPS in the absence or presence of cycloheximide or dexamethasone on arginase I mRNA in rat AMΦ. AMΦ were cultured for 5 h in the absence or presence of LPS (1 μg ml−1) and cycloheximide (Cyc., 10 μM) or dexamethasone (Dexa., 1 μM). Thereafter total RNA was isolated and RT – PCRs were performed as described in Figure 2. Height of columns: densitometric quantification of the PCR bands. Given are the ratios of PCR products of arginase I×100 over the respective value of β-actin. Given are mean values+s.e.mean of n=3 – 7. *P<0.01 compared with the respective control value; +P<0.05 compared with LPS alone.
Effects of NF-κB inhibitors
After culture in the presence of the NF-κB inhibitors pyrrolidine dithiocarbamate (PDTC, 60 μM) and Nα-p-tosyl-L-lysine chloromethyl ketone (TLCK, 100 μM) basal arginase activity was reduced by about 35% (Figure 9). Moreover, the LPS-induced up-regulation of arginase activity was prevented by 60 μM PCTC and largely attenuated by 100 μM TLCK (Figure 9).
Figure 9.
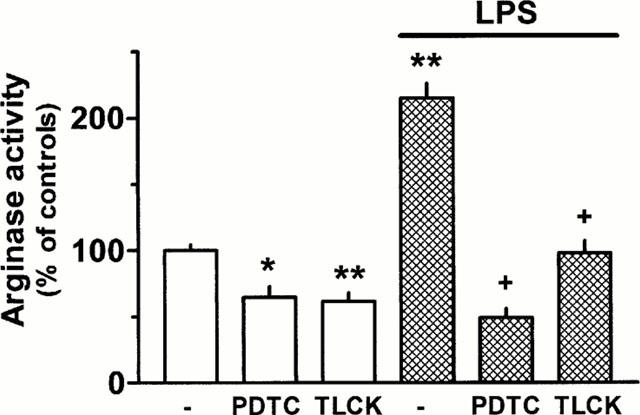
Effect of the NF-κB inhibitors pyrrolidine dithiocarbamate (PDTC, 60 μM) and Nα-p-tosyl-L-lysine chloromethyl ketone (TLCK, 100 μM) alone or in combination with LPS (1 μg ml−1) on arginase activity in rat AMΦ. Cells were cultured for 20 h under control conditions or in the presence of the test substances. Thereafter cells were lysed and arginase activity was determined. Results are expressed as per cent of the mean value of the controls of the respective cell preparation. Given are means+s.e.mean of 11 – 12 experiments. *P<0.05; **P<0.01 when compared with controls (absence of test substances.); +P<0.001 compared with LPS alone.
Discussion
Rat AMΦ express arginase I and II
The present study shows that rat AMΦ express simultaneously arginase I and II, and this was demonstrated at the mRNA level by RT – PCR and at the protein expression level by immunoblotting using isoform specific antibodies. In order to characterize the arginase antibodies used in the present study for the first time, control experiments with extracts of rat liver and kidney were performed as these tissues are known to express arginase I and II, respectively (Jenkinson et al., 1996; Wu & Morris, 1998). The arginase I antibody detected a band of the expected molecular size (≈amp;35 kD) in extracts of the liver, but not of the kidney. The arginase II antibody detected a band of the molecular size of arginase II (≈amp;39 kD) in extracts of kidney and liver. The detection of arginase II in liver tissue may not reflect an unspecific reaction of the antibody, because a weak mRNA signal for arginase II was also detected (Figure 2A). Arginase II mRNA was demonstrated recently also in human and mouse liver (Gotoh et al., 1997a; Morris et al., 1997), and it was suggested that arginase II in the liver might be expressed in nonparenchymal cells (Morris et al., 1997).
Analysis of freshly prepared AMΦ indicated that arginase I and II may be coexpressed under in vivo conditions. However, during the course of 20 h culture mRNA for arginase II substantially declined, indicating that the physiological in vivo environment in the lung may provide factors stimulating the expression or preventing the down-regulation of arginase II, although at present the nature of such factors remains obscure. Arginase I mRNA did not markedly decline during the 20 h culture period suggesting a constitutive expression of arginase I in rat AMΦ. These findings are in line with observations in rat peritoneal MΦ in which mRNA for arginase I was detectable by Northern blot or RT – PCR (Louis et al., 1998; Waddington et al., 1998), whereas mRNA for arginase II was not detected by Northern blot (Sonoki et al., 1997; Louis et al., 1998), or only a weak arginase II mRNA signal was demonstrated by RT – PCR (Waddington et al., 1998). The different sensitivity of the techniques used to detect mRNA and also the way to elicite the peritoneal MΦ may account for the different results with regard to arginase II. Nevertheless, it appears that the peritoneal environment, in contrast to the lung, does not provide strong stimuli for the up-regulation of arginase II. The situation seems to be somewhat different in murine cells, where both isoforms of arginase were found to be expressed in peritoneal MΦ (Louis et al., 1998). In the murine MΦ cell line RAW 264.7, only arginase II was found to be expressed under basal conditions, but arginase I was inducible by a stable cyclic AMP analogue, most effectively in combination with LPS, although LPS alone was ineffective (Morris et al., 1998). Altogether, the expression of the two arginase isoforms in MΦ appears to be quite variable, largely depending on the origin, history and environment of the respective MΦ. This may be taken as an indication that in MΦ the two arginase isoforms are rigorously regulated according to the actual needs which arginase I and II obviously meet differently. Diverse functional roles of the two arginase isoforms are also suggested by their putative different subcellular distribution, arginase I in the cytosol and arginase II in mitochondria; the latter is indicated by the presence of a mitochondrial import signal at the N-terminus (Vockley et al., 1996; Iyer et al., 1998).
In rat alveolar macrophages the expression of arginase I appears to be stronger than that of arginase II: (1) Although the present RT – PCR technique does not allow to measure absolute levels of mRNA, the observation that a clear arginase I signal was obtained with 25 PCR cycles, but 35 PCR cycles were required for arginase II suggests that arginase I mRNA levels might be higher than those of arginase II. (2) The fact that in the immunoblots 2.5 fold more total protein had to be loaded onto the gels for detection of arginase II than for detection of arginase I points into the same direction. (3) Finally, selective up-regulation of arginase II by IFN-γ (seen at the mRNA and protein level) did not result in an increased total arginase activity suggesting that total arginase activity reflects essentially arginase I.
Differential effects of LPS and IFN-γ
In the present study on rat AMΦ it was observed that the presence of LPS during the culture period opposed the decline of arginase II mRNA and this correlated with enhanced arginase II protein levels after 20 h culture in the presence of LPS. However, LPS appears only to prolong the persistence of already expressed mRNA for arginase II, rather than to stimulate its expression, a conclusion supported by the following observations. LPS, present from the onset of the in vitro culture period, did not cause an elevation of the arginase II mRNA above the initial levels. Likewise, LPS, given after a 20 h culture period, i.e. after arginase II mRNA was declined, failed to provoke an increase of the arginase II mRNA.
In contrast, the expression of arginase I mRNA was clearly enhanced by LPS, independent of whether LPS was present from the onset of culture (Figures 2 and 4) or whether it was added after a 20 h culture period (Figure 5). The arginase I protein was also found to be enhanced after culture in the presence of LPS (Figure 3), although this increase was relatively smaller than that of the respective mRNA signal (compare Figures 2B and 3B). Interestingly, the inductive effect of LPS on iNOS mRNA occurred significantly faster than that on arginase I mRNA (Figures 4 and 5), which agrees with observations on peritoneal MΦ (Sonoki et al., 1997). The involvement of de novo synthesized transcription factors could explain the slow onset of induction, a conclusion supported also by the observation that cycloheximide blocked the LPS-induced up-regulation of arginase I mRNA. As there is evidence that the induction of iNOS may also involve de novo synthesis of transcription factors (Ding et al., 1995; Hammermann et al., 2000), the different kinetics suggest that different factors up-regulate iNOS and arginase I.
Furthermore it may be considered that after induction of iNOS by LPS, L-arginine turnover by arginase is markedly reduced (Hey et al., 1995; 1997; Hecker et al., 1995) and the up-regulation of arginase I could just be a counter regulatory response. However, the observations that IFN-γ which also caused a marked induction of iNOS, seen at the mRNA, protein and enzyme activity level (Figures 1, 2 and 3, Hammermann et al., 2000) had no effect on the arginase activity (Figure 1) and on the expression of arginase I (mRNA and protein, Figures 2 and 3), argue against the significance of the latter mechanism. Thus, a simple link between iNOS and arginase I appears to be unlikely.
On the other hand, arginase II mRNA and protein were enhanced after culture in the presence of IFN-γ. The stimulatory effect of IFN-γ on arginase II as observed in the present experiments contrasts with observations on RAW 264.7 MΦ, where IFN-γ alone had no effect on arginase II mRNA (Morris et al., 1998) and protein (Wang et al., 1995), and even opposed the stimulatory effect of cyclic AMP (Morris et al., 1998) and LPS (Wang et al., 1995). These divergent observations point again to the substantial differences which may exist between primary and transformed MΦ and possibly between different species (Louis et al., 1998).
Effects of glucocorticoids
As outlined already in the introduction, arginase can limit L-arginine availability for NO synthesis and an increase in arginase activity in the airway tissue may cause airway hyperresponsiveness by limiting NO synthesis. As glucocorticoids play an important role in the treatment of inflammatory airway diseases and glucocorticoids have been shown to up-regulate arginase I in hepatic cells, it is of interest to know the effects of glucocorticoids on arginase in airway cells. MΦ, which are present in all parts of the airways, represent a cellular compartment with high arginase activity (Hey et al., 1995; Hecker et al., 1995). In contrast to the known stimulatory effect of glucocorticoids on arginase I in hepatic cells, dexamethasone did not cause an up-regulation of arginase activity in rat AMΦ, but rather caused a slight inhibition. Moreover, dexamethasone prevented the LPS-induced increase in arginase activity and this correlated with corresponding effects on the expression of mRNA and protein of arginase I which appears to account for most of the arginase activity in rat AMΦ (see above). Similarly, very recently it has also been reported that arginase I in vascular smooth muscle cells was up-regulated by IL-4 and IL-13 and that this effect was also inhibited by dexamethasone (Wei et al., 2000). Thus, it appears that dexamethasone elicits opposite effects on the expression of arginase I in hepatic and non-hepatic cells. Although the reason for this difference remains unknown, the following points might be considered. A glucocorticoid responsive element (GRE) appears not to be present in the arginase I promoter and the up-regulation of arginase I in hepatic cells appears to be mediated indirectly via the induction of a CCAAT/enhancer binding protein (C/EBP) (Gotoh et al., 1994; 1997b). C/EBP is enriched in the liver and plays a role in the liver specific expression of several other genes (van Ooij et al., 1992; Nishiyori et al., 1994). On the other hand, glucocorticoids can exert their effects not only via induction of gene transcription (‘transactivation'), but also by inhibiting the action of transcription factors such as AP-1 or NF-κB (‘transrepression') (Adcock, 2000). The glucocorticoid-receptor antagonist mifepristone lacks intrinsic activity with regard to transactivation, but shows partial agonist properties with regard to transrepression (Vayssière et al., 1997; Hofmann et al., 1998; Adcock et al., 1999). In the present experiments mifepristone alone partially inhibited the LPS-induced increase in arginase activity and in addition, antagonized the effect of dexamethasone in a manner suggesting a competitive interaction, i.e. mifepristone displayed the characteristics of a partial agonist. Therefore, it may be concluded that transrepression may be the mechanism by which glucocorticoids inhibit the up-regulation of arginase I in rat AMΦ, similarly to many anti-inflammatory effects of glucocorticoids. Experiments with PDTC and TLCK, which inhibit NF-κB activation by acting at different sites in the NF-κB signalling pathway (Sherman et al., 1993; Kim et al., 1995), indicate that this transcription factor plays an essential role in the up-regulation of arginase activity in rat AMΦ Therefore, it appears possible that glucocorticoids may down-regulate arginase activity by exerting inhibitory effects on the NF-κB signalling pathway. However, the exact site of action of glucocorticoids will have to be illuminated in future studies.
Finally, dexamethasone also opposed the LPS-induced increase in arginase II. Althought not analysed in detail in the present study, it appears that LPS does not induce the expression of arginase II, but may rather increase the stability of arginase II mRNA and possibly also that of the protein. Therefore, one has to assume that dexamethasone may interfere with this, at present not well characterized, effect as well. However, it should be mentioned that for example for iNOS a glucocorticoid-induced reduction of the stability of mRNA and protein has already been described (Kunz et al., 1996; Walker et al., 1997).
In conclusion, in rat AMΦ arginase I and II are co-expressed, but regulated differentially, and arginase I appears to be the predominant enzyme. Glucocorticoids, although known to enhance the expression of arginase I in hepatic cells, have no such an effect in rat AMΦ. In contrast, in AMΦ they inhibit the LPS-induced increase of arginase I expression. This effect may contribute to the beneficial effects of glucocorticoids in the treatment of inflammatory airway diseases as there is evidence that arginase by limiting NO synthesis may be involved in the development of airway hyperresponsiveness.
Acknowledgments
This work was supported by the Deutsche Forschungsgemeinschaft (Ra-400/10-1). This paper contains part of the Dr. rer. nat thesis of S. Klasen.
Abbreviations
- AMΦ
alveolar macrophages
- bp
basepairs
- PDTC
pyrrolidine dithiocarbamate
- IFN-γ
interferon-γ
- iNOS
inducible nitric-oxide synthase
- kD
kilodalton
- LPS
lipopolysaccharide
- MΦ
macrophages
- NO
nitric oxide synthase
- RT – PCR
reverse transcription – polymerase chain reaction
- TLCK
Nα-p-tosyl-L-lysine chloromethyl ketone
References
- ADCOCK I.M. Molecular mechanisms of glucocorticosteroid actions. Pulm. Pharmacol. Ther. 2000;13:115–126. doi: 10.1006/pupt.2000.0243. [DOI] [PubMed] [Google Scholar]
- ADCOCK I.M., NASUHARA Y., STEVENS D.A., BARNES P.J. Ligand-induced differentiation of glucocorticoid receptor (GR) trans-repression and transactivation: preferential targetting of NF-kappaB and lack of I-kappaB involvement. Br. J. Pharmacol. 1999;127:1003–1011. doi: 10.1038/sj.bjp.0702613. [DOI] [PMC free article] [PubMed] [Google Scholar]
- BARNES P.J. Inhaled glucocorticoids for asthma. N. Engl. J. Med. 1995;332:868–875. doi: 10.1056/NEJM199503303321307. [DOI] [PubMed] [Google Scholar]
- BARNES P.J. Molecular mechanisms of glucocorticoid action in asthma. Pulm. Pharmacol. Ther. 1997;10:3–19. doi: 10.1006/pupt.1997.0074. [DOI] [PubMed] [Google Scholar]
- BUGA G.M., SINGH R., PERVIN S., ROGERS N.E., SCHMITZ D.A., JENKINSON C.P., CEDERBAUM S.D., IGNARRO L.J. Arginase activity in endothelial cells: Inhibition by NG-hydroxy-L-arginine during high-output NO production. Am. J. Physiol. 1996;271:H1988–H1998. doi: 10.1152/ajpheart.1996.271.5.H1988. [DOI] [PubMed] [Google Scholar]
- CORRALIZA I.M., MODOLELL M., FERBER E., SOLER G. Involvement of protein kinase A in the induction of arginase in murine bone marrow-derived macrophages. Biochim. Biophys. Acta. 1997;1334:123–128. doi: 10.1016/s0304-4165(96)00081-5. [DOI] [PubMed] [Google Scholar]
- CORRALIZA I.M., SOLER G., EICHMANN K., MODOLELL M. Arginase induction by suppressors of nitric oxide synthesis (IL-4, IL-10 and PGE2) in murine bone-marrow-derived macrophages. Biochem. Biophys. Res. Commun. 1995;206:667–673. doi: 10.1006/bbrc.1995.1094. [DOI] [PubMed] [Google Scholar]
- DING A., HWANG S., LANDER H.M., XIE Q.-W. Macrophages derived from C3H/HeJ (Lpsd) mice respond to bacterial lipopolysaccharide by activating NF-kappa B. J. Leukoc. Biol. 1995;57:174–179. doi: 10.1002/jlb.57.1.174. [DOI] [PubMed] [Google Scholar]
- DIZIKES G.J., SPECTOR E.B., CEDERBAUM S.D. Cloning of rat liver arginase cDNA and elucidation of regulation of arginase gene expression in H4 rat hepatoma cells. Somat. Cell Mol. Genet. 1986;12:375–384. doi: 10.1007/BF01570732. [DOI] [PubMed] [Google Scholar]
- GOTOH T., ARAKI M., MORI M. Chromosomal localization of the human arginase II gene and tissue distribution of its mRNA. Biochem. Biophys. Res. Commun. 1997a;233:487–491. doi: 10.1006/bbrc.1997.6473. [DOI] [PubMed] [Google Scholar]
- GOTOH T., CHOWDHURY S., TAKIGUCHI M., MORI M. The glucocorticoid-responsive gene cascade. Activation of the rat arginase gene through induction of C/EBPbeta. J. Biol. Chem. 1997b;272:3694–3698. doi: 10.1074/jbc.272.6.3694. [DOI] [PubMed] [Google Scholar]
- GOTOH T., HARAGUCHI Y., TAKIGUCHI M., MORI M. The delayed glucocorticoid-responsive and hepatoma cell-selective enhancer of the rat arginase gene is located around intron 7. J. Biochem. 1994;115:778–788. doi: 10.1093/oxfordjournals.jbchem.a124409. [DOI] [PubMed] [Google Scholar]
- GOTOH T., SONOKI T., NAGASAKI A., TERADA K., TAKIGUCHI M., MORI M. Molecular cloning of cDNA for nonhepatic mitochondrial arginase (arginase II) and comparison of its induction with nitric oxide synthase in a murine macrophage-like cell line. FEBS Lett. 1996;395:119–122. doi: 10.1016/0014-5793(96)01015-0. [DOI] [PubMed] [Google Scholar]
- HAGGERTY D.F., SPECTOR E.B., LYNCH M., KERN R., FRANK L.B., CEDERBAUM S.D. Regulation of glucocorticoids of arginase and argininosuccinate synthetase in cultured rat hepatoma cells. J. Biol. Chem. 1982;257:2246–2253. [PubMed] [Google Scholar]
- HAMMERMANN R., BLIESENER N., MÖSSNER J., KLASEN S., WIESINGER H., WESSLER I., RACKÉ K. Inability of rat alveolar macrophages to recycle L-citrulline to L-arginine despite induction of argininosuccinate synthetase mRNA and protein, and inhibition of nitric oxide synthesis by exogenous L-citrulline. Naunyn-Schmiedeberg's Arch. Pharmacol. 1998;358:601–607. doi: 10.1007/pl00005300. [DOI] [PubMed] [Google Scholar]
- HAMMERMANN R., MESSERI DREIßIG M.D., MÖSSNER J., FUHRMANN M., BERRINO L., GÖTHERT M., RACKÉ K. Nuclear factor-κB mediates simultaneously induction of iNOS and upregulation of the cationic amino acid transporter CAT-2B in rat alveolar macrophages. Mol. Pharmacol. 2000;58:1294–1302. [PubMed] [Google Scholar]
- HARAGUCHI Y., TAKIGUCHI M., AMAYA Y., KAWAMOTO S., MATSUDA I., MORI M. Molecular cloning and nucleotide sequence of cDNA for human liver arginase. Proc. Natl. Acad. Sci. U.S.A. 1987;84:412–415. doi: 10.1073/pnas.84.2.412. [DOI] [PMC free article] [PubMed] [Google Scholar]
- HECKER M., NEMATOLLAHI H., HEY C., BUSSE R., RACKÉ K. Inhibition of arginase by NG-hydroxy-L-arginine in alveolar macrophages: implications for the utilization of L-arginine for nitric oxide synthesis. FEBS Lett. 1995;359:251–254. doi: 10.1016/0014-5793(95)00039-c. [DOI] [PubMed] [Google Scholar]
- HEY C., BOUCHER J.L., VERDON-LE GOFF F.V.L., KETTERER G., WESSLER I., RACKÉ K. Inhibition of arginase in rat and rabbit alveolar macrophages by Nω-hydroxy-D,L-indospicine, effects on L-arginine utilization by nitric oxide synthase. Br. J. Pharmacol. 1997;121:395–400. doi: 10.1038/sj.bjp.0701143. [DOI] [PMC free article] [PubMed] [Google Scholar]
- HEY C., WESSLER I., RACKÉ K. Nitric oxide synthase activity is inducible in rat, but not rabbit alveolar macrophages, with a concomitant reduction in arginase activity. Naunyn-Schmiedeberg's Arch. Pharmacol. 1995;351:651–659. doi: 10.1007/BF00170166. [DOI] [PubMed] [Google Scholar]
- HOFMANN T.G., HEHNER S.P., BACHER S., DROGE W., SCHMITZ M.L. Various glucocorticoids differ in their ability to induce gene expression, apoptosis and to repress NF-kappaB-dependent transcription. FEBS Lett. 1998;441:441–446. doi: 10.1016/s0014-5793(98)01609-3. [DOI] [PubMed] [Google Scholar]
- IYER R.K., BANDO J.M., JENKINSON C.P., VOCKLEY J.G., KIM P.S., KERN R.M., CEDERBAUM S.D., GRODY W.W. Cloning and characterization of the mouse and rat type II arginase genes. Mol. Genet. Metab. 1998;63:168–175. doi: 10.1006/mgme.1997.2669. [DOI] [PubMed] [Google Scholar]
- JENKINSON C.P., GRODY W.W., CEDERBAUM S.D. Comparative properties of arginases. Comp. Biochem. Physiol. 1996;114B:107–132. doi: 10.1016/0305-0491(95)02138-8. [DOI] [PubMed] [Google Scholar]
- JORENS P.G., VAN OVERFELD F.J., BULT H., VERMEIRE P.A., HERMAN A.G. L-Arginine-dependent production of nitrogen oxides by rat pulmonary macrophages. Eur. J. Pharmacol. 1991;200:205–209. doi: 10.1016/0014-2999(91)90573-9. [DOI] [PubMed] [Google Scholar]
- KAWAMOTO S., AMAYA Y., MURAKAMI K., TOKUNAGA F., IWANAGA S., KOBAYASHI K., SAHEKI T., KIMURA S., MORI M. Complete nucleotide sequence of cDNA and deduced amino acid sequence of rat liver arginase. J. Biol. Chem. 1987;262:6280–6283. [PubMed] [Google Scholar]
- KIM H., LEE H.S., CHANG K.T., KO T.H., BAEK K.J., KWON N.S. Chloromethyl ketones block induction of nitric oxide synthase in murine macrophages by preventing activation of nuclear factor-κB. J. Immunol. 1995;154:4741–4748. [PubMed] [Google Scholar]
- KUNZ D., WALKER G., EBERHARDT W., PFEILSCHIFTER J. Molecular mechanisms of dexamethasone inhibition of nitric oxide synthase expression in interleukin 1 beta-stimulated mesangial cells: evidence for the involvement of transcriptional and posttranscriptional regulation. Proc. Natl. Acad. Sci. U.S.A. 1996;93:255–259. doi: 10.1073/pnas.93.1.255. [DOI] [PMC free article] [PubMed] [Google Scholar]
- LOUIS C.A., REICHNER J.S., HENRY W.L., JR, MASTROFRANCESCO B., GOTOH T., MORI M., ALBINA J.E. Distinct arginase isoforms expressed in primary and transformed macrophages: regulation by oxygen tension. Am. J. Physiol. 1998;274:R775–R782. doi: 10.1152/ajpregu.1998.274.3.R775. [DOI] [PubMed] [Google Scholar]
- MEURS H., HAMER M.A., PETHE S., VADON-LE GOFF S., BOUCHER J.L., ZAAGSMA J. Modulation of cholinergic airway reactivity and nitric oxide production by endogenous arginase activity. Br. J. Pharmacol. 2000;130:1793–1798. doi: 10.1038/sj.bjp.0703488. [DOI] [PMC free article] [PubMed] [Google Scholar]
- MODOLELL M., CORRALIZA I.M., LINK F., SOLER G., EICHMANN K. Reciprocal regulation of the nitric oxide synthase/arginase balance in mouse bone marrow-derived macrophages by TH1 and TH2 cytokines. Eur. J. Immunol. 1995;25:1101–1104. doi: 10.1002/eji.1830250436. [DOI] [PubMed] [Google Scholar]
- MORRIS S.M., JR, BHAMIDIPATI D., KEPKA-LENHART D. Human type II arginase: sequence analysis and tissue-specific expression. Gene. 1997;193:157–161. doi: 10.1016/s0378-1119(97)00099-1. [DOI] [PubMed] [Google Scholar]
- MORRIS S.M., JR, KEPKA-LENHART D., CHEN L.C. Differential regulation of arginases and inducible nitric oxide synthase in murine macrophage cells. Am. J. Physiol. 1998;275:E740–E747. doi: 10.1152/ajpendo.1998.275.5.E740. [DOI] [PubMed] [Google Scholar]
- NEBES V.L., MORRIS S.M., JR Regulation of messenger ribonucleic acid levels for five urea cycle enzymes in cultured rat hepatocytes. Requirements for cyclic adenosine monophosphate, glucocorticoids, and ongoing protein synthesis. Mol. Endocrinol. 1988;2:444–451. doi: 10.1210/mend-2-5-444. [DOI] [PubMed] [Google Scholar]
- NISHIYORI A., TASHIRO H., KIMURA A., AKAGI K., YAMAMURA K., MORI M., TAKIGUCHI M. Determination of tissue specificity of the enhancer by combinatorial operation of tissue-enriched transcription factors. Both HNF-4 and C/EBP beta are required for liver-specific activity of the ornithine transcarbamylase enhancer. J. Biol. Chem. 1994;269:1323–1331. [PubMed] [Google Scholar]
- RACKÉ K., HEY C., MÖSSNER J., HAMMERMANN R., STICHNOTE C., WESSLER I. Activation of L-arginine transport by protein kinase C in rabbit, rat and mouse alveolar macrophages. J. Physiol. 1998;511:813–825. doi: 10.1111/j.1469-7793.1998.813bg.x. [DOI] [PMC free article] [PubMed] [Google Scholar]
- SHERMAN M.P., AEBERHARD E.E., WONG V.Z., GRISCAVAGE J.M., IGNARRO L.J. Pyrrolidine dithiocarbamate inhibits induction of nitric oxide synthase activity in rat alveolar macrophages. Biochem. Biophys. Res. Commun. 1993;191:1301–1308. doi: 10.1006/bbrc.1993.1359. [DOI] [PubMed] [Google Scholar]
- SONOKI T., NAGASAKI A., GOTOH T., TAKIGUCHI M., TAKEYA M., MATSUZAKI H., MORI M. Coinduction of nitric-oxide synthase and arginase I in cultured rat peritoneal macrophages and rat tissues in vivo by lipopolysaccharide. J. Biol. Chem. 1997;272:3689–3693. doi: 10.1074/jbc.272.6.3689. [DOI] [PubMed] [Google Scholar]
- TENU J.P., LEPOIVRE M., MOALI C., BROLLO M., MANSUY D., BOUCHER J.L. Effects of the new arginase inhibitor Nω-hydroxy-nor-L-arginine on NO synthase activity in murine macrophages. Nitric Oxide. 1999;3:427–438. doi: 10.1006/niox.1999.0255. [DOI] [PubMed] [Google Scholar]
- VAN OOIJ C., SNYDER R.C., PAEPER B.W., DUESTER G. Temporal expression of the human alcohol dehydrogenase gene family during liver development correlates with differential promoter activation by hepatocyte nuclear factor 1, CCAAT/enhancer-binding protein alpha, liver activator protein, and D-element-binding protein. Mol. Cell Biol. 1992;12:3023–3031. doi: 10.1128/mcb.12.7.3023. [DOI] [PMC free article] [PubMed] [Google Scholar]
- VAYSSIERE B.M., DUPONT S., CHOQUART A., PETIT F., GARCIA T., MARCHANDEAU C., GRONEMEYER H., RESCHE-RIGON M. Synthetic glucocorticoids that dissociate transactivation and AP-1 transrepression exhibit antiinflammatory activity in vivo. Mol. Endocrinol. 1997;11:1245–1255. doi: 10.1210/mend.11.9.9979. [DOI] [PubMed] [Google Scholar]
- VOCKLEY J.G., JENKINSON C.P., SHUKLA H., KERN R.M., GRODY W.W., CEDERBAUM S.D. Cloning and characterization of the human type II arginase gene. Genomics. 1996;38:118–123. doi: 10.1006/geno.1996.0606. [DOI] [PubMed] [Google Scholar]
- WADDINGTON S.N., MOSLEY K., COOK H.T., TAM F.W., CATTELL V. Arginase AI is upregulated in acute immune complex-induced inflammation. Biochem. Biophys. Res. Commun. 1998;247:84–87. doi: 10.1006/bbrc.1998.8755. [DOI] [PubMed] [Google Scholar]
- WALKER G., PFEILSCHIFTER J., KUNZ D. Mechanisms of suppression of inducible nitric-oxide synthase (iNOS) expression in interferon (IFN)-gamma-stimulated RAW 264.7 cells by dexamethasone. Evidence for glucocorticoid-induced degradation of iNOS protein by calpain as a key step in post-transcriptional regulation. J. Biol. Chem. 1997;272:16679–16687. doi: 10.1074/jbc.272.26.16679. [DOI] [PubMed] [Google Scholar]
- WANG W.W., JENKINSON C.P., GRISCAVAGE J.M., KERN R.M., ARABOLOS N.S., BYRNS R.E., CEDERBAUM S.D., IGNARRO L.J. Co-induction of arginase and nitric oxide synthase in murine macrophages activated by lipopolysaccharide. Biochem. Biophys. Res. Commun. 1995;210:1009–1016. doi: 10.1006/bbrc.1995.1757. [DOI] [PubMed] [Google Scholar]
- WEI L.H., JACOBS A.T., MORRIS S.M., JR, IGNARRO L.J. IL-4 and IL-13 upregulate arginase I expression by cAMP and JAK/STAT6 pathways in vascular smooth muscle cells. Am. J. Physiol. 2000;279:C248–C256. doi: 10.1152/ajpcell.2000.279.1.C248. [DOI] [PubMed] [Google Scholar]
- WU G., MORRIS S.M., JR Arginine metabolism: nitric oxide and beyond. Biochem. J. 1998;336:1–17. doi: 10.1042/bj3360001. [DOI] [PMC free article] [PubMed] [Google Scholar]
- XIE Q.W., NATHAN C.J. The high-output nitric oxide pathway: role and regulation. Leukocyte Biol. 1994;56:576–582. doi: 10.1002/jlb.56.5.576. [DOI] [PubMed] [Google Scholar]


