

Abstract
The purpose of this study was to compare oocytes from the pipid frogs Xenopus tropicalis and Xenopus laevis, with respect to their utility for studying Ca2+ signalling mechanisms and for expression of heterologous proteins.
We show that X. tropicalis oocytes possess an intracellular Ca2+ store that is mobilized by inositol (1,4,5) trisphosphate (IP3). Ca2+ signalling is activated by endogenous lysophosphatidic acid receptors and cytosolic Ca2+ activates a plasma membrane chloride conductance. The spatiotemporal organization of cytosolic Ca2+ signals, from the microscopic architecture of elementary Ca2+ ‘puffs' to the macroscopic patterns of Ca2+ spiking are closely similar to the local and global patterns of Ca2+ release previously characterized in oocytes from X. laevis.
By injecting X. tropicalis oocytes with cDNA encoding an ER-targeted fluorescent protein construct, we demonstrate the capacity of the X. tropicalis oocyte to readily express heterologous proteins. The organization of ER is polarized across the oocyte, with the IP3-releaseable store targeted within an ∼8 μm wide band that circumscribes the cell.
We conclude that the X. tropicalis oocyte shares many of the characteristics that have made oocytes of X. laevis a favoured system for studying Ca2+ signalling mechanisms. Moreover, X. tropicalis oocytes display further practical advantages in terms of imaging depth, Ca2+ signal magnitude and electrical properties. These further enhance the appeal of X. tropicalis as an experimental system, in addition to its greater amenability to transgenic approaches.
Keywords: Xenopus; oocyte; inositol 1,4,5 trisphosphate; endoplasmic reticulum; Ca2+ wave
Introduction
The experimental tractability and robustness of Xenopus oocytes, embryos and adult frogs has catalysed the adoption of Xenopus laevis – initially used as a screening mechanism for human pregnancy testing in the 1950s – into a stalwart vertebrate model system for studying gene function, embryology and development (Kay & Peng, 1991; Guille, 1999). From the perspective of molecular pharmacology alone, the utility of the X. laevis oocyte as a heterologous expression system for studying protein function has provided seminal insights for understanding receptor biochemistry and signal transduction mechanisms over the last two decades (Gundersen et al., 1984; Dascal, 1987; Theodoulou & Miller, 1995; Nakamura et al., 1999). This capacity to efficiently translate and express exogenous genetic material (Gurdon et al., 1971), coupled with the amenability of the giant oocyte cell for application of electrophysiology, microscopy and biochemistry, provides compelling advantages for using X. laevis oocytes as an expression system to study protein function.
A major disadvantage of X. laevis, however, has been the difficulty of enhancing experimental investigations with transgenic approaches. Despite advances in establishing transgenic methodologies for producing stable, non-mosaic expression of cloned genes in Xenopus (Kroll & Amaya, 1996), studies are hampered by both the allotetraploid origin of X. laevis (Kobel & Du Pasquier, 1986), and by the long generation time of the species – females taking up to 2 years to reach sexual maturity. For these reasons, efforts have focused on a close relative – X. tropicalis – as a surrogate system more amenable to transgenic technology (Amaya et al., 1998). X. tropicalis is unique among the Xenopus genus in possessing a diploid genome (Kobel & Du Pasquier, 1986), and it exhibits a much shorter generation time (∼4 months), thereby facilitating multigeneration analyses.
However, in assessing the feasibility of X. tropicalis as an alternative system for experimental studies, it is important to characterize the extent of interchangeability with X. laevis with respect to a variety of experimental systems. In this regard, our laboratory has employed X. laevis oocytes for many years as a model system for heterologous protein expression, and for studying intracellular Ca2+ signalling mechanisms. Several properties of the X. laevis oocyte facilitate such studies; including the presence of the IP3 receptor as the sole pathway for intracellular Ca2+ release (Parys et al., 1992; Kume et al., 1993), the utility of Ca2+-activated chloride channels in the plasma membrane as an endogenous readout of intracellular Ca2+ concentration (Miledi & Parker, 1984), the capacity to heterologously express proteins that modulate Ca2+ handling (Lechleiter et al., 1991; Camacho & Lechleiter, 1993; DeLisle et al., 1996), the biochemical similarity of the X. laevis IP3 receptor to its mammalian counterpart (Parys et al., 1992; Parys & Bezprozvanny, 1995), and the ease of imaging and triggering a variety of spatiotemporal patterns of Ca2+ release in this giant cell (Lechleiter & Clapham, 1992; Parker et al., 1996). Indeed, the X. laevis oocyte is regarded as the best characterized cell system for studying intracellular Ca2+ waves (Ponce Dawson et al., 1999). IP3 establishes beautiful patterns of repetitive Ca2+ spiking, stable for many minutes, where repetitive Ca2+ waves propagate through the cytoplasm with a frequency dependent on the intensity of stimulation. Furthermore, the macroscopic organization of these cellular Ca2+ signals is generated through the coordination of a subcellular architecture of transient, spatially restricted Ca2+ release events, christened Ca2+ ‘puffs' (Parker & Yao, 1991), which serve as the basic building blocks from which global Ca2+ signals are constructed in many cell types (Bootman & Berridge, 1995; Parker et al., 1996; Berridge, 1997).
In this study, we have assessed the potential of X. tropicalis oocytes as an alternative system for physiological studies of cellular Ca2+ signalling and for expression of exogenous proteins. We find that the physiological and pharmacological properties of the X. tropicalis oocyte closely resemble the X. laevis oocyte, thus facilitating comparison of data obtained using the two systems. Moreover, in several respects, the X. tropicalis oocyte appears better suited for physiological and pharmacological investigations; further enhancing its appeal in addition to its superiority for application of transgenic techniques.
Methods
Procurement and microinjection of Xenopus tropicalis oocytes
Female adult X. tropicalis frogs (4 – 6 cm in length) were obtained from Xenopus Express (Homosassa, FL, U.S.A.) and housed at 24°C in salt-supplemented (1 g rock salt l−1), filtered water (pH ∼5.9), which was half-replaced twice weekly. Although the precise phylogenetic classification of X. tropicalis is debated (Cannatella & Trueb, 1988), we choose for simplicity to refer to the pipid frog as X. tropicalis throughout. X. laevis frogs, also obtained from Xenopus Express, were housed at 18 – 22°C. Frogs from both species were anaesthetized by immersion in 0.1% aqueous solution of MS-222 (3-aminobenzoic acid ethyl ester, Sigma A5040) for 15 min, and subsequently, after sacrifice by decapitation, whole ovaries were removed by surgery. Oocytes of Dumont Stage V – VI (Dumont, 1972) were selected and epithelial layers removed manually using watchmakers' forceps. These oocytes were then subjected to treatment with collagenase (Sigma type I, at 0.5 mg ml−1 for 30 min) in dissociation solution (mM: NaCl 82.5, KCl 2.5, Na2HPO4 10, HEPES 5; pH 7.8) to ensure complete defollication. Oocytes were subsequently left to recover for 24 h before being used in experiments.
For expression studies, plasmid DNA (∼2 μg) encoding either enhanced yellow fluorescent protein (EYFP)-tagged human cytoplasmic β-actin (EYFP-actin) or an endoplasmic reticulum-targeted EYFP (EYFP-ER) was injected using a Drummond microinjector into the animal pole of both X. tropicalis and X. laevis oocytes procured on the same day. Injected oocytes were separated individually into 96-well plates and incubated in Barth's solution (mM: NaCl 88, KCl 1, NaHCO3 2.4, MgSO4 0.83, Ca(NO3)2 0.33, CaCl2 0.41, HEPES 10; Na pyruvate 550 mg l−1; gentamycin 0.05 mg ml−1; pH 7.4 at 18°C), with repeated changes of solution, at least every 12 h. Additional oocytes from the same donor frogs were mock injected with ∼5 nl of intracellular solution (mM: KCl 140, HEPES 10, MgCl2 3, EGTA 1, CaCl2 0.5, pH 7.3) and maintained as parallel controls for viability and expression.
For confocal Ca2+ imaging experiments, defolliculated oocytes were microinjected 45 min prior to imaging with a fluorescent Ca2+ indicator, either Oregon green 488 BAPTA-1 (KD for Ca2+ ∼170 nM) or Oregon green 488 BAPTA-5N (KD for Ca2+ ∼20 μM), together with a caged compound, either caged myo-inositol 1,4,5-trisphosphate (IP3; Walker et al., 1987), caged cyclic ADP-ribose phosphate (cADPR; Aarhus et al., 1995) or caged nicotinic acid adenine dinucleotide phosphate (NAADP; Lee et al., 1997). Assuming dilution through a cytosolic volume of ∼0.2 μl (X. tropicalis) or ∼1 μl (X. laevis), the final intracellular concentrations of fluorescent indicator and caged compound were 40 and 5 μM respectively.
Confocal imaging and electrophysiology
Fluorescence images of EYFP distribution were obtained using a custom-built laser scanning confocal microscope (Parker et al., 1997), based upon an Olympus IX70 inverted microscope fitted with a 40×oil-immersion objective. Fluorescence was excited using the 488 nm line from an argon ion laser, and monitored at λ >530 nm. Images were formed scanning either laterally (x – y) or axially (x – z) within the oocyte. Autofluorescence (monitored in control oocytes) was negligible (<2%) in comparison to cells expressing EYFP. All measurements of EYFP fluorescence were averaged from multiple scans in >3 oocytes from each of three discrete donor frogs and results are presented as mean±s.e.mean.
Confocal Ca2+ imaging was performed using the microscope in line-scan mode (Parker et al., 1997), together with flash photolysis of caged compounds. Flashes of u.v. light (340 – 400 nm) of defined duration and intensity were generated using a mercury arc lamp, an electronically controlled shutter and neutral density wheels. The u.v. photolysis light was focused concentrically around the laser scan line, throughout a uniform circular area of ∼150 μm diameter. Ca2+ dependent fluorescent signals at the laser scan line (excitation λ=488 nm) were long pass filtered at λ >510 nm, and monitored at a confocal pinhole using an avalanche diode photon counting module (Parker et al., 1997). Unless stated, Ca2+ images were obtained with the scan line focused at a depth of ∼5 – 10 μm into the oocyte within a region of the oocyte cortex enriched in endoplasmic reticulum (see below). Fluorescence signals are expressed as ratios (ΔF/F0) of the change in fluorescence at each pixel during a response (ΔF) relative to the resting fluorescence at that pixel before stimulation (F0), with increasing fluorescence emission depicted as a pseudocolour representation. Calculation of the ‘signal mass' associated with elementary Ca2+ release events was performed using an algorithm described fully elsewhere (Sun et al., 1998). Images were processed using routines written within the IDL programming environment (Research Systems Inc., CO, U.S.A.). As with measurements of EYFP fluorescence, all recordings were made at room temperature, with oocytes bathed in Ringer's solution (mM: NaCl 120, KCl 2, CaCl2 1.8, HEPES 5, pH 7.4) or, where specified, Ca2+-free Ringer's solution (mM: NaCl 120, KCl 2, MgCl2 5, EGTA 1, HEPES 5, pH 7.4).
Recordings of Ca2+-activated chloride currents evoked by photorelease of IP3 were made from oocytes injected with caged IP3 alone (5 μM), using a two-electrode voltage clamp (GeneClamp 500, Axon Instruments) as described previously (Callamaras & Parker, 2000) with KCl-filled microelectrodes broken to resistances between 1 – 3 MΩ.
Fractionation of oocytes and immunoblot analysis
Crude membrane extracts from X. tropicalis and X. laevis oocytes were prepared for immunoblotting analyses using a protocol modified from Callamaras & Parker (1994). Briefly, 30 oocytes were homogenized using a hand-held homogenizer in 1.5 ml of ice-cold homogenization solution (mM: KCl 50, Tris/HCl 20, magnesium acetate 10, 2-mercaptoethanol 6, EGTA 1, PMSF 0.5, and leupeptin 10 μM, pepstatin A 1 μM). The homogenate was centrifuged at 2°C for 5 min at 1500×g and the supernatant spun at 24,000×g for 90 min to pellet a crude oocyte membrane fraction. Membranes from rat cerebellum, used for comparative purposes, were prepared as described previously (Marchant et al., 1997). Membrane fractions were analysed by SDS – PAGE electrophoresis (5% gel, ∼20 μg of protein per 30 μl well) and subsequently transferred to PVDF membrane (50 V for 12 h, 2°C) using a wet-tank transfer system and blocked overnight at 4°C in phosphate-buffered saline (PBS) containing 5% powdered milk. The membranes were washed several times (PBS, supplemented with 0.02% Tween) and subsequently probed with primary antiserum (diluted 1 : 1000 in PBS with 2.5% powdered milk for 2 h at room temperature) and, after further washing, a secondary anti-rabbit antibody coupled to horseradish peroxidase (Amersham, diluted 2000 fold in PBS containing 2.5% powdered milk). The results were visualized using an enhanced chemiluminescence system (Amersham, IL, U.S.A.).
Materials
Fluorescent Ca2+ indicators, caged IP3, caged NAADP and caged cADPR were from Molecular Probes (Eugene, OR, U.S.A.). The ER-targeted EYFP construct and the actin-EYFP plasmid were from Clontech (No. 6906-1 and No. 6902-1 respectively). Anti-IP3 receptor antibody, raised against C-terminal residues within the rat cerebellar IP3 receptor (Cardy et al., 1997) was a generous gift from Dr Colin Taylor (University of Cambridge, U.K.). High molecular mass markers were from Amersham (No. RPN800, IL, U.S.A.). All other reagents were from Sigma Chemical Company (St. Louis, MO, U.S.A.).
Results
Expression of an endoplasmic reticulum-targeted EYFP vector in X. tropicalis oocytes
To determine the morphology of the endoplasmic reticulum (ER) in X. tropicalis oocytes, and to assess the suitability of these cells as an expression system for heterologous proteins, we performed nuclear injections of a plasmid encoding an EYFP construct targeted to the ER. Despite the much smaller size of adult X. tropicalis (∼4 – 6 cm in length) compared with the adult X. laevis (∼10 cm in length), the gross morphology of oocytes from either species is similar (Figure 1A). Notably, stage VI X. tropicalis oocytes are comparatively large (<0.7 mm in diameter, Figure 1A) in relation to the body size of the adult animal, making microinjection procedures trivial. By monitoring fluorescence intensity (>530 nm) from the pigmented animal pole of the oocyte, expression of EYFP was evident in some X. tropicalis oocytes within 24 h from injection of the plasmid, and the number of cells expressing the construct increased to a maximum by 48 h (Figure 1B). Although the timecourse of fluorescence expression was faster in X. tropicalis than X. laevis, the final proportion of X. tropicalis oocytes expressing the construct was similar to the total number of X. laevis oocytes scored positive for EYFP fluorescence from a batch of cells microinjected in parallel (Figure 1B). A more rapid timecourse was also obtained in X. tropicalis oocytes for expression of an EYFP-tagged actin construct (data not shown).
Figure 1.
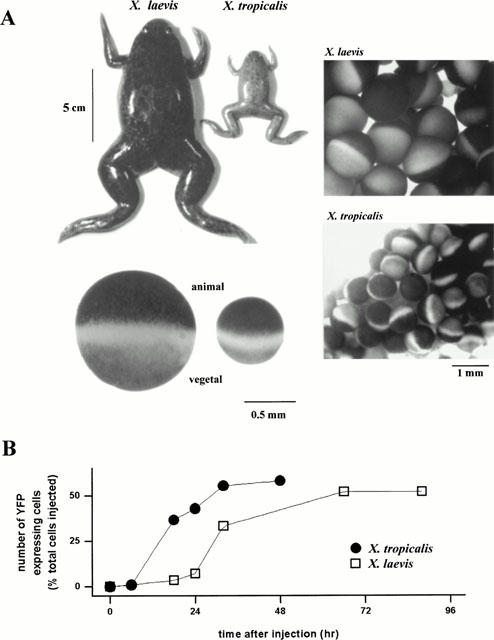
Morphological comparison between Xenopus laevis and Xenopus tropicalis and expression timecourse of an endoplasmic reticulum-targeted plasmid. (A) Photographic comparison of the sizes of adult X. tropicalis and X. laevis female frogs (top), a section from their ovarian lobes (right), and the appearance of their pigmented oocytes after defolliculation (bottom). (B) Timecourse of EYFP-ER expression after parallel nuclear injections of ∼5 nl of plasmid (200 μg ml−1) into oocytes from X. laevis and X. tropicalis. Batches of 50 oocytes from both donor frogs were injected in succession and individual oocytes screened at subsequent timepoints for EYFP fluorescence, together with a control batch of oocytes from each donor injected with intracellular solution alone. EYFP was visualized using the 488 nm line of an argon ion laser, with emitted fluorescence long pass filtered at λ>530 nm.
Morphology of the endoplasmic reticulum in X. tropicalis oocytes
To compare the distribution of ER within the X. tropicalis oocyte, confocal images were obtained by axial (x – z) scanning into the animal and vegetal hemispheres of oocytes expressing the ER targeted EYFP-construct. In both hemispheres of the oocyte, a band of fluorescence, corresponding to peripheral ER was evident, although the fluorescent signal was considerably brighter and more extensive in the animal hemisphere (Figure 2A). Comparison of paired x – z sections, collected at the same laser power within the same oocyte revealed that the peak fluorescence signal was typically three times as bright (309±33%, n>3 scans in a minimum of three oocytes from a total of >3 donor animals) and the integral of the fluorescence signal five times larger (499±39%) in the animal compared to the vegetal hemisphere (Figure 2A). Furthermore, fluorescence signals could be resolved considerably deeper into the animal hemisphere compared with the vegetal hemisphere in each X. tropicalis oocyte tested (Figure 2A, 15.0±1.5 μm compared to 6.8±1.0 μm, full width at half maximal fluorescence intensity (FWHM) of profile, respectively).
Figure 2.
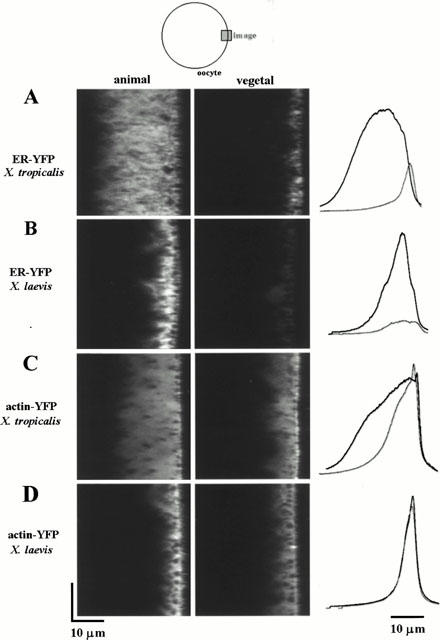
Asymmetric distribution of ER in the Xenopus tropicalis oocyte. (A) Radial (x – z) images of fluorescence intensity with depth (40 μm) in the animal and vegetal hemispheres of the same X. tropicalis oocyte taken 48 h after nuclear injection. The oocyte surface is near the right of each image frame, and the interior of the oocyte is to the left as shown in the schematic. Line profiles (traces at right) represent the fluorescence intensity averaged across the entire 50 μm laser scan line in the animal (black line) and in the vegetal hemisphere (gray line) relative to the depth of the most superficial fluorescence, averaged between >10 oocytes scored positive for EYFP fluorescence. The cross-sectional area of the fluorescent signal (area under the curve) was estimated by integration. In control oocytes, injected with intracellular solution alone, auto-fluorescence signals were less than 2% of the peak fluorescence signal in EYFP-expressing cells. (B) Analogous x – z scans in the animal and vegetal hemispheres of a X. laevis oocyte. (C) Images (x – z) from a X. tropicalis oocyte, 48 hrs after nuclear injection of a plasmid encoding an EYFP-tagged human cytoplasmic β-actin construct. (D) Analogous x – z scans in the animal and vegetal hemispheres of a X. laevis oocyte expressing the EYFP-tagged human cytoplasmic β-actin construct.
Parallel injections using X. laevis oocytes, revealed a different distribution of EYFP-ER expression (Figure 2B). Most notably, fluorescence could not be resolved as deep within the animal hemisphere of X. laevis oocytes (8.0±0.4 μm; FWHM) compared to X. tropicalis oocytes (Figure 2A, c.f. Figure 2B). However, in X. laevis, the peak fluorescence signal in the animal hemisphere was 761±131% of that in the vegetal pole (n>3 scans from ⩾3 oocytes from a total of three donor animals), such that the cross-sectional area of the fluorescence signal was similarly five times larger (500±72%) in the animal compared to the vegetal hemisphere as with X. tropicalis (Figure 2B).
The depth of resolution of EYFP-ER fluorescence within the animal hemisphere of the X. tropicalis oocyte was noteworthy, as the turbidity of the oocyte cytoplasm normally limits visibility to within 10 – 15 μm in uncleared oocytes (Callamaras & Parker, 1999). In X. tropicalis oocytes, the depth of resolution into the animal hemisphere was ∼2.2 fold (ratio of FWHMs) greater than in the vegetal hemisphere compared to an equal ratio in depth of resolution in X. laevis oocytes (8.0±0.4 μm in the animal hemisphere c.f. 7.7±0.4 μm in the vegetal hemisphere).
This difference was also seen with other constructs – for example in oocytes expressing an EYFP-actin construct (Figure 2C,D), structure could again be resolved considerably deeper into the animal hemisphere of X. tropicalis oocytes (17.2±1.7 μm FWHM) compared to X. laevis oocytes (6.7±0.51 μm FWHM). Again the depth of resolution into the animal hemisphere of X. tropicalis was ∼2.4 fold that in the vegetal hemisphere of the same cell, compared to a ratio of unity in X. laevis, even though the peak fluorescence intensity was similar in both hemispheres of each oocyte (Figure 2C,D: animal hemisphere 127±17% c.f. vegetal in X. tropicalis, n=8 cells, animal hemisphere 147±5% c.f. vegetal in X. laevis, n=6 cells).
To resolve the morphology of the ER at various depths into the cell, lateral (x – y) images were collected at confocal planes throughout the ∼25 μm resolvable imaging depth into the animal pole of X. tropicalis oocytes (Figure 3). Fluorescence appeared at a level coincident with the cortical granules, around which the ER formed an interconnected network (Figure 3A). An enlarged view of the morphology of the ER at this depth (Figure 3B), revealed a tubular organization with dimensions comparable to those reported for ER cisternae in X. laevis (e.g. Charbonneau & Grey, 1984; Campanella et al., 1984). More distally, as shown by the axial stack of x – y images in Figure 3C, individual tubules became less discernable and the fluorescence signal more diffuse, although regional heterogeneities were still apparent at depths up to 25 μm inward from the cortical granules.
Figure 3.
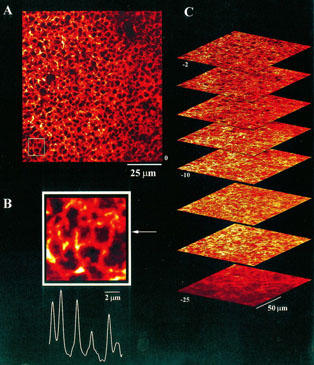
Expression of EYFP-ER in Xenopus tropicalis oocytes. Confocal (x – y) images collected at various focal depths into the animal hemisphere of a X. tropicalis oocyte 48 h after nuclear injection of a plasmid encoding a EYFP-ER construct. (A) Image collected with the microscope focused at the level of the cortical granules approximately 5 μm from the plasma membrane. (B) Enlargement of the indicated section from ‘A' together with a fluorescence intensity profile as measured as indicated by the arrow along a 3-pixel wide line. (C) An image stack of eight (x – y) images collected at increasing focal depths into the animal hemisphere, at 2 μm then 5 μm increments further into the cell, numbered relative to the level of the pigment granules (‘0'). Sequence starts 2 μm inward from the pigment granules.
Pharmacological properties of the ER Ca2+ store in X. tropicalis oocytes
Cell surface agonists mobilize intracellular Ca2+ by coupling to three discrete pathways. The second messengers IP3 (Streb et al., 1983) and cADPR (Galione, 1993) stimulate Ca2+ release through IP3 receptors and ryanodine receptors respectively, while NAADP stimulates intracellular Ca2+ mobilization through a mechanism independent of IP3 receptors and ryanodine receptors (Genazzani & Galione, 1997). Many cell types employ more than one of these mechanisms to release intracellular Ca2+ and the respective contributions of each can be assessed by exploiting the differential pharmacology of each pathway (Genazzani & Galione, 1997; Taylor & Broad, 1998).
X. laevis oocytes possess solely an IP3-dependent Ca2+ release pathway, as demonstrated by the absence of ryanodine binding activity (Parys et al., 1992), the absence of immunoreactivity to a variety of ryanodine receptor antibodies (Parys et al., 1992), as well as the lack of functional responses to caffeine and ryanodine at concentrations that stimulate Ca2+ release through ryanodine receptors (Parker & Ivorra, 1991; Parys et al., 1992; Kobrinsky et al., 1995). This characteristic greatly simplifies the use of the X. laevis oocyte both as a model system for studying IP3-dependent processes (Lechleiter et al., 1991; DeLisle et al., 1996), and as a null-background system for studying expression of other intracellular Ca2+ release mechanisms (Kobrinsky et al., 1995). To ascertain whether the pharmacological properties of the intracellular Ca2+ store within X. tropicalis oocytes were similar, we tested a variety of agonists known to trigger specific intracellular Ca2+ release mechanisms, and immunologically probed for IP3 receptors.
The pharmacological characteristics of the ER Ca2+ store in X. tropicalis oocytes were investigated by photorelease of caged compounds previously microinjected (5 μM, final concentration of each compound) into cells together with Oregon-green BAPTA-5N (40 μM, final concentration). Photorelease of saturating concentrations of IP3 evoked a Ca2+ wave across the entire 100 μm scan line within less than 100 ms, with a greater peak signal in the animal hemisphere (ΔF/F0=3.3±0.1, n=18 cells, five donors) than in the vegetal hemisphere (ΔF/F0=2.93±0.4, n=21 cells, five donors). Photorelease of either cADPR (Galione, 1993) or NAADP (Genazzani & Galione, 1997) failed to evoke detectable Ca2+ release, even at intensities of photostimulation up to 100 fold higher than those evoking IP3-dependent Ca2+ signals (Figure 4A). This pharmacological profile was identical to that recorded in X. laevis oocytes (Figure 4B). In non-mammalian systems where cADPR and NAADP release intracellular Ca2+, the effective concentration range of these compounds is typically ∼10 fold lower than for IP3 (Galione, 1993; Genazzani & Galione, 1997). Consistent with this, control experiments using sea urchin eggs microinjected with caged cADPR demonstrated a release of intracellular Ca2+ at much lower photolysis intensities than employed in oocytes (data not shown). Further, the amplitudes of Ca2+ waves in X. tropicalis oocytes microinjected with both caged cADPR and caged IP3 (ΔF/F0=2.9±0.2, n=10 oocytes), or caged NAADP and caged IP3 (ΔF/F0=2.7±0.6), were identical to that recorded in oocytes microinjected with caged IP3 alone (ΔF/F0=2.5±0.6), suggesting no potentiating effect of these compounds on IP3 dependent Ca2+ signals.
Figure 4.
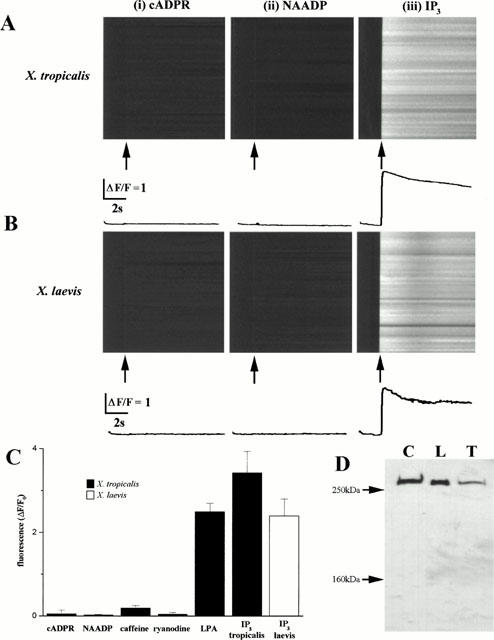
Xenopus tropicalis oocytes contain solely an IP3-sensitive Ca2+ store. (A) Confocal linescan images showing the fluorescence change along a 100 μm scan line imaged using the low affinity Ca2+ indicator Oregon-green 5N after photoreleasing (i) cADPR, (ii) NAADP or (iii) IP3. The photolysis flash was delivered when indicated by the arrow, and was of the same intensity and duration. Images are representative of results from >10 X. tropicalis oocytes from at least three different donors, all microinjected with the same concentration of caged compound. Oocytes that were not responsive to cADPR and NAADP were shown to be viable, because photolysis flashes evoked Ca2+ release after the cells were subsequently injected with caged IP3 (data not shown). Accompanying traces represent the fluorescence profile, averaged across the entire 100 μm scan line during the period of photorelease. (B) Comparable experiments, performed using X. laevis oocytes. (C) Measurements of average peak fluorescence change from experiments such as those in (A) and (B), evoked by photorelease of saturating concentrations of caged IP3 (final intracellular concentration ∼5 μM), caged cyclic ADP ribose (∼5 μM), and caged NAADP (∼5 μM), and by bath application of LPA (1 μM), caffeine (10 mM) and ryanodine (5 μM). Filled bars show measurements in X. tropicalis oocytes. The open bar shows, for comparison, responses evoked by photoreleased IP3 in X. laevis oocytes. (D) Immunological identification of IP3 receptors in X. tropicalis oocytes. Lanes were loaded with 30 μg total protein from crude membrane preparations of rat cerebellum (‘C'), 50 oocytes of X. laevis (‘L') and 50 oocytes from X. tropicalis (‘T'). Blots were probed with an antibody raised against the C terminus of the rat cerebellar type-1 IP3 receptor (Cardy et al., 1997), and data are representative of three blots under identical conditions. The positions of molecular-mass markers (250 kDa, 160 kDa) are indicated by arrows.
Superfusion of X. tropicalis oocytes with Ca2+-free Ringer's solution containing the phosphoinositide-coupled agonist lysophosphatidic acid (LPA, 1 μM: Kakizawa et al., 1998) triggered release of Ca2+ from the intracellular Ca2+ stores with spatial and temporal dynamics similar to that observed in X. laevis oocytes. However, the mean peak amplitudes of Ca2+ waves evoked by supra-maximal photorelease of IP3, measured using the low affinity Ca2+ indicator Oregon-green-5N, was slightly higher in the animal hemisphere of oocytes of X. tropicalis (Figure 4C, ΔF/F0=3.4±0.5, n=66 cells from five donors) than X. laevis (ΔF/F0=2.4±0.4, n=50 cells from five donors). Application of either caffeine (10 mM) or ryanodine (<5 μM) failed to appreciably elevate the cytoplasmic Ca2+ concentration (Figure 4C).
In summary, in all X. tropicalis oocytes examined, intracellular Ca2+ was released only by IP3 or phosphoinositide-coupled agonists. The lack of responses to photorelease of cADPR, application of caffeine and ryanodine, as well as photorelease of NAADP suggests that the only functional pathway of intracellular Ca2+ mobilization in X. tropicalis oocytes occurs via IP3 receptors.
To investigate this issue further, we performed immunoblotting analyses on membrane fractions prepared from X. tropicalis oocytes. An antibody raised against the rat type-1 IP3 receptor (Cardy et al., 1997), cross-reacted with a ∼255 kDa protein in crude membrane extracts from X. tropicalis oocytes (Figure 4D, lane ‘T'). This band migrated at the same size as the X. laevis IP3 receptor (Figure 4D, lane ‘L'), recognized from X. laevis membranes run in parallel, but migrated consistently lower than the rat cerebellar IP3 receptor (∼260 kDa) detected in rat cerebellar membranes (Figure 4D, lane ‘C').
Spatiotemporal aspects of IP3-mediated Ca2+ release in Xenopus tropicalis oocytes
Studies using X. laevis oocytes have played a pivotal role in elucidating a subcellular architecture of Ca2+ release events (Parker et al., 1996), that form the building blocks of global Ca2+ signals in many cell types (Bootman & Berridge, 1995; Berridge, 1997). We therefore examined whether Ca2+ signals in oocytes of X. tropicalis displayed a similar architecture.
Photorelease of increasing amounts of IP3 triggered a dose-dependent liberation of Ca2+ from intracellular Ca2+ stores (Figure 5A). At low photolytic intensities, Ca2+ release characteristically occurred as highly localized and transient events, known as ‘Ca2+ puffs' at discrete locations along the laser scan line (Parker & Yao, 1991). Similar to the hierarchical organization of Ca2+ release events observed in X. laevis oocytes (Sun et al., 1998), progressively higher concentrations of IP3 coordinated the activity of these localized Ca2+ puffs establishing abortive, then propagating, and finally synchronous Ca2+ waves across the laser scan line (Figure 5A). The peak amplitude of Ca2+ signals averaged across the entire scan line increased with increasing stimulus intensity (Figure 5B). The latency to first Ca2+ release was typically several seconds at the lowest stimulation intensities, but progressively decreased with increasing stimulation intensities towards an extrapolated lower limit of ∼90 ms with maximal stimulation intensities (Figure 5B). Under conditions of sustained photorelease of IP3, repetitive Ca2+ oscillations were established that were maintained with period varying between 10 and 90 s dependent on the intensity of stimulation throughout the duration of photorelease (Figure 5C). Therefore, in terms of the general spatial organization of intracellular Ca2+ signals, the recruitment of elementary Ca2+ puffs displays and global Ca2+ waves is similar pattern to that resolved in X. laevis oocytes (Parker & Yao, 1991; Yao et al., 1995; Sun et al., 1998).
Figure 5.
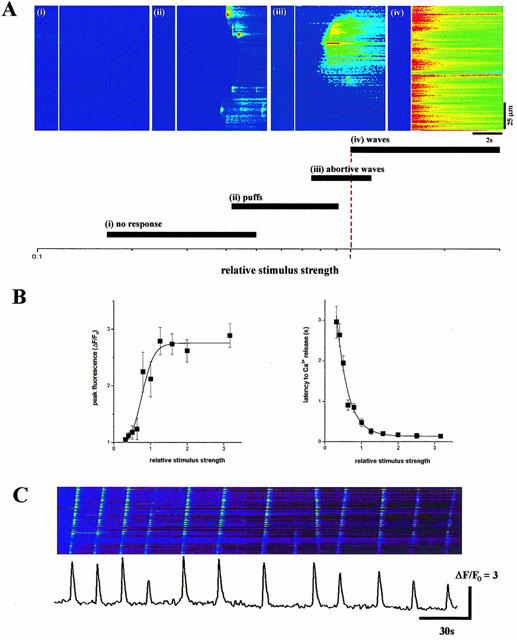
IP3 evoked Ca2+ signals in Xenopus tropicalis oocytes. (A) Photorelease of increasing concentrations of IP3 cause a variety of spatiotemporal patterns of Ca2+ release from intracellular Ca2+ stores. Left, confocal linescan images (i, ii, iii, iv) depict increasing fluorescence ratios of Oregon-green-1 (increasing free [Ca2+]) on a linear pseudocolour scale after delivery of photolysis flashes of increasing intensity (80, 120, 160 and 200 ms, respectively) when indicated by the white line. Each image is representative of each of the indicated categories of Ca2+ liberation (shown below) from local to global signals that are progressively coordinated by increasing levels of IP3. Data are expressed in terms of the ‘relative stimulus strength', defined as the minimal photolytic duration that consistently evoked a Ca2+ wave that propagated across the entire 100 μm laser scan line (dashed red line). (B) Photorelease of increasing concentrations of IP3 cause a dose-dependent release of Ca2+ from IP3 sensitive Ca2+ stores after a variable latency. Left, measurements of peak fluorescence intensity averaged along a 100 μm laser scan line were made from images such as shown in (A), within the animal hemisphere of oocytes previously microinjected with the fluorescent Ca2+ indicator Oregon-green-1 (40 μM, final concentration) and caged IP3 (final concentration 5 μM). Similar results were obtained in the vegetal hemisphere of X. tropicalis oocytes, albeit over an intensity range lower than the animal hemisphere because of attenuation of u.v.-light by the pigment granules in the animal pole. Data represent the average from 12 oocytes from four donor frogs. Right, measurements of the latency to the first detectable release of Ca2+ across the entire 100 μm laser scan line obtained from the same experiment. (C) Linescan image of fluorescence along a 100 μm laser line during sustained photorelease of IP3 in the animal hemisphere of a X. tropicalis oocyte showing the occurrence of repetitive Ca2+ oscillations. Profile represents the fluorescence intensity across a 31 pixel (∼4 μm region) throughout this 4 min period.
The elementary Ca2+ puffs represent the opening of IP3 receptor clusters at discrete locations on the endoplasmic reticulum. Given the smaller size of the X. tropicalis oocyte relative to that of X. laevis, we were interested to resolve whether the microscopic properties of Ca2+ puffs scaled in relation to the size of the oocyte. Specifically, we were keen to address whether the number of IP3 receptors activated within a cluster was different to that observed with X. laevis, or whether cluster size was independent of cell dimensions.
Figure 6A shows a representative record from which measurements of IP3-evoked Ca2+ puffs were obtained in X. tropicalis. Typically, Ca2+ puffs persisted for up to several hundred milliseconds, during which the fluorescence signal remained spatially restricted to within a few μms. We measured 182 sharply focused events in X. tropicalis oocytes, that involved Ca2+ release from single sites, clearly separated from other events. Using this data set, we applied an algorithm which estimates the amount of Ca2+ liberated during each event, known as the ‘signal mass' (Sun et al., 1998). The mean value of signal mass associated with Ca2+ puffs in X. tropicalis (24.8±4.0 signal mass units) was identical to that measured in oocytes from X. laevis (22.0±1.2 signal mass units, Figure 6B). These values are equivalent to the liberation of about 5×10⁻¹⁹ moles of calcium, using calibrations made previously (Sun et al., 1998). Furthermore, the distribution of ‘signal mass' in X. tropicalis followed a continuous exponential distribution, spanning a ∼100 fold range from the smallest to the largest events – similar to the observed continuum of Ca2+ puff sizes in X. laevis (Figure 6C). The spatiotemporal properties of the Ca2+ puffs was also similar in oocytes from each species: average duration at half-peak amplitude was 149±12 and 138±22 ms in X. laevis (n=50 events); spatial spread at half maximal amplitude 4.3±1.0 and 4.8±0.6 μm, n=50 events in X. tropicalis and X. laevis respectively. Therefore, despite the smaller volume of the X. tropicalis oocyte (∼20% of an equivalent stage VI X. laevis oocyte, Figure 1A), the microscopic organization and activatory kinetics of IP3 receptor clusters are almost identical.
Figure 6.
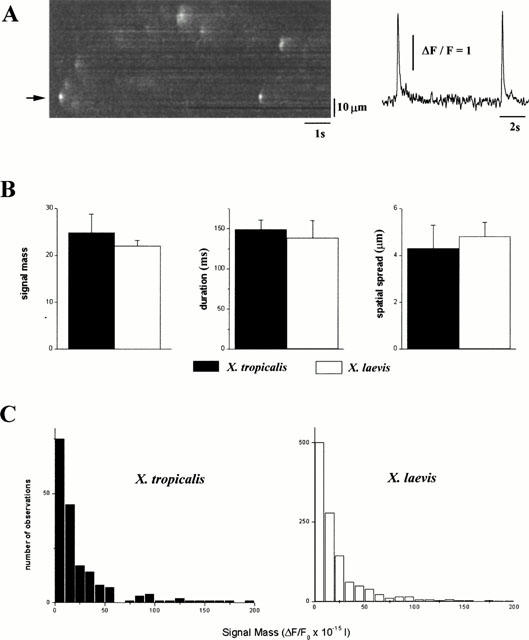
Microscopic properties of elementary Ca2+ release events in Xenopus tropicalis oocytes. (A) Representative linescan image showing Ca2+ puffs evoked in the animal hemisphere of X. tropicalis oocytes by a photolysis flash of a strength ∼50% of that which triggered a propagating Ca2+ wave. Traces show fluorescence ratios measured from a 3 pixel (∼0.5 μm region) centered on the puff site indicated by the arrow. (B) Histograms comparing the average ‘signal mass' (Sun et al., 1998), half-duration and spatial spread (full width at half maximum amplitude) associated with Ca2+ puffs in X. tropicalis (filled bars) and X. laevis (open bars) oocytes. (C) Distributions of ‘signal mass' associated with Ca2+ puffs in X. tropicalis (n=182 events, filled bars) and X. laevis oocytes (n=1161 events, open bars). Events were recorded in the animal hemisphere of the oocytes using Oregon green 488 BAPTA-1. Note, 1 signal mass unit corresponds to a doubling of fluorescence throughout a volume of 1 fl, corresponding to approximately 2×10⁻²⁰ moles of calcium (Sun et al., 1998).
Localization of active Ca2+ release sites
To investigate the spatial organization of Ca2+ release sites, we measured the occurrence of Ca2+ puff sites at various focal depths into the X. tropicalis oocyte. In X. laevis oocytes, functional imaging suggests that Ca2+ release sites are constrained within a superficial 6 μm band within the ER (Callamaras & Parker, 1999). However, this interpretation was compounded by the optical turbidity of the cytoplasm, which hindered imaging at depths greater than ∼10 – 15 μm into the oocyte (Callamaras & Parker, 1999). Given the greater imaging depth possible in X. tropicalis oocytes (∼25 μm), we could now resolve whether deeper puff sites are present in these cells.
Figure 7A collates measurements of puff frequencies and amplitudes across a 100 μm line focused at various depths within X. tropicalis oocytes. The combined data set revealed that Ca2+ puffs occurred throughout an 8 μm band in the peripheral ER, with the majority of puffs occurring at the level of the pigment granules (Figure 7A). Few puffs were observed at depths greater than ∼4 – 5 μm into the X. tropicalis oocyte. This decrease did not result because puff amplitude became attenuated, and therefore more difficult to detect, as the mean amplitude of Ca2+ puffs did not decline appreciably at increasing depths (Figure 7A, open bars). Further, EYFP staining of the ER was clearly resolved at depths much greater (∼25 μm into the oocyte, Figure 2A), than even the deepest puffs (∼10 μm, Figure 7A) Therefore, the results suggest that active Ca2+ release sites are constrained to the superficial cortical ER of these oocytes.
Figure 7.
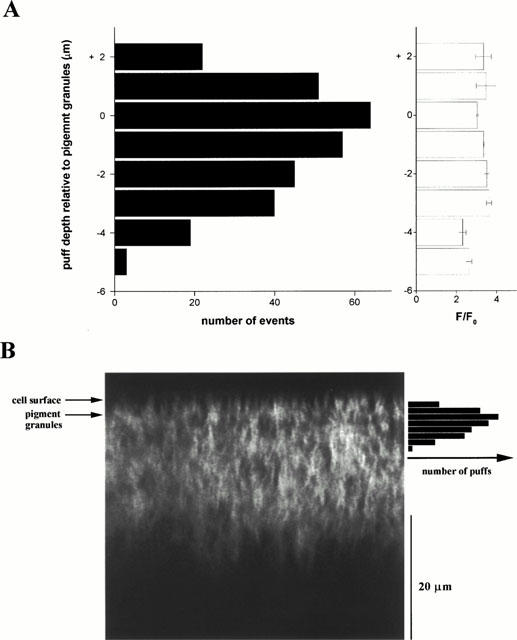
Axial distribution of Ca2+ puff sites in the X. tropicalis oocyte. (A) Radial distribution of Ca2+ puff sites plotted relative to the position of the pigment granules in each scan. Black bars show number of puffs (from a total of 301 events) observed at different radial depths in the animal hemisphere of X. tropicalis oocytes. Open bars depict measurements of the peak amplitude of the fluorescence change from the same events grouped by axial position. (B) Confocal z-scan image in a X. tropicalis oocyte expressing an ER-targeted EYFP construct, displayed in relation to the observed axial distribution of puff sites replotted from (A).
Electrical properties of X. tropicalis oocytes
Despite the variability between different batches of X. tropicalis, as well as X. laevis (Kusano et al., 1982), we found that the average resting membrane potential of X. tropicalis oocytes was more negative (−42±5 mV, n=15 cells, five donor animals) than the resting potential of X. laevis oocytes measured in parallel (−30±3 mV, n=15 cells, five donor animals). Further, the mean input resistance (4.3±1.3 MΩ, s.d. n=6 cells; measured between −40 and −60 mV) of X. tropicalis oocytes was higher than that in X. laevis oocytes, similarly treated with collagenase (e.g. 316 kΩ: Kusano et al., 1982). Although part of this difference results from the smaller membrane surface area (∼3 fold, neglecting microvilli and infoldings) of X. tropicalis oocytes, the specific membrane resistance is nevertheless ∼4 fold greater, suggesting an inherent difference in resting membrane conductance between the two species.
IP3-dependent stimulation of a Ca2+-activated membrane conductance
Electrophysiological studies have shown that the plasma membrane of X. laevis oocytes contains numerous Ca2+-activated chloride channels (Miledi & Parker, 1984). These mediate a fast block to polyspermy in the newly fertilized egg and serve as a useful tool to monitor intracellular Ca2+ signals. To assay for the presence of analogous channels in the X. tropicalis oocyte, we used the two electrode voltage clamp approach to measure membrane currents evoked by either bath application of agonist or photorelease of IP3 in the cytosol.
Superfusion of LPA (1 μM) evoked an oscillatory inward current in X. tropicalis oocytes (Figure 8A, inset), the properties of which were investigated further using oocytes microinjected with caged IP3. Figure 8A shows superimposed records of membrane currents (at a holding potential of −100 mV) evoked by photolysis flashes of increasing durations. As in oocytes of X. laevis, a certain threshold flash was required to evoke any response, and the current then showed progressively greater amplitudes and shorter latencies as the photolysis flash was lengthened (Callamaras & Parker, 2000). Current/voltage relationships from X. tropicalis oocytes stimulated by weak and strong photolytic flashes (Figure 8B), revealed that currents evoked by both weak and strong stimuli reversed direction at a potential of −20±2 mV (n=5 oocytes, three donor animals), a value close to the equilibrium potential for chloride ions in X. laevis oocytes (Dascal, 1987). As the membrane potential was clamped at potentials positive to this reversal potential, the peak amplitudes of outward currents evoked by both strong and weak photolysis flashes increased progressively in size. At potentials more negative than the reversal potential, the responses to strong flashes increased markedly, but the peak magnitudes of inward currents evoked by weak photolysis flashes displayed an outward rectification with little change with increasing hyperpolarization (Figure 8B). This I/V relationship is similar to that described previously for chloride currents evoked in the X. laevis oocyte by photorelease of IP3 (Parker & Miledi, 1989) and the shift from a rectifying to a linear characteristic with strong stimuli probably results from a voltage-dependent change in Ca2+ affinity of the chloride channels (Callamaras & Parker, 2000).
Figure 8.
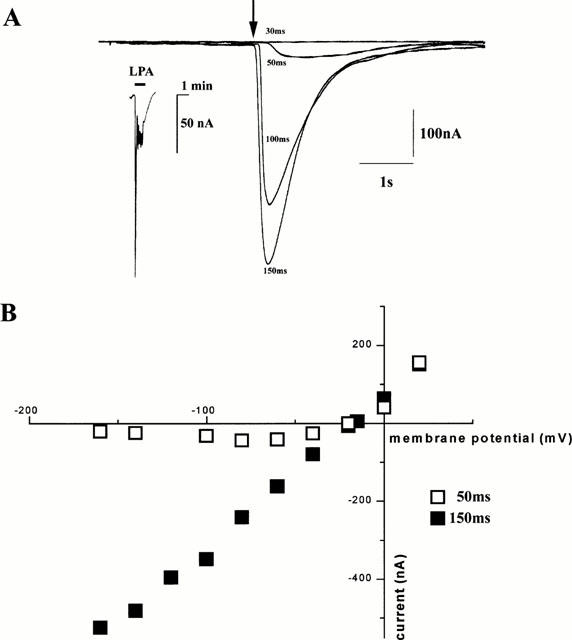
Ca2+ release from IP3 sensitive Ca2+ stores activates a Cl− membrane conductance in Xenopus tropicalis oocytes. (A) Superimposed traces of whole cell membrane current showing increasing responses to progressively longer photolysis flashes (30, 50, 100 and 150 ms duration), delivered when indicated by the arrow with the oocyte clamped at −100 mV. Inset, membrane current evoked by superfusion of LPA (1 μM, black bar) in a X. tropicalis oocyte clamped at −60 mV. (B) Peak amplitude of membrane currents evoked by photorelease of caged IP3 in a X. tropicalis oocyte, with just suprathreshold (open squares, ∼50 ms duration) and strong (filled squares, ∼150 ms) photolysis flashes. The flash duration of 50 ms was slightly above the threshold (∼40 ms) to evoke a membrane current. Data are representative of responses obtained from a total of five oocytes from three different donor animals. Recordings were made at room temperature, with oocytes bathed in Ringer's solution.
To compare the relative densities of Ca2+-activated chloride channels in X. tropicalis and X. laevis oocytes, we measured chloride currents evoked in both species at the same clamp potential (−100 mV) by photolysis flashes at supra-maximal strength that illuminated a constant area (∼200 μm diameter spot) of the animal hemisphere. The peak magnitude of these IP3-evoked currents was on average lower in X. tropicalis oocytes (−352±75 nA, n=8 cells) than in X. laevis oocytes (e.g. 600 – 800 nA, Callamaras & Parker, 2000) when measured in response to saturating flashes at a holding potential of −100 mV.
Discussion
Comparison of oocytes from X. tropicalis and X. laevis
Our results show that the properties of the Ca2+ signalling pathway in X. tropicalis oocytes closely resemble those of the well characterized X. laevis oocyte. Specifically, IP3 receptors serve as the sole intracellular Ca2+ release channel in oocytes from both species; both show a similar hierarchical spatiotemporal organization of Ca2+ signals involving elementary Ca2+ puffs and global Ca2+ waves; and in both cells IP3-evoked Ca2+ elevations lead to activation of membrane Cl− currents. Oocytes of X. tropicalis thus provide the same advantages that have made X. laevis oocytes such a popular model cell system for studying IP3-mediated Ca2+ signalling, and it is likely that the wealth of information already derived from X. laevis oocytes will be directly applicable to X. tropicalis. Furthermore, the amenability of X. tropicalis to transgenic approaches (Amaya et al., 1998) offers considerable further opportunities and, together with our findings of other practical advantages, suggests that X. tropicalis oocytes may offer a superior model system.
One notable advantage for imaging in live cells is that confocal sections can be resolved to appreciably greater depths in X. tropicalis oocytes. The cytoplasm of pipid frogs is highly turbid, so that satisfactory confocal images can be obtained in X. laevis oocytes only to a depth of about 10 – 15 μm (Callamaras & Parker, 1999). Fortunately, most of the Ca2+ releasing apparatus appears concentrated in the thin cortical shell that can be visualized, but questions remain regarding Ca2+ release in the remaining 94% of the cell volume that is unresolvable (Callamaras & Parker, 1999). Our experience has been that 2-photon microscopy offers little improvement over conventional confocal imaging in this regard (I. Parker & J.S. Marchant; unpublished data), and has further drawbacks of great expense and requiring the use of albino oocytes to avoid pigment granules absorbing heat from the strong infra-red laser beam. Instead, use of X. tropicalis oocytes permits imaging by conventional confocal microscopy to depths at least twice as great as in X. laevis oocytes (Figures 2 and 3). This has allowed us to unambiguously confirm the cortical localization of puff sites in X. tropicalis oocytes (Figure 6C,D), whereas earlier studies in X. laevis oocytes were limited by our ability to visualize deeper Ca2+ release events (Callamaras & Parker, 1999).
The improved visualization into X. tropicalis oocytes is likely to be useful for numerous other physiological and morphological studies in live cells. In particular, it may allow confocal imaging of nuclear processes occurring in and around the germinal vesicle, which is displaced about 75 μm below the cell membrane in the animal hemisphere (Gard, 1993). Although this depth is greater than our present limit of resolution, manipulations such as the use of microtubule-disrupting agents to cause the germinal vesicle to float into closer apposition to the membrane of the animal hemisphere (∼25 μm, Colman et al., 1981) may make high-resolution nuclear visualization possible.
Similarly to oocytes of X. laevis (Miledi & Parker, 1984; Callamaras & Parker, 2000), those of X. tropicalis display Ca2+-activated Cl− currents that can be used as a simple, endogenous monitor of IP3-mediated signalling. The absolute current density (current per unit area of oocyte surface) evoked by supra-maximal stimulation in X. tropicalis is only about 47% of that in X. laevis; most probably resulting from a lower density of channels in the surface membrane, though it is also possible that there may be differences in single channel conductance and/or gating. Nevertheless, the currents are sufficiently large to present no problem in voltage-clamp recording and their reduced magnitude is, to a large extent, compensated by the higher input resistance of X. tropicalis oocytes which facilitates recordings with lower drift and noise.
A further advantage of X. tropicalis oocytes is that they appear more ‘healthy' than oocytes of X. laevis: as manifest by their enhanced viability, more rapid expression of exogenous proteins, larger Ca2+ signals, and greater resting potential. The quality of Xenopus oocytes is notoriously variable between donor frogs and between batches of frogs supplied by commercial vendors (Kusano et al., 1982). Nevertheless, our experience with X. tropicalis frogs over a period of 12 months (∼25 frogs, five batches) indicates a consistent advantage over X. laevis oocytes, which probably reflects an intrinsic difference between the two species.
Subcellular architecture of Ca2+ signalling in X. tropicalis oocytes
Morphological studies in the X. laevis oocyte, using vital dyes to label the ER have suggested a polarized distribution within the oocyte, with a greater density of ER and larger cytoplasmic Ca2+ signals occurring within the animal hemisphere (Callamaras et al., 1998). However, the interpretation of fluorescence images stained using lipophyllic dyes such as fast DiI (e.g. Callamaras & Parker, 1999), is confounded by problems of non-specificity (e.g. mitochondrial staining, Bereiter-Hahn & Vöth, 1994), especially in the lipid-rich intracellular environment of the oocyte. Consequently, we exploited the advantages of genetically encoded fluorescent constructs, targeted endogenously following direct nuclear injection, to resolve the morphology of the ER in X. tropicalis and X. laevis oocytes (Figures 2 and 3). Lateral confocal sections in oocytes expressing the construct revealed a characteristic network of tubules (Figure 3), reminiscent of the organization of ER cisternae as resolved by ultrastructural analyses (Charbonneau & Grey, 1984; Campanella et al., 1984). In oocytes from both species, the animal hemisphere contained a greater EYFP fluorescence volume (∼500%) compared to the vegetal hemisphere. Assuming that the expression of EYFP-ER is constant per unit volume of ER across the oocyte, then these measurements suggest that the animal hemisphere contains a considerably greater amount of ER. In contrast, the amplitudes of Ca2+ signals measured using a low affinity Ca2+ indicator Oregon green-5N showed a much smaller hemispheric asymmetry (peak signal in animal hemisphere ∼113% of that in the vegetal hemisphere of X. tropicalis oocytes). A possible explanation for this discrepancy is that sites of active Ca2+ release remained localized within a superficial 8 μm band, irrespective of the distribution of the ER (up to ∼25 μm resolvable axial depth of ER in X. tropicalis oocytes). Consequently, one would not expect a direct proportionality between amount of total ER and the magnitude of local Ca2+ gradients.
Measurements of radial Ca2+ puff distribution (Figure 7) are similar to those in X. laevis oocytes (Callamaras & Parker, 1999), and are consistent with immunological data from fixed specimens that suggest a targeting of IP3-sensitive release sites to the peripheral ER (Parys et al., 1992; Kume et al., 1993; Callamaras & Parker, 1999) where they are optimally localized to mobilize Ca2+ in response to egg activation. Given that a stage VI X. tropicalis oocyte has a diameter of ∼0.7 mm, compared to ∼1.2 – 1.3 mm for X. laevis, it is noteworthy that the width of the band of Ca2+ releasing sites is if anything broader (∼8 μm, Figure 6) than that of X. laevis (∼6 μm, Callamaras & Parker, 1999). The processes that target IP3 receptors to within the superficial band of ER, and the mechanisms that repress Ca2+ release mechanisms during this trafficking are unknown.
Furthermore, both the size of the elementary Ca2+ release events (estimated using the ‘signal mass' algorithm) and the kinetics of individual Ca2+ puffs appear virtually identical in oocytes from both species (Figure 6). From estimates of the unitary Ca2+ current associated with a single IP3 receptor under physiological conditions, (∼0.5 pA, Bezprozvanny & Ehrlich, 1994), we have previously estimated that the Ca2+ flux associated with the largest Ca2+ puffs necessitates that a clustered unit of IP3 receptors contains at least five active channels. Therefore, despite the smaller volume of the X. tropicalis oocyte (∼1/5 of X. laevis), the microscopic properties of individual Ca2+ release units appear similar.
In conclusion, these results establish that while the X. tropicalis oocyte closely resembles the more familiar X. laevis oocyte in terms of organization of its intracellular Ca2+ signalling apparatus and the capacity to act as an expression system for heterologous proteins, it possesses further practical advantages over X. laevis in terms of oocyte quality and confocal imaging depth. These advantages, in addition to the amenability of X. tropicalis to transgenic techniques (Amaya et al., 1998), prompt consideration of X. tropicalis in conjunction with, or as an alternative model system, to X. laevis.
Acknowledgments
This work was supported by the NIH (GM 48071) and by a Wellcome Trust Fellowship (053102) to J.S. Marchant.
Abbreviations
- cADPR
cyclic ADP-ribose
- ER
endoplasmic reticulum
- EYFP
enhanced yellow fluorescent protein
- IP3
inositol (1,4,5) trisphosphate
- LPA
lysophosphatidic acid
- NAADP
nicotinic acid adenine dinucleotide phosphate
References
- AARHUS R., GEE K., LEE H.C. Caged cyclic ADP-ribose. J. Biol. Chem. 1995;270:7745–7749. doi: 10.1074/jbc.270.13.7745. [DOI] [PubMed] [Google Scholar]
- AMAYA E., OFFIELD M.F., GRAINGER R.M. Frog genetics: Xenopus tropicalis jumps into the future. Trends Genet. 1998;14:253–255. doi: 10.1016/s0168-9525(98)01506-6. [DOI] [PubMed] [Google Scholar]
- BEREITER-HAHN J., VÖTH M. Dynamics of mitochondria in living cells: shape changes, dislocations, fusion, and fission of mitochondria. Microscopy Res. Technique. 1994;27:198. doi: 10.1002/jemt.1070270303. [DOI] [PubMed] [Google Scholar]
- BERRIDGE M.J. Elementary and global aspects of calcium signalling. J. Physiol. 1997;499:291–306. doi: 10.1113/jphysiol.1997.sp021927. [DOI] [PMC free article] [PubMed] [Google Scholar]
- BEZPROZVANNY I., EHRLICH B.E. Inositol (1,4,5)-trisphosphate (InsP3)-gated Ca channels from cerebellum: conduction properties for divalent cations and regulation by intraluminal calcium. J. Gen. Physiol. 1994;104:821–856. doi: 10.1085/jgp.104.5.821. [DOI] [PMC free article] [PubMed] [Google Scholar]
- BOOTMAN M.D., BERRIDGE M.J. The elemental principles of calcium signaling. Cell. 1995;83:675–678. doi: 10.1016/0092-8674(95)90179-5. [DOI] [PubMed] [Google Scholar]
- CALLAMARAS N., PARKER I. Inositol 1,4,5-trisphosphate receptors in Xenopus laevis oocytes: localization and modulation by Ca2+ Cell Calcium. 1994;15:66–78. doi: 10.1016/0143-4160(94)90105-8. [DOI] [PubMed] [Google Scholar]
- CALLAMARAS N., PARKER I. Radial localization of inositol 1,4,5-trisphosphate-sensitive Ca2+ release site in Xenopus oocytes resolved by axial confocal linescan imaging. J. Gen. Physiol. 1999;113:199–213. doi: 10.1085/jgp.113.2.199. [DOI] [PMC free article] [PubMed] [Google Scholar]
- CALLAMARAS N., PARKER I. Ca2+-dependent activation of Cl− currents in Xenopus oocytes is modulated by voltage. Am. J. Physiol. 2000;278:C677–C675. doi: 10.1152/ajpcell.2000.278.4.C667. [DOI] [PubMed] [Google Scholar]
- CALLAMARAS N., SUN X.-P., IVORRA I., PARKER I. Hemispheric asymmetry of macroscopic and elementary Ca2+ signals mediated by InsP3 in Xenopus oocytes. J. Physiol. 1998;511:395–405. doi: 10.1111/j.1469-7793.1998.395bh.x. [DOI] [PMC free article] [PubMed] [Google Scholar]
- CAMACHO P., LECHLEITER J.D. Increased frequency of calcium waves in Xenopus laevis oocytes that express a calcium-ATPase. Science. 1993;260:226–229. doi: 10.1126/science.8385800. [DOI] [PubMed] [Google Scholar]
- CAMPANELLA C., ANDREUCCETTI P., TADDEI C., TALEVI R. The modifications of cortical endoplasmic reticulum during in vitro maturation of Xenopus laevis oocytes and its involvement in cortical granule exocytosis. J. Exp. Zool. 1984;229:283–293. doi: 10.1002/jez.1402290214. [DOI] [PubMed] [Google Scholar]
- CANNATELLA D.C., TRUEB L. Evolution of pipoid frogs: intergeneric relationships of the aquatic frog family Pipidae (Anura) Zool. J. Linnaean Soc. 1988;94:1–38. [Google Scholar]
- CARDY T.J.A., TRAYNOR D., TAYLOR C.W. Differential regulation of types-1 and -3 inositol trisphosphate receptors by cytosolic Ca2+ Biochem. J. 1997;328:785–793. doi: 10.1042/bj3280785. [DOI] [PMC free article] [PubMed] [Google Scholar]
- CHARBONNEAU M., GREY R.D. The onset of activation responsiveness during maturation coincides with the formation of the cortical endoplasmic reticulum in oocytes of Xenopus laevis. Dev. Biol. 1984;102:90–97. doi: 10.1016/0012-1606(84)90177-5. [DOI] [PubMed] [Google Scholar]
- COLMAN A., MORSER J., LANE C., BESLEY J., WYLIE C., VALLE G. Fate of secretory proteins trapped in oocytes of Xenopus laevis by disruption of the cytoskeleton or by imbalanced subunit synthesis. J. Cell. Biol. 1981;91:770–780. doi: 10.1083/jcb.91.3.770. [DOI] [PMC free article] [PubMed] [Google Scholar]
- DASCAL N. The use of Xenopus oocytes for the study of ion channels. CRC Crit. Rev. Biochem. 1987;22:317–387. doi: 10.3109/10409238709086960. [DOI] [PubMed] [Google Scholar]
- DELISLE S., BLONDEL O., LONGO F.J., SCHNABEL W.E., BELL G.I., WELSH M.J. Expression of inositol 1,4,5-trisphosphate receptors changes the Ca2+ signal of Xenopus oocytes. Am. J. Physiol. 1996;270:C1255–C1261. doi: 10.1152/ajpcell.1996.270.4.C1255. [DOI] [PubMed] [Google Scholar]
- DUMONT J.N. Oogenesis in Xenopus laevis (Daudin). I. Stages of oocyte development in laboratory maintained animals. J. Morphol. 1972;136:153–180. doi: 10.1002/jmor.1051360203. [DOI] [PubMed] [Google Scholar]
- GALIONE A. Cyclic ADP-ribose: a new way to control calcium. Science. 1993;259:325–326. doi: 10.1126/science.8380506. [DOI] [PubMed] [Google Scholar]
- GARD D.L. Ectopic spindle assembly during maturation of Xenopus oocytes:evidence for functional polarization of the oocyte cortex. Dev. Biol. 1993;159:298–310. doi: 10.1006/dbio.1993.1242. [DOI] [PubMed] [Google Scholar]
- GENAZZANI A.A., GALIONE A. A Ca2+ release mechanism gated by the novel pyridine nucleotide, NAADP. Trends Pharmacol. Sci. 1997;18:108–110. doi: 10.1016/s0165-6147(96)01036-x. [DOI] [PubMed] [Google Scholar]
- GUILLE M. Molecular methods in developmental biology: Xenopus and zebrafish. Totowa, NJ: Humana Press; 1999. [Google Scholar]
- GUNDERSEN C.B., MILEDI R., PARKER I. Messenger RNA from human brain induces drug- and voltage-operated channels in Xenopus oocytes. Nature. 1984;308:421–424. doi: 10.1038/308421a0. [DOI] [PubMed] [Google Scholar]
- GURDON J.B., LANE C.D., WOODLAND H.R., MARBAIX G. Use of frog eggs and oocytes for the study of messenger RNA and its translation in living cells. Nature. 1971;233:177–182. doi: 10.1038/233177a0. [DOI] [PubMed] [Google Scholar]
- KAKIZAWA K., NOMURA H., YOSHIDA A., UEDA H. Signaling of lysophosphatidic acid-evoked chloride curent: calcium release from inositol trisphosphate-sensitive store. Mol. Brain Res. 1998;61:232–237. doi: 10.1016/s0169-328x(98)00229-0. [DOI] [PubMed] [Google Scholar]
- KAY B.K., PENG H.B. Xenopus laevis: Practical uses in cell and molecular biology. San Diego: Academic Press; 1991. [PubMed] [Google Scholar]
- KOBEL H.R., DU PASQUIER L. Genetics of polyploid Xenopus. Trends Genet. 1986;2:310–315. [Google Scholar]
- KOBRINSKY E., ONDRIAS K., MARKS A.R. Expressed ryanodine receptor can substitute for the inositol 1,4,5-trisphosphate receptor in Xenopus laevis oocytes during progesterone-induced maturation. Dev. Biol. 1995;172:531–540. doi: 10.1006/dbio.1995.8058. [DOI] [PubMed] [Google Scholar]
- KROLL K.L., AMAYA E. Transgenic Xenopus embryos from sperm nuclear transplantations reveal FGF signaling requirements during gastrulation. Development. 1996;122:3173–3183. doi: 10.1242/dev.122.10.3173. [DOI] [PubMed] [Google Scholar]
- KUME S., MUTO A., ARUGA J., NAKAGAWA T., MICHIKAWA T., FURUICHI T., NAKADE S., OKANO H., MIKOSHIBA K. The Xenopus IP3 receptor: structure, function and localization in oocytes and eggs. Cell. 1993;73:555–570. doi: 10.1016/0092-8674(93)90142-d. [DOI] [PubMed] [Google Scholar]
- KUSANO K., MILEDI R., STINNAKRE J. Cholinergic and catecholaminergic receptors in the Xenopus oocyte membrane. J. Physiol. 1982;328:143–170. doi: 10.1113/jphysiol.1982.sp014257. [DOI] [PMC free article] [PubMed] [Google Scholar]
- LECHLEITER J.D., CLAPHAM D.E. Molecular mechanisms of intracellular calcium excitability in X. laevis oocytes. Cell. 1992;64:283–294. doi: 10.1016/0092-8674(92)90409-6. [DOI] [PubMed] [Google Scholar]
- LECHLEITER J.D., GIRARD S., CLAPHAM D., PERALTA E. Subcellular patterns of calcium release determined by G protein-specific residues of muscarinic receptors. Nature. 1991;350:505–508. doi: 10.1038/350505a0. [DOI] [PubMed] [Google Scholar]
- LEE H.C., AARHUS R., GEE K.R., KESTNER T. Caged nicotinic acid adenine dinucleotide phosphate. Synthesis and use. J. Biol. Chem. 1997;272:4172–4178. doi: 10.1074/jbc.272.7.4172. [DOI] [PubMed] [Google Scholar]
- MARCHANT J.S., BEECROFT M.D., RILEY A.M., JENKINS D.J., MARWOOD R.D., TAYLOR C.W., POTTER B.V.L. Disaccharide polyphosphates based upon adenophostin A activate hepatic inositol trisphosphate receptors. Biochemistry. 1997;36:12780–12790. doi: 10.1021/bi971397v. [DOI] [PubMed] [Google Scholar]
- MILEDI R., PARKER I. Chloride current induced by injection of calcium into Xenopus oocytes. J. Physiol. 1984;357:173–183. doi: 10.1113/jphysiol.1984.sp015495. [DOI] [PMC free article] [PubMed] [Google Scholar]
- NAKAMURA F., GOSHIMA Y., STRITTMATTER S.M., KAWAMOTO S. Isolation of receptor clones by expression screening in Xenopus oocytes. Methods Mol. Biol. 1999;128:1–18. doi: 10.1385/1-59259-683-5:1. [DOI] [PubMed] [Google Scholar]
- PARKER I., CALLAMARAS N., WIER W.G. A high-resolution, confocal laser-scanning microscope and flash photolysis system for physiological studies. Cell Calcium. 1997;21:441–452. doi: 10.1016/s0143-4160(97)90055-5. [DOI] [PubMed] [Google Scholar]
- PARKER I., CHOI J., YAO Y. Elementary events of InsP3-induced Ca2+ liberation in Xenopus oocytes: hot spots, puffs and blips. Cell Calcium. 1996;20:105–121. doi: 10.1016/s0143-4160(96)90100-1. [DOI] [PubMed] [Google Scholar]
- PARKER I., IVORRA I. Caffeine inhibits inositol trisphosphate-mediated liberation of intracellular calcium in Xenopus oocytes. J. Physiol. 1991;433:229–240. doi: 10.1113/jphysiol.1991.sp018423. [DOI] [PMC free article] [PubMed] [Google Scholar]
- PARKER I., MILEDI R. Nonlinearity and facilitation in phosphoinositide signaling studied by the use of caged inositol trisphosphate in Xenopus oocytes. J. Neurosci. 1989;9:4068–4077. doi: 10.1523/JNEUROSCI.09-11-04068.1989. [DOI] [PMC free article] [PubMed] [Google Scholar]
- PARKER I., YAO Y. Regenerative release of calcium from functionally discrete subcellular stores by inositol trisphosphate. Proc. R. Soc. Lond. B. 1991;246:269–274. doi: 10.1098/rspb.1991.0154. [DOI] [PubMed] [Google Scholar]
- PARYS J.B., BEZPROZVANNY I. The inositol trisphosphate receptor of Xenopus oocyte. Cell. Calcium. 1995;18:353–363. doi: 10.1016/0143-4160(95)90051-9. [DOI] [PubMed] [Google Scholar]
- PARYS J.B., SERNETT S.W., DELISLE S., SNYDER P.M., WELSH M.J., CAMPBELL K.P. Isolation, characterization and localization of the inositol 1,4,5-trisphosphate receptor protein in Xenopus laevis oocytes. J. Biol. Chem. 1992;267:18776–18782. [PubMed] [Google Scholar]
- PONCE DAWSON S., KEIZER J., PEARSON J.E. Fire-diffuse-fire model of dynamics of intracellular calcium waves. Proc. Natl. Acad. Sci. U.S.A. 1999;96:6060–6063. doi: 10.1073/pnas.96.11.6060. [DOI] [PMC free article] [PubMed] [Google Scholar]
- STREB H., IRVINE R.F., BERRIDGE M.J., SCHULZ I. Release of Ca2+ from a nonmitochondrial store of pancreatic acinar cells by inositol trisphosphate. Nature. 1983;306:67–69. doi: 10.1038/306067a0. [DOI] [PubMed] [Google Scholar]
- SUN X.-P., CALLAMARAS N., MARCHANT J.S., PARKER I. A continuum of InsP3-mediated elementary Ca2+ signalling events in Xenopus oocytes. J. Physiol. 1998;509:67–80. doi: 10.1111/j.1469-7793.1998.067bo.x. [DOI] [PMC free article] [PubMed] [Google Scholar]
- TAYLOR C.W., BROAD L.M. Pharmacological analysis of intracellular Ca2+ signalling: problems and pitfalls. Trends Pharmacol. Sci. 1998;19:370–375. doi: 10.1016/s0165-6147(98)01243-7. [DOI] [PubMed] [Google Scholar]
- THEODOULOU F.L., MILLER A.J. Xenopus oocytes as a heterologous expression system. Methods Mol. Biol. 1995;49:317–340. doi: 10.1385/0-89603-321-X:317. [DOI] [PubMed] [Google Scholar]
- WALKER J.W., SOMLYO A.V., GOLDMAN Y.E., SOMLYO A.P., TRENTHAM D.R. Kinetics of smooth and skeletal muscle activation by laser pulse photolysis of caged inositol 1,4,5-trisphosphate. Nature. 1987;327:249–252. doi: 10.1038/327249a0. [DOI] [PubMed] [Google Scholar]
- YAO Y., CHOI J., PARKER I. Quantal puffs of intracellular Ca2+ evoked by inositol trisphosphate in Xenopus oocytes. J. Physiol. 1995;482:533–553. doi: 10.1113/jphysiol.1995.sp020538. [DOI] [PMC free article] [PubMed] [Google Scholar]